Blood Pressure Cuffs Market Size and Share
Market Overview
| Study Period | 2020 - 2031 |
|---|---|
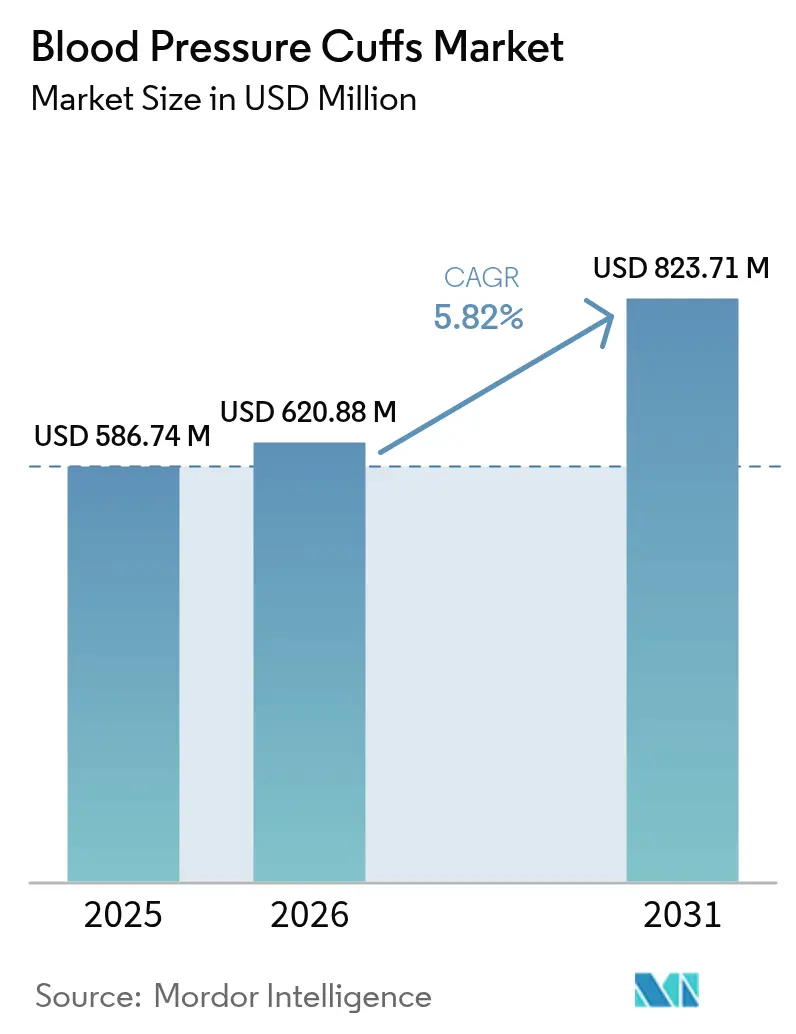
| Market Size (2026) | USD 620.88 Million |
| Market Size (2031) | USD 823.71 Million |
| Growth Rate (2026 - 2031) | 5.82% CAGR |
| Fastest Growing Market | Asia Pacific |
| Largest Market | North America |
| Market Concentration | Medium |
Major Players *Disclaimer: Major Players sorted in no particular order Image © Mordor Intelligence. Reuse requires attribution under CC BY 4.0. | |
Blood Pressure Cuffs Market Analysis by Mordor Intelligence
The Blood Pressure Cuffs Market size was valued at USD 586.74 million in 2025 and estimated to grow from USD 620.88 million in 2026 to reach USD 823.71 million by 2031, at a CAGR of 5.82% during the forecast period (2026-2031).
Uptake accelerates as governments embed blood-pressure-focused quality metrics into reimbursement schedules and as health systems migrate from intermittent measurements to connected, longitudinal monitoring. Population aging, the steadily rising incidence of hypertension, and the shift to value-based care are expanding the installed base of automated and Bluetooth-enabled cuffs that feed electronic medical records. Hospitals are simultaneously tightening infection-control protocols, steering procurement toward single-patient disposables. Meanwhile, new CPT and ASCVD codes allow clinicians to bill for remote blood pressure surveillance, making cuff connectivity a core purchasing criterion.
Key Report Takeaways
- By usage type, reusable cuffs held 50.23% of the blood pressure cuffs market share in 2025, while disposable cuffs are forecast to expand at a 6.51% CAGR to 2031.
- By age group, the adult segment captured 69.51% revenue share in 2025; pediatric cuffs are projected to grow at a 7.01% CAGR through 2031.
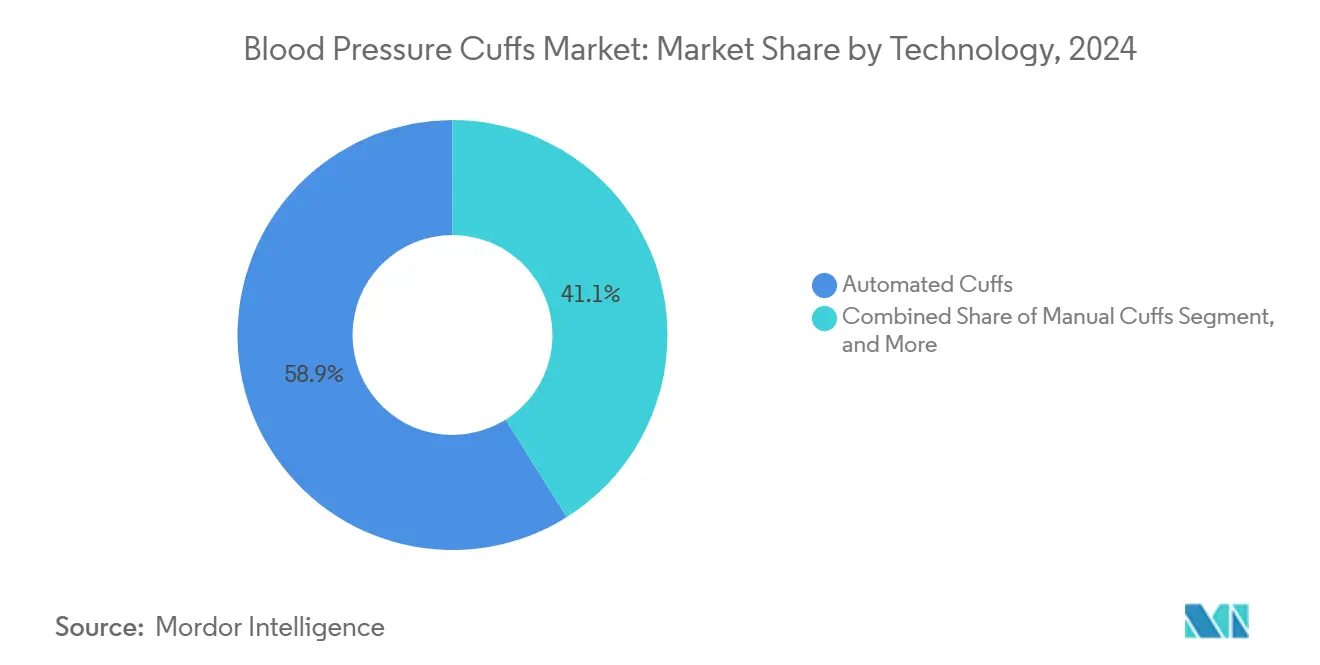
- By technology, automated cuff led the blood pressure cuffs market with a 58.22% share, and Bluetooth-enabled cuffs are expected to advance at a 9.18% CAGR through 2031.
- By end user, hospitals accounted for 36.17% of 2025 revenue, whereas home-care settings recorded the fastest CAGR at 7.79% through 2031.
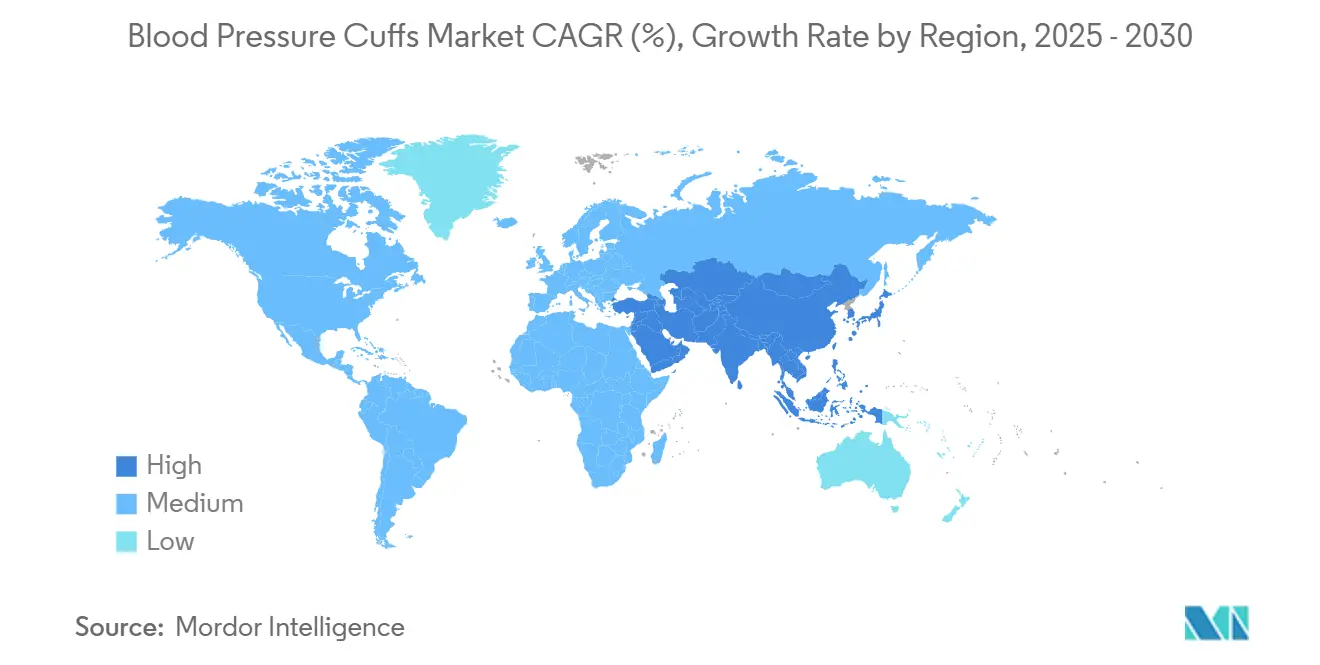
- By geography, North America dominated the market with a 34.97% market share in 2025; the Asia-Pacific region is expected to have the highest regional CAGR of 7.66% from 2025 to 2031.
Note: Market size and forecast figures in this report are generated using Mordor Intelligence’s proprietary estimation framework, updated with the latest available data and insights as of 2026.
Global Blood Pressure Cuffs Market Trends and Insights
Driver Impact Analysis*
| Driver | (~) % Impact on CAGR Forecast | Geographic Relevance | Impact Timeline |
|---|---|---|---|
| Hypertension Prevalence & Screening Programmes | +1.2% | North America & Europe lead | Medium term (2-4 years) |
| Ageing Population and Chronic-Care Burden | +0.9% | Developed markets worldwide | Long term (≥ 4 years) |
| Shift Toward Disposable Cuffs to Curb HAIs | +0.8% | Global, hospital settings | Short term (≤ 2 years) |
| Expansion of Home-Health & Telemonitoring | +1.1% | North America & EU lead, APAC following | Medium term (2-4 years) |
| AI-driven EMR Analytics Need Standardized Data | +0.7% | North America & EU | Medium term (2-4 years) |
| Reimbursement Boost for Single-Patient Cuffs | +0.6% | North America, selective EU markets | Short term (≤ 2 years) |
| Source: Mordor Intelligence | |||


Hypertension Prevalence & Screening Programmes
The rising global prevalence of hypertension has prompted large-scale screening initiatives, such as the WHO SEAHEARTS program, which aims to achieve 50% treatment coverage by 2025. U.S. quality measure #317 requires providers to document blood pressure for all adults and outline follow-up plans for elevated readings, incorporating blood pressure cuff checks into routine encounters.[1]Centers for Medicare & Medicaid Services. “Physician Fee Schedule 2025.” cms.govEuropean guidelines updated in 2024 now recommend out-of-office monitoring, expanding demand for clinically validated home devices. Uniform protocols are compressing diagnostic variability, making cuff accuracy pivotal for reimbursement claims. As regulators favor longitudinal data, health systems standardize equipment fleets to ensure comparable readings across care settings.
Ageing Population and Chronic-Care Burden
Older adults already comprise 20% of Hong Kong’s residents and will reach 32% by 2041, pushing health spending to HKD 284.1 billion (USD 36.4 billion) in 2025. Comparable demographic shifts in North America and Europe sustain home-based monitoring programs that cut 30-day readmissions by up to 76%, with blood pressure the most tracked parameter. User-friendly cuffs with large displays and guided inflation sequences reduce training needs for seniors managing multiple chronic conditions. Vendors able to certify devices for extended use cycles and seamless data transfer secure preferred-supplier status within remote-patient-monitoring contracts.
Shift Toward Disposable Cuffs to Curb HAIs
The CDC classifies cuffs as non-critical items, yet many U.S. hospitals now default to single-patient options to limit cross-contamination. GE Healthcare’s CRITIKON line exemplifies disposables optimized for ICU environments. Total cost-of-ownership models show that higher unit prices are offset by savings from reduced cleaning labor and lower infection rates. COVID-19 further entrenched the practice, and infection-control committees continue to champion latex-free, single-use designs that align with Joint Commission accreditation audits.
Expansion of Home-Health & Telemonitoring
UC Davis Health’s partnership with Best Buy Health allows cuff readings to flow directly into patient charts, illustrating how consumer-grade interfaces meet clinical standards. Adoption hinges on Bluetooth or Wi-Fi modules that auto-sync measurements, eliminating manual logging errors. The American Heart Association now endorses remote monitoring in hypertension guidelines, reinforcing procurement of connected cuffs.
Restraint Impact Analysis*
| Restraint | (~) % Impact on CAGR Forecast | Geographic Relevance | Impact Timeline |
|---|---|---|---|
| Latex-Free Material Supply Bottlenecks | -0.4% | Global, acute in specialty polymers | Short term (≤ 2 years) |
| Non-Uniform Cuff-Size Standards | -0.3% | Global, affects pediatric & bariatric care | Medium term (2-4 years) |
| Tightening PVC-Waste Rules | -0.2% | EU leads, other developed markets follow | Long term (≥ 4 years) |
| Rise of Cuff-Less Wearable BP Technologies | -0.5% | North America & EU early adopters | Medium term (2-4 years) |
| Source: Mordor Intelligence | |||
Non-Uniform Cuff-Size Standards Causing Mis-Readings
American Heart Association protocols require bladder width equal to 40% of arm circumference and length at 80%, yet manufacturer templates vary, producing errors above 10 mmHg when sizes are mismatched. Pediatric and bariatric populations face the greatest discrepancies, forcing providers to stock wide size inventories. Procurement complexity raises training burdens and can slow workflow if the correct cuff is not immediately available. Harmonized sizing matrices proposed by the International Organization for Standardization are still voluntary, so interoperability gaps persist across brands.
Rise of Cuff-Less Wearable BP Technologies
Aktiia's CE-marked optical sensor and Nanowear's FDA-cleared SimpleSense-BP offer continuous blood pressure insights without inflation bladders. Early validation shows mixed accuracy relative to oscillometric cuffs, but convenience is spurring trials in ambulatory populations. If clinical equivalence is proven, hospitals could redirect capital budgets toward multiparameter patches rather than traditional cuffs, creating competitive pressure on incumbent suppliers.
*Our forecasts treat driver/restraint impacts as directional, not additive. The impact forecasts reflect baseline growth, mix effects, and variable interactions.
Geography Analysis
Reusable devices held 50.23% market share in 2025 due to their durability and lower per-patient cost; however, disposable units are growing at a rate of 6.51% annually, which is double the overall blood pressure cuffs market pace. Hospitals that experienced COVID-19 outbreaks quickly adopted single-use cuffs to minimize surface contamination. The blood pressure cuffs market size for disposables is forecast to expand faster than any other product category, supported by Medicare quality metrics that financially reward infection prevention.
Implementation is strongest in critical-care wards, where cross-patient exposure risk is highest, and procurement teams are increasingly evaluating total cost-of-ownership models that factor in sterilization labor and cleaning chemicals. Suppliers now offer biodegradable polymers to address PVC disposal mandates, reducing environmental concerns while retaining soft-touch ergonomics important for patient comfort. Hybrid portfolios that combine bulk reusable lines with premium single-patient SKUs enable vendors to satisfy divergent budget and safety priorities across integrated delivery networks.
Adults dominate with 69.51% revenue, but pediatric demand is rising 7.01% per year as clinicians recognize childhood hypertension’s link to lifelong cardiovascular risk. Neonatal-specific projects, such as the NIH-funded “neoBP,” highlight unmet needs for micro-cuffs calibrated for preterm infants. In 2024, the American Heart Association highlighted the limited pediatric validation of commercially marketed devices, creating a competitive opportunity for manufacturers that conduct rigorous age-stratified trials.
The blood pressure cuffs market share attributable to children remains small in absolute terms; however, higher average selling prices for specialized cuffs disproportionately lift revenue. Telehealth programs now enable parents to transmit home readings that correlate well with clinic results, thereby bolstering demand for easy-to-use pediatric kits. Vendors that bundle gamified mobile apps with colorful cuff designs are differentiating on user engagement, an increasingly important purchasing criterion for pediatric hospitals.
The automated cuffs segment accounts for 58.22% of 2025 shipments, primarily due to their consistent inflation algorithms that minimize operator variability. Bluetooth-enabled models, however, are registering a 9.18% CAGR, mirroring the expansion of home monitoring contracts. Omron’s FDA-authorized AFib detection illustrates how AI features transform a commodity cuff into a clinical decision tool, justifying higher reimbursement tiers.
The blood pressure cuffs market size linked to smart devices is growing as providers invest in dashboards that aggregate data across various vital signs. Manual aneroid and mercury columns persist in niche settings, such as dialysis units, although environmental regulations are accelerating the retirement of mercury. Partnerships between hardware firms and digital-health software vendors are now central to competitive strategy as purchasers seek turnkey solutions that feed predictive analytics engines.
Hospitals still hold 36.17% of sales thanks to central purchasing agreements, but home-care settings exhibit the strongest 7.79% CAGR as RPM codes (CPT 99453/54/57) reimburse device provisioning and data review. Medicare’s policy clarity has prompted insurers to waive copays for qualified self-measured blood pressure devices, accelerating adoption among seniors managing comorbidities.
Connected cuffs integrated with voice prompts and automatic cloud uploads fit seamlessly into tele-nursing workflows. Manufacturers are investing in smartphone-agnostic companion apps to avoid platform lock-in, appealing to health systems that operate mixed device fleets. Clinics and ambulatory centers remain stable customers, prioritizing cost-efficient automated units that streamline high-volume screening days without compromising accuracy.

Geography Analysis
North America represented 35.27% of 2024 revenue, driven by Medicare codes G0537 and G0538, which reimburse ASCVD risk assessments, including blood pressure management. Widespread electronic medical record penetration simplifies device integration, while U.S. FDA guidance provides manufacturers with clear 510(k) pathways for approval. Canada’s harmonized regulations further reduce barriers, and Mexico’s expanding health coverage bolsters volume in lower-priced tiers.
The Asia-Pacific region is the fastest-growing, with a 7.89% CAGR, supported by India’s Production Linked Incentive scheme, which targets a USD 50 billion domestic med-tech sector by 2030.[2]Economic Times Health. “India’s MedTech Sector.” health.economictimes.indiatimes.com Chinese demand rises in tandem with its aging demographic, and regulatory convergence across ASEAN markets now allows multi-country product launches with limited redesign. Japan and South Korea’s advanced telehealth ecosystems create niches for premium Bluetooth cuffs, while Australia’s Medicare item numbers for remote vital signs monitoring fuel procurement of validated devices.
Europe posts steady gains as the Medical Device Regulation (MDR) deadline locks in higher safety standards, favoring suppliers with robust clinical evidence. Nordic countries’ PVC phase-out accelerates adoption of eco-friendly cuff materials, while the EU Green Deal positions reusable systems within circular-economy procurement frameworks. Eastern European hospitals prioritize cost-effective automated units under EU structural-fund financing, whereas Western Europe shifts toward connected cuffs tied to national e-health infrastructures. South America, the Middle East, and Africa continue to develop foundational blood-pressure screening programs, but price sensitivity channels demand toward durable, entry-level devices.
Competitive Landscape
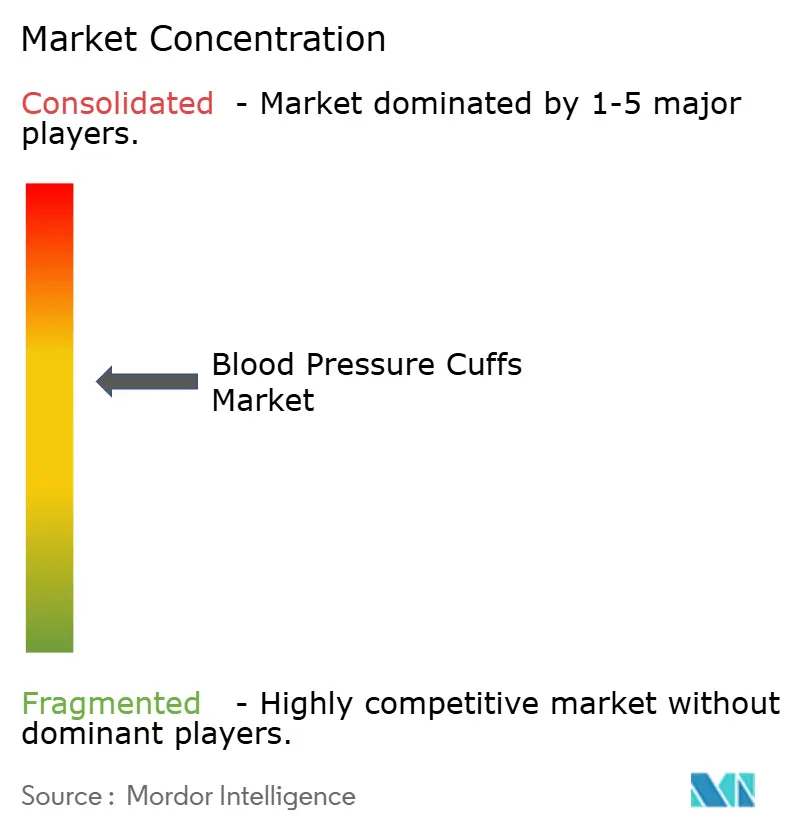
The blood pressure cuffs market features moderate fragmentation. Multinational device firms leverage scale manufacturing, broad regulatory clearances, and field service teams to secure hospital contracts. Emerging digital-health vendors focus on software-centric value propositions, such as AI-driven arrhythmia detection or cloud analytics dashboards, creating fertile ground for partnerships or acquisitions.
Strategic moves increasingly involve vertical integration. Omron embeds AFib algorithms into its cuffs, while BD’s HemoSphere Alta platform unites sensors and predictive software to optimize hemodynamic stability. Withings positions its BPM Vision at retail price points yet embeds clinical-grade measurement sequences that synchronize with telemedicine portals.
Convergence of hardware and software is prompting deal activity. Wipro GE’s USD 960 million Indian investment includes local R&D, aiming to shorten development cycles for region-specific cuff variants. Traditional suppliers also face disruption from cuff-less technologies; however, the clinical validation demands remain high, and early adopters are pursuing hybrid portfolios rather than full substitution.
Blood Pressure Cuffs Industry Leaders
Cardinal Health
Baxter (Hillrom)
GE Healthcare
Omron Healthcare
SunTech Medical (Halma)
- *Disclaimer: Major Players sorted in no particular order

Recent Industry Developments
- May 2025: Withings launched its BPM Vision blood pressure monitor in the US market at USD 149.95 following FDA clearance, featuring a 2.8-inch color screen and automatic three-reading protocols for accuracy.
- May 2024: Omron Healthcare donated 3,200 monitors to the World Hypertension Day campaign.


Research Methodology Framework and Report Scope
Market Definitions and Key Coverage
Our study defines the blood pressure cuffs market as all arm-oriented pneumatic cuffs, whether reusable cloth or single-use polymer, that inflate, occlude the brachial artery, and feed pressure signals to a manual gauge or an automated monitor. This value pool is tracked in USD at manufacturer selling price across seventeen major countries for 2021-2030.
Scope exclusion: Wearable cuff-less sensors and full blood-pressure monitor devices are outside the present sizing.
Segmentation Overview
- By Usage Type
- Reusable Cuffs
- Disposable Cuffs
- D-ring/Specialty Cuffs
- By Age Group
- Adult
- Pediatric
- Neonatal
- By Technology
- Manual Cuffs
- Automated Cuffs
- Bluetooth/Connected Cuffs
- By End User
- Hospitals
- Clinics
- Ambulatory Surgical Centers
- Home-care Settings
- Other End Users
- By Geography
- North America
- United States
- Canada
- Mexico
- Europe
- Germany
- United Kingdom
- France
- Italy
- Spain
- Rest of Europe
- Asia-Pacific
- China
- Japan
- India
- Australia
- South Korea
- Rest of Asia-Pacific
- Middle East & Africa
- GCC
- South Africa
- Rest of Middle East & Africa
- South America
- Brazil
- Argentina
- Rest of South America
- North America
Detailed Research Methodology and Data Validation
Primary Research
Mordor analysts interviewed procurement managers in hospitals, device distributors in Asia-Pacific, and clinicians running hypertension programs in North America. These conversations validated unit replacement cycles, average selling prices, and emerging preference for disposable cuffs in infection-control protocols, thereby filling data gaps left by public sources.
Desk Research
We mapped foundational demand and supply indicators from open sources such as the World Health Organization, the Centers for Disease Control and Prevention, the American Heart Association, U N Comtrade shipment files, and peer-reviewed journals on hypertension epidemiology. Trade association portals, hospital procurement dashboards, and company 10-K filings enriched usage mix and price bands. Paid intelligence from D&B Hoovers and Questel sharpened company financials and patent momentum, which are then linked to product pipeline assumptions. This list is illustrative; many other secondary repositories were tapped for corroboration.
Market-Sizing & Forecasting
A top-down cohort model builds the 2025 baseline by reconstructing country demand from treated hypertension prevalence, inpatient procedure volumes, and average cuff sets per bed. Selective bottom-up checks on leading suppliers' shipments adjust totals. Key variables include adult hypertension incidence, elective surgery rates, adoption of Bluetooth-enabled monitors, raw-material cost trends, and reimbursement codes that support home monitoring. A multivariate regression with lagged incidence and GDP-per-capita predictors drives the 2026-2030 forecast, while scenario analysis stress-tests shifts toward cuff-less technology. Where distributor data were thin, gap fillers relied on import logs and regional average price curves before analyst sign-off.
Data Validation & Update Cycle
Outputs run through variance checks against historical trade flows and independent hospital census data, followed by a two-level analyst review. Our tables refresh annually, with interim updates triggered by regulatory or technology inflection points, ensuring clients always receive the latest calibrated view.
Why Mordor's Blood Pressure Cuffs Baseline Commands Reliability
Published figures often differ because firms choose unique product mixes, price assumptions, and refresh cadences.
Key gap drivers include divergent scope choices, the use of aggressive uptake curves for connected monitors, or omission of reusable cuffs in infection-control sensitive regions.
Benchmark comparison
| Market Size | Anonymized source | Primary gap driver |
|---|---|---|
| USD 586.74 M (2025) | Mordor Intelligence | - |
| USD 700 M (2025) | Global Consultancy A | Includes monitor kits and Bluetooth accessories that inflate totals |
| USD 340.34 M (2024) | Trade Journal B | Tracks disposable cuffs only, thereby excluding half the installed base |
The comparison shows that once scope misalignments are removed, our mid-range estimate offers a balanced, transparent baseline backed by traceable variables and repeatable steps. Clients can rely on Mordor Intelligence to anchor strategic decisions with confidence.


Key Questions Answered in the Report
What is the current size of the blood pressure cuff market?
The blood pressure cuff market stands at USD 620.88 million in 2026 and is projected to reach USD 823.71 million by 2031.
Which segment is growing fastest within the blood pressure cuff market?
Disposable single-patient cuffs are expanding at a 6.51% CAGR as hospitals prioritize infection control.
How are reimbursement policies influencing adoption of connected cuffs?
New Medicare RPM and ASCVD codes compensate providers for remote blood pressure monitoring, driving demand for Bluetooth-enabled devices that upload data automatically.
Which region shows the highest growth potential?
Asia-Pacific is forecast to register a 7.66% CAGR, supported by India’s med-tech manufacturing incentives and rising chronic disease prevalence.
Page last updated on:


