Market Overview
| Study Period | 2019 - 2031 |
|---|---|
| Forecast Data Period | 2026 - 2031 |
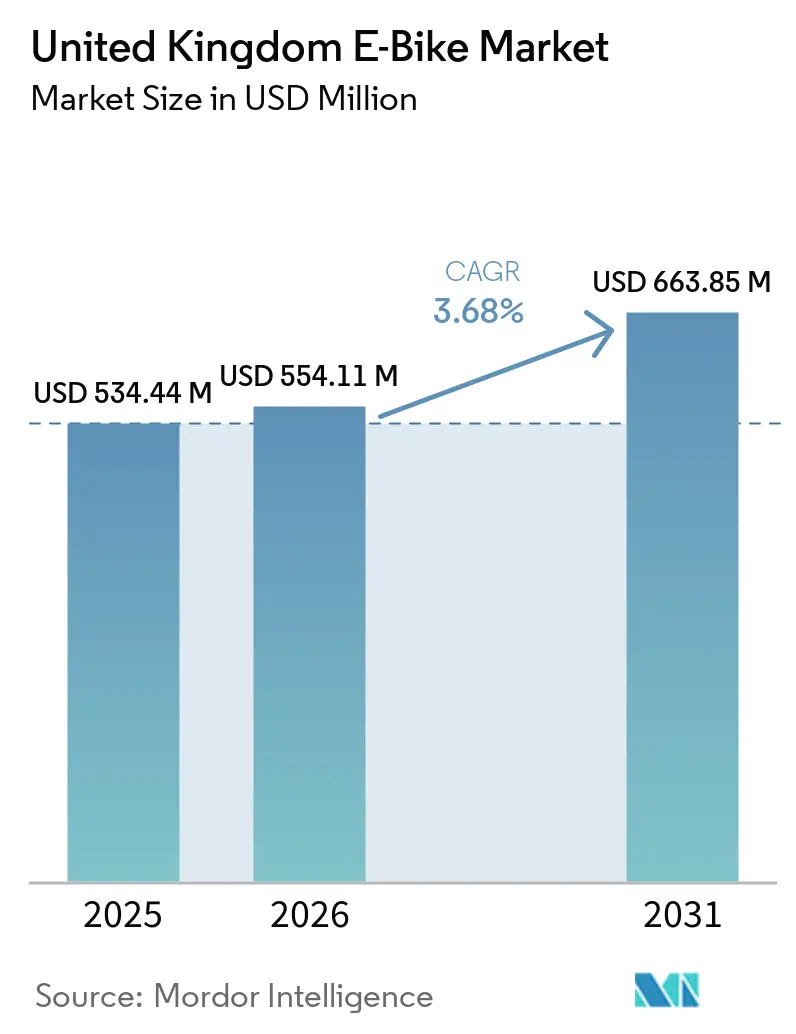
| Base Year Market Size (2025) | USD 534.44 Million |
| Market Size (2026) | USD 554.11 Million |
| Market Size (2031) | USD 663.85 Million |
| Growth Rate (2026 - 2031) | 3.68% CAGR |
| Market Concentration | Medium |
Major Players *Disclaimer: Major Players sorted in no particular order Image © Mordor Intelligence. Reuse requires attribution under CC BY 4.0. | |
United Kingdom E-Bike Market Analysis by Mordor Intelligence
The United Kingdom e-bike market size is expected to grow from USD 534.44 million in 2025 to USD 554.11 million in 2026 and is forecast to reach USD 663.85 million by 2031 at a 3.68% CAGR over 2026–2031. Demand rises as protected cycling lanes, employer tax incentives, and falling lithium-ion battery costs converge with commercial fleet requirements. Cargo delivery operators are scaling electric cargo bikes to cut congestion-charge fees, while premium commuter models gain share as urban professionals seek low-emission travel. Infrastructure investments for 2024-2026 guarantee a pipeline of new lanes that reduce safety concerns and broaden the addressable customer base[1]Department for Transport, “Consolidated Active Travel Fund: local transport authority allocations,” GOV.UK, gov.uk. Safety regulations tighten after a spike in battery fire incidents, giving brands with certified packs an advantage.
Key Report Takeaways
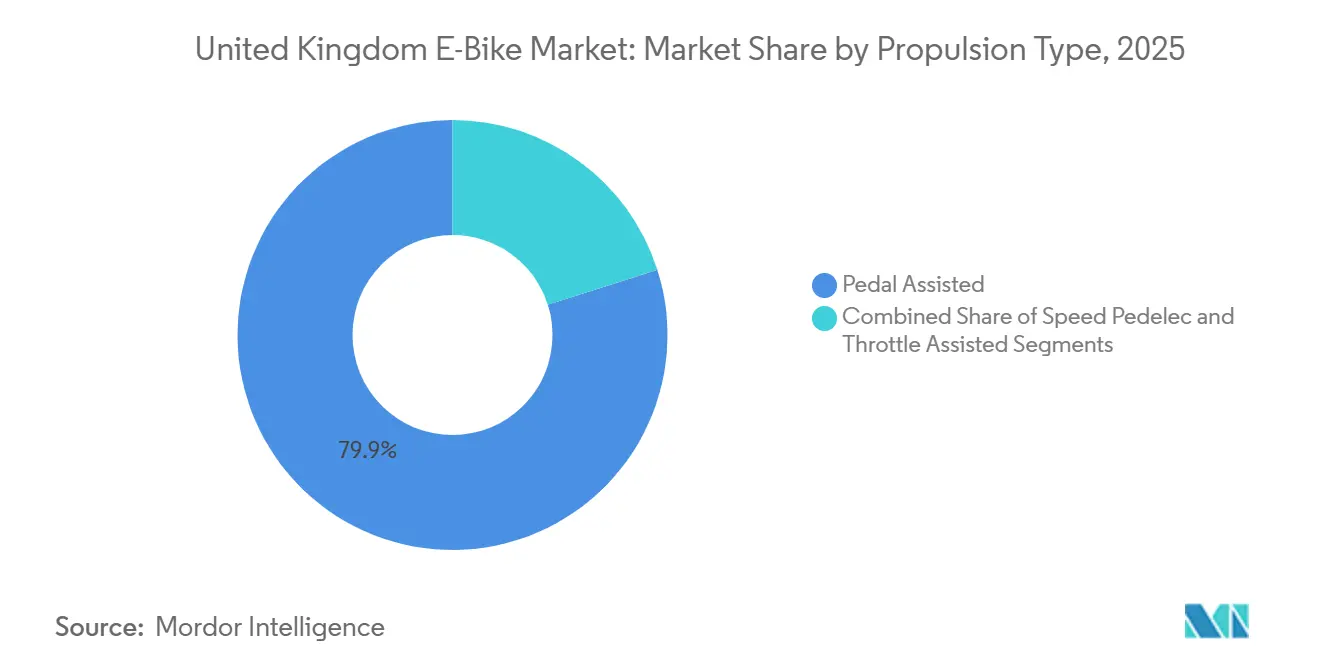
- By propulsion type, pedal-assisted models led with 79.91% of the United Kingdom e-bike market share in 2025, while throttle-assisted variants are advancing at a 3.67% CAGR through 2031.
- By application type, city and urban bikes accounted for 71.34% of the United Kingdom e-bike market size in 2025; cargo and utility bikes are forecasted to grow at a 3.67% CAGR.
- By battery type, lithium-ion units captured a 99.37% share of the United Kingdom e-bike market in 2025 and are expected to expand at a 3.68% CAGR.
- By motor placement, hub motors held 72.52% share of the United Kingdom e-bike market in 2025, whereas mid-drive systems are projected to post a 4.72% CAGR to 2031.
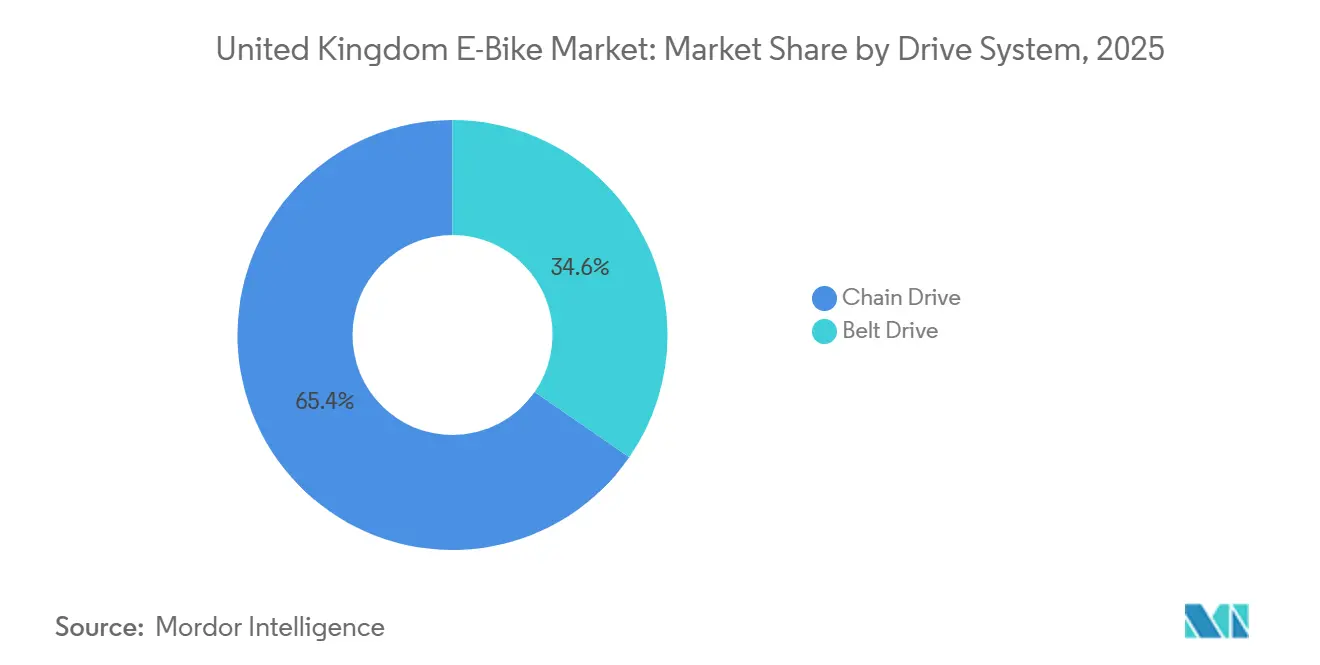
- By drive system, chain drives commanded a 65.37% share of the United Kingdom e-bike market in 2025; belt drives are expected to grow at a 5.42% CAGR through 2031.
- By motor power, sub-250 W models led with 56.17% share of the United Kingdom e-bike market in 2025, while the 501-600 W segment is projected to register a 6.32% CAGR to 2031.
- By price band, the EUR 1,500-2,499 tier captured 32.68% share of the United Kingdom e-bike market in 2025; the EUR 2,500-3,499 bracket is forecasted to rise at a 4.43% CAGR by 2031.
- By sales channel, offline retail generated 63.32% revenue of the United Kingdom e-bike market in 2025, whereas online sales are expected to climb at a 3.78% CAGR.
- By end-use, personal and family purchases represented 49.02% share of the United Kingdom e-bike market in 2025, but commercial delivery fleets are projected to surge at a 6.57% CAGR.
- By region, England captured 83.64% share of the United Kingdom e-bike market in 2025, while Scotland is expected to register a 5.36% CAGR through 2031.
Note: Market size and forecast figures in this report are generated using Mordor Intelligence’s proprietary estimation framework, updated with the latest available data and insights as of January 2026.
United Kingdom E-Bike Market Trends and Insights
Drivers Impact Analysis*
| Driver | (~)% Impact on CAGR Forecast | Geographic Relevance | Impact Timeline |
|---|---|---|---|
| E-Cargo Growth | +0.9% | England (London-centric), Scotland (urban centers) | Medium term (2-4 years) |
| Cycling Infrastructure Expansion | +0.7% | England, Scotland, Wales (major cities) | Long term (≥ 4 years) |
| Cycle to Work Tax Incentives | +0.7% | England, Scotland, Wales, Northern Ireland | Short term (≤ 2 years) |
| Falling Lithium-Ion Battery Costs | +0.6% | England (manufacturing hubs), Scotland | Medium term (2-4 years) |
| U.K. Gigafactory Plans | +0.4% | England (West Midlands, Coventry) | Long term (≥ 4 years) |
| 500W Power-Limit Proposal | +0.4% | England, Scotland, Wales, Northern Ireland | Short term (≤ 2 years) |
| Source: Mordor Intelligence | |||


Growth of E-Cargo in Last-Mile Delivery
Cargo bike deployments jumped 63% year-on-year in London, and Transport for London forecasts that approximately 17% of van deliveries in central London could be replaced by cargo bikes by 2030. Operators like Evri are committed to tripling their e-cargo bike fleets between 2024 and 2025, validating the operational cost savings and congestion benefits. Food-delivery couriers represent a ready demand pool, accounting for around 10% of London cycle trips. Freight-innovation grants and city access rules strengthen the commercial case, making cargo the fastest-growing professional use case.[2]“Active Travel: Trends, Policy and Funding,” UK House of Commons Library, commonslibrary.parliament.uk
Expansion of Protected Cycling Infrastructure
The Consolidated Active Travel Fund has awarded GBP 168.5 million (USD 211 million) for 2025-26, 76% of which is earmarked for hard infrastructure. New protected lanes reduce perceived risk, a chief deterrent among older riders and families, and spur network effects as routes become contiguous. Greater Manchester, West Midlands, and West Yorkshire secure the largest grants, ensuring dense urban corridors that maximize usage. As safety improves, latent commuter demand converts into sales, supporting sustained growth beyond initial policy cycles.
Cycle-to-Work Tax Incentives and Employer Uptake
Employer-sponsored schemes demonstrate a measurable impact on market penetration, with an HMRC evaluation revealing sustained engagement levels, with over 70% continuing to cycle for commuting purposes post-participation. The majority of large employers offer the program, and the median financed bike cost aligns with entry-level e-bike pricing, shifting acquisition barriers from upfront capital to monthly deductions. The incentive generates genuine modal change, expanding the consumer base beyond recreational cyclists and supporting repeat purchases as early adopters upgrade.
Falling Lithium-Ion Battery Costs
The UK currently imports 100% of its lithium requirements, creating vulnerability to global price volatility and supply disruption, which can squeeze margins on entry-level models. However, domestic gigafactory development promises supply chain localization, with EVE Energy's planned Coventry facility targeting 20-60 GWh annual capacity and explicit focus on two-wheeler applications, including e-bikes. Cost savings are most visible in mid-market offerings where price sensitivity is acute. Performance models instead channel savings into higher-density cells that extend range, reinforcing premium positioning while keeping battery safety compliance front and center.
Restraints Impact Analysis*
| Restraint | (~)% Impact on CAGR Forecast | Geographic Relevance | Impact Timeline |
|---|---|---|---|
| Battery-Fire Incidents | -0.6% | England (London-focused), Scotland, Wales | Short term (≤ 2 years) |
| Inventory Overhang | -0.4% | England, Scotland, Wales, Northern Ireland | Short term (≤ 2 years) |
| Non-Folding E-Bike Ban | -0.3% | England (London transport network) | Short term (≤ 2 years) |
| Rental-Housing Storage Bans | -0.2% | England (urban centers), Scotland (cities) | Medium term (2-4 years) |
| Source: Mordor Intelligence | |||
Rising Battery-Fire Incidents and Safety Regulation
Safety incidents pose the most significant regulatory headwind, with 211 e-bike and e-scooter fires recorded in 2024, resulting in several fatalities and leading to tighter product-safety rules. Transport for London introduced a ban on folding e-bikes on rail in March 2025, hampering multimodal commutes. The United Kingdom's forces seized 937 illegally modified bikes, up 83%, signaling stricter enforcement. Compliance costs increase for new entrants, but certified brands can turn safety credentials into a selling point.
Inventory Overhang and Weak Bicycle Retail Sales
Market oversupply constrains pricing power and profitability across the distribution chain, with UK bicycle sales hitting a 25-year low in 2024, and e-bike volume fell, despite heavy discounting. Excess stock forces independent retailers into cash-flow stress, consolidating channel power toward larger chains and online pure-plays. Price erosion affects entry-level models, yet premium and commercial buyers prove more resilient, cushioning overall market revenue.
*Our forecasts treat driver/restraint impacts as directional, not additive. The impact forecasts reflect baseline growth, mix effects, and variable interactions.
Segment Analysis
By Propulsion Type: Pedal-Assisted Models Dominate Commercial Adoption
Pedal-assisted e-bikes led the United Kingdom's market, accounting for a significant 79.91% share in 2025. This dominance is largely due to the legal 250 W power limit, which classifies them as bicycles instead of mopeds. This classification provides key benefits like access to bike lanes, no need for vehicle registration, and lower insurance costs, making it popular among commuters and leisure riders. Manufacturers are improving torque-sensor algorithms to make the assistance feel more natural, which has led to positive reviews and repeat purchases, further strengthening the segment's position. As a result, the market for pedal-assist models in the UK is expected to grow steadily, aligning with the overall market's 3.68% CAGR through 2031.
Throttle-assisted e-bikes, while a smaller segment, are projected to grow at a 3.67% CAGR. These bikes are particularly favored by delivery couriers who need quick power in stop-and-go traffic. Regulatory actions, such as the seizure of 937 illegal high-power bikes by August 2024, show that authorities are enforcing compliance. However, certified throttle models still attract buyers where the productivity benefits outweigh the challenges of meeting regulations. To address this, component suppliers are offering firmware-locked throttles that can be adjusted to the legal 250 W limit, giving fleets a way to comply without losing functionality. While pedal-assist bikes maintain their lead, this approach allows throttle-assist models to thrive in specific commercial niches. Additionally, increasing urban congestion charges and restricted van access are pushing operators to adopt any legal option that ensures fast and efficient parcel delivery.


By Application Type: Urban Mobility Drives Volume While Cargo Accelerates
Urban trips accounted for 71.34% of total revenue in 2025, driven by factors such as dense populations, dedicated bike lanes, and high parking costs, which made e-bikes a convenient option for door-to-door travel. During 2025-26, Greater Manchester, West Midlands, and West Yorkshire received significant investments to develop new cycle corridors, boosting commuter confidence with improved infrastructure. Employers are also supporting this shift through Cycle-to-Work schemes that reduce purchase costs, making battery assistance indispensable for daily riders. As a result, the e-bike market in the United Kingdom is expected to grow steadily in urban commuting while maintaining its leadership in volume throughout the forecast period.
Although cargo and utility bikes currently represent a smaller segment, they are expected to grow faster than any other use case, with a 3.67% CAGR through 2031. Studies on cost-per-parcel show savings of over 20% compared to diesel vans, especially when factoring in traffic fines and congestion fees — a finding that appeals to logistics CFOs. Transport for London estimates that cargo bikes could handle around 17% of inner-city van deliveries by 2030, creating demand for thousands of additional units. Fleet operators are increasingly requesting factory-installed telematics for better logistics oversight, which raises entry barriers for low-cost brands. These trends place cargo bikes at the center of commercial electrification efforts, even though commuter volumes remain higher.
By Battery Type: Lithium-Ion Remains Unrivaled
Lithium-ion technology accounted for 99.37% of the United Kingdom e-bike market in 2025. It is expected to grow steadily at a 3.68% CAGR through 2031. This growth is driven by lithium-ion's high energy density, which provides a good range without adding too much weight—an essential feature for folding e-bikes popular among rail commuters. As cell prices continue to decline, brands have two key options: keep their Manufacturer's Suggested Retail Prices (MSRPs) unchanged or offer higher-capacity battery packs at the same price. Both approaches help expand the total addressable market. While safety regulations are becoming stricter, established manufacturers already use certified battery management systems, thereby strengthening their competitive position. As a result, lithium-ion technology is expected to grow in line with the United Kingdom's overall 3.68% CAGR in the e-bike market, with no significant competition from alternative chemistries during the forecast period.
Local sourcing remains a challenge. The planned gigafactory in Coventry aims to produce up to 60 GWh of small-format batteries. However, data from the Faraday Institution show a 47% gap between projected demand and announced production capacity. This reliance on imports leaves OEMs vulnerable to currency fluctuations and shipping delays, forcing them to manage risks across both pricing and logistics. To address potential supply disruptions, some brands are designing modular battery bays that can work with cells from multiple suppliers. If domestic production ramps up as planned, manufacturers could benefit from shorter lead times and the ability to market "British-made" battery packs as an additional safety feature.
By Motor Placement: Cost-Effective Hubs vs. Performance-Driven Mid-Drives
Hub motors accounted for 72.52% of the United Kingdom e-bike market in 2025 because they integrate the controller and drive unit into the wheel, slashing labor time and simplifying aftermarket service. Budget-conscious commuters appreciate the lower sticker price, while retailers like the sealed design that reduces warranty claims. The configuration’s drawback is underwhelming hill-climb torque, yet in flat urban corridors and hubs, it remains perfectly adequate. Consequently, the hub slice of the United Kingdom E-bike market share is poised to maintain a majority share, even as growth moderates.
Mid-drives are climbing at a 4.72% CAGR because cargo fleets and performance enthusiasts value frame-centered weight distribution and the ability to leverage bicycle gearing. Brose, Bosch, and Mahle have all launched compact units that fit within traditional frame lines, removing the aesthetic penalty that once deterred buyers. OEMs co-develop frames around specific mid-drive housings, yielding stiffness gains that translate into smoother acceleration. These engineering synergies ensure the mid-drive share will keep inching upward even as hubs remain dominant.
By Drive System: Chains Stay Mainstream, Belts Gain Ground
Chain drives accounted for 65.37% of the United Kingdom e-bike market in 2025. Their low cost, widespread familiarity, and compatibility with derailleur gearing make them a practical choice for most commuters. Replacement chains are easy to find in cities across the country, and riders can handle basic maintenance themselves, keeping ownership costs low. Mechanics report that modern hardened links effectively manage chain stretch caused by e-torque, addressing reliability concerns for regular use. As a result, chains will continue to dominate the e-bike market in the United Kingdom, though they are expected to gradually lose some share to higher-end alternatives.
Belt systems are gaining traction, with a 5.42% CAGR, driven by commuters seeking to avoid grease and by fleets that prioritize minimizing downtime. Carbon belts, combined with internally geared hubs, reduce wear points and significantly extend service intervals compared to traditional chains. Vendors have also lowered the cost of belt kits, making them an appealing upgrade for mid-tier buyers who value cleanliness and quiet operation. Fleet managers also find it easier to perform predictive maintenance since belts don’t rely on external lubrication. As a result, belts are steadily gaining ground in premium commuter and delivery segments, although chains will likely remain the preferred choice for the more cost-conscious market.
By Motor Power: Regulation Keeps Sub-250 W on Top
Motors with ratings below 250 W accounted for 56.17% of the United Kingdom e-bike market in 2025. This dominance is due to legal regulations that classify e-bikes with higher ratings as light mopeds, requiring licensing and insurance. To avoid registration fees and maintain access to bike lanes, riders prefer these sub-250 W models. Manufacturers are improving efficiency by using software limitations and advanced cooling systems. These enhancements provide slight performance improvements while keeping the bikes within legal limits, ensuring this segment continues to lead throughout the forecast period.
At the same time, the 501-600 W segment is growing the fastest, with a 6.32% CAGR. This growth is fueled by cargo riders who need more torque to handle heavier loads. Although policymakers upheld the 250 W legal limit in January 2025, fleets can still use higher-wattage models if they obtain type approval or operate on private property. To address this, component manufacturers are developing modular systems that can be adjusted to 250 W for public road use and switched to full power on private campuses. This dual-mode approach helps operators manage regulatory challenges while meeting different operational needs. As a result, growth is expected to focus on cargo and rural leisure markets, where the benefits outweigh the additional administrative requirements.
By Price Band: Mid-Market Sweet Spot, Premium Upgrades
The EUR 1,500-2,499 tier captured 32.68% of the United Kingdom e-bike market in 2025, as it balances branded components with accessible payments within Cycle-to-Work salary-sacrifice caps. Consumers in this bracket expect hydraulic brakes and integrated lighting, now standard thanks to scale production. Dealer promotions aimed at clearing pandemic overstock further reduced effective prices, pulling fence-sitters into the purchase funnel. Accordingly, this tier will continue to anchor unit volumes within the United Kingdom e-bike market size.
The EUR 2,500-3,499 tier is expanding at 4.43% CAGR as second-time buyers and tech enthusiasts seek longer range, connectivity, and sleek frame integration. Brands differentiate with carbon forks, stealth batteries, and smartphone diagnostics, features that underpin a premium identity. Financing partners now bundle maintenance plans into monthly fees, softening the higher outlay. Fleet buyers likewise migrate to mid-premium models because durability and residual value offset upfront expense. Collectively, these factors push the tier’s share higher without cannibalizing entry-level demand.
By Sales Channel: Offline Holds Majority, Online Scales Faster
Offline dealers accounted for 63.32% of the United Kingdom e-bike market in 2025 because customers want test rides, professional fitting, and a clear route to warranty service. Battery safety headlines drive shoppers toward trusted storefronts where staff can certify compliance and offer disposal options for end-of-life packs. Dealers also score with employer scheme paperwork, a value-add that many online stores struggle to match. Consequently, offline will remain the dominant slice of the United Kingdom e-bike market, though growth rates will slow as the network matures.
Online channels are advancing at a 3.78% CAGR, driven by direct-to-consumer brands that leverage lower overhead to offer higher-spec parts at similar price points. Video consultations, mobile service vans, and flexible return policies mitigate concerns over complex assembly. Marketplaces now require battery-compliance certificates before listing, raising consumer trust and reducing counterfeit risk. Rural buyers benefit from doorstep delivery of models unavailable locally, widening geographic reach. These strengths ensure e-commerce will keep nibbling at offline share even as physical stores protect their core base.

By End-Use: Consumer Base Leads, Fleets Accelerate
Personal and family riders accounted for 49.02% of the United Kingdom e-bike market in 2025, as leisure, school-run, and health-motivated trips converted to electric-assisted trips. Expanding protected lanes and rising fuel prices make e-bikes a rational alternative to short car journeys, reinforcing mainstream acceptance. Word-of-mouth from early adopters and visible use by neighbors further normalize ownership. This broad demographic appeal secures the segment’s revenue leadership within the United Kingdom e-bike market through 2031.
Commercial delivery fleets, however, post the highest 6.57% CAGR because parcel logistics is under immense cost-and carbon-pressure. Service-level agreements now include emission stipulations, pushing subcontractors toward electric cargo bikes that dodge congestion charges. Operators equip bikes with telematics for real-time drop optimization, demonstrating that the platform meets professional reliability standards. Municipal trials grant cargo bikes privileged loading zones, amplifying their operational edge over vans. These tailwinds make commercial delivery the sector to watch for disruptive volume spikes.
Geography Analysis
England dominated the United Kingdom e-bike market in 2025, capturing 83.64% share on the back of dense urban populations, lane networks, and active-travel funding that allocated millions to Greater Manchester and comparable sums to other city-regions. London alone anticipates replacing one in six inner-city vans with cargo bikes by 2030, while an early 2025 folding-bike exemption aids multimodal commuters. Enforcement teams seized 937 illegal high-power bikes in the year 2024, signaling strict compliance checks that favor certified brands.
Scotland records the fastest growth at 5.36% to 2031 as participation rose significantly in 2025, boosted by permissive outdoor-access codes that encourage leisure riding. Government programs couple urban cycleway expansion with tourism-trail investments, broadening use cases beyond commuting. The UK Trails Project, steered by Developing Mountain Biking in Scotland, positions the region to capture recreational sales with upgraded trailheads and e-bike hire hubs.
Wales and Northern Ireland remain emerging areas, shaped by distinct planning frameworks and land access rights. Wales’ Active Travel Act mandates integrated cycling routes, while consultation feedback emphasizes continuous networks over isolated segments. Northern Ireland’s Outscape partnership explores trail development to unlock rural tourism, but restricted access outside forests tempers immediate volumes. Both regions leverage national tax incentives and safety regulation, setting foundations for gradual adoption.
Competitive Landscape
The United Kingdom e-bike market is moderately consolidated. Brompton Bicycle leads the market share by combining premium folding expertise with a dense dealer network that eases post-sale service. The brand benefits disproportionately from the March 2025 rail policy that bans non-folding e-bikes in London, as commuters pivot to compliant designs. Its vertically integrated London factory also allows Brompton to iterate quickly on safety enhancements demanded after battery fire headlines. These factors cement leadership even as overall market room remains for challengers.
Second-tier players pursue direct-to-consumer strategies to bypass retail margins and scale nationally without investing in brick-and-mortar. Lightweight carbon commuters and long-tail cargo frames are popular entry points because they sidestep Brompton’s folding stronghold. Component collaborations with Mahle and Bosch give smaller OEMs access to proven drive trains that meet safety regulations and insurer requirements. Marketing budgets focus on social-media testimonials and employer-scheme partnerships, channels that resonate with digitally native buyers. Financially, these firms aim for asset-light models that outsource frame production to contract factories while retaining design and customer support in-house.
Incumbents like Pashley and Raleigh counter with diversification into bike-share fleets, subscription services and IoT-enabled maintenance packages. Established brands also exploit scale to lock in battery supply at better terms, buffering them from potential import tariffs or shipping disruptions. The resulting ecosystem is dynamic: dominant enough to ensure product standards yet open enough for innovation from newcomers.
United Kingdom E-Bike Industry Leaders
CUBE Bikes
Giant Manufacturing Co. Ltd.
Trek Bicycle Corporation
Brompton Bicycle Ltd
Raleigh UK Ltd
- *Disclaimer: Major Players sorted in no particular order

Recent Industry Developments
- October 2025: Brompton unveiled the 11.2 kg Electric T Line folding model, extending range to 90 km per charge.
- September 2025: Belfast Bikes added 100 Beryl e-bikes and plans 300 more pedal models by year-end.
- June 2025: Mahle launched the 2.5 kg M40 motor delivering 850 W peak power and 105 Nm torque.
- June 2025: Spain’s MMR Bikes entered the U.K. with road, gravel, MTB and e-bike lines across varied price points.


United Kingdom E-Bike Market Report Scope
The United Kingdom E-bike Market is analyzed across multiple segmentation dimensions to provide comprehensive market intelligence. By Propulsion Type, the market is segmented into Pedal Assisted, Speed Pedelec, and Throttle Assisted variants. Application Type segmentation covers Cargo/Utility, City/Urban, and Trekking/Mountain use cases. Battery Type analysis includes Lead-Acid Battery, Lithium-ion Battery, and Others. Motor Placement segmentation distinguishes between Hub (Front/Rear) and Mid-Drive configurations. Drive Systems are categorized as Chain Drive and Belt Drive. Motor Power segmentation spans five ranges: less than 250W, 251-350W, 351-500W, 501-600W, and greater than 600W. Price Band analysis covers six tiers from Up to USD 1,000 through Above USD 6,000. Sales Channel segmentation differentiates Online and Offline distribution. End-Use categories include Commercial Delivery (further divided into Retail and Goods Delivery, and Food and Beverage Delivery), Service Providers, Personal and Family Use, Institutional, and Others. Geographic segmentation provides regional analysis across England, Scotland, Wales, and Northern Ireland. Market forecasts are provided in terms of both Value (USD) and Volume (Units) where data availability permits.
By Propulsion Type
| Pedal Assisted |
| Speed Pedelec |
| Throttle Assisted |
By Application Type
| Cargo / Utility |
| City / Urban |
| Trekking / Mountain |
By Battery Type
| Lead-Acid Battery |
| Lithium-ion Battery |
| Others |
By Motor Placement
| Hub (Front / Rear) |
| Mid-Drive |
By Drive Systems
| Chain Drive |
| Belt Drive |
By Motor Power
| Below 250 W |
| 251 to 350 W |
| 351 to 500 W |
| 501 to 600 W |
| Above 600 W |
By Price Band
| Up to EUR 1,000 |
| EUR 1,000 to 1,499 |
| EUR 1,500 to 2,499 |
| EUR 2,500 to 3,499 |
| EUR 3,500 to 5,999 |
| Above EUR 6,000 |
By Sales Channel
| Online |
| Offline |
By End to Use
| Commercial Delivery | Retail and Goods Delivery |
| Food and Beverage Delivery | |
| Service Providers | |
| Personal and Family Use | |
| Institutional | |
| Others |
By Region
| England |
| Scotland |
| Wales |
| Northern Ireland |
| By Propulsion Type | Pedal Assisted | |
| Speed Pedelec | ||
| Throttle Assisted | ||
| By Application Type | Cargo / Utility | |
| City / Urban | ||
| Trekking / Mountain | ||
| By Battery Type | Lead-Acid Battery | |
| Lithium-ion Battery | ||
| Others | ||
| By Motor Placement | Hub (Front / Rear) | |
| Mid-Drive | ||
| By Drive Systems | Chain Drive | |
| Belt Drive | ||
| By Motor Power | Below 250 W | |
| 251 to 350 W | ||
| 351 to 500 W | ||
| 501 to 600 W | ||
| Above 600 W | ||
| By Price Band | Up to EUR 1,000 | |
| EUR 1,000 to 1,499 | ||
| EUR 1,500 to 2,499 | ||
| EUR 2,500 to 3,499 | ||
| EUR 3,500 to 5,999 | ||
| Above EUR 6,000 | ||
| By Sales Channel | Online | |
| Offline | ||
| By End to Use | Commercial Delivery | Retail and Goods Delivery |
| Food and Beverage Delivery | ||
| Service Providers | ||
| Personal and Family Use | ||
| Institutional | ||
| Others | ||
| By Region | England | |
| Scotland | ||
| Wales | ||
| Northern Ireland | ||


Market Definition
- By Application Type - E-bikes considered under this segment include city/urban, trekking, and cargo/utility e-bikes. The common types of e-bikes under these three categories include off-road/hybrid, kids, ladies/gents, cross, MTB, folding, fat tire, and sports e-bike.
- By Battery Type - This segment includes lithium-ion batteries, lead-acid batteries, and other battery types. The other battery type category includes nickel-metal hydroxide (NiMH), silicon, and lithium-polymer batteries.
- By Propulsion Type - E-bikes considered under this segment include pedal-assisted e-bikes, throttle-assisted e-bikes, and speed pedelec. While the speed limit of pedal and throttle-assisted e-bikes is usually 25 km/h, the speed limit of speed pedelec is generally 45 km/h (28 mph).
| Keyword | Definition |
|---|---|
| Pedal Assisted | Pedal-assist or pedelec category refers to the electric bikes that provide limited power assistance through torque-assist system and do not have throttle for varying the speed. The power from the motor gets activated upon pedaling in these bikes and reduces human efforts. |
| Throttle Assisted | Throttle-based e-bikes are equipped with the throttle assistance grip, installed on the handlebar, similarly to motorbikes. The speed can be controlled by twisting the throttle directly without the need to pedal. The throttle response directly provides power to the motor installed in the bicycles and speeds up the vehicle without paddling. |
| Speed Pedelec | Speed pedelec is e-bikes similar to pedal-assist e-bikes as they do not have throttle functionality. However, these e-bikes are integrated with an electric motor which delivers power of approximately 500 W and more. The speed limit of such e-bikes is generally 45 km/h (28 mph) in most of the countries. |
| City/Urban | The city or urban e-bikes are designed with daily commuting standards and functions to be operated within the city and urban areas. The bicycles include various features and specifications such as comfortable seats, sit upright riding posture, tires for easy grip and comfortable ride, etc. |
| Trekking | Trekking and mountain bikes are special types of e-bikes that are designed for special purposes considering the robust and rough usage of the vehicles. These bicycles include a strong frame, and wide tires for better and advanced grip and are also equipped with various gear mechanisms which can be used while riding in different terrains, rough grounded, and tough mountainous roads. |
| Cargo/Utility | The e-cargo or utility e-bikes are designed to carry various types of cargo and packages for shorter distances such as within urban areas. These bikes are usually owned by local businesses and delivery partners to deliver packages and parcels at very low operational costs. |
| Lithium-ion Battery | A Li-ion battery is a rechargeable battery, which uses lithium and carbon as its constituent materials. The Li-Ion batteries have a higher density and lesser weight than sealed lead acid batteries and provide the rider with more range per charge than other types of batteries. |
| Lead Acid Battery | A lead acid battery refers to sealed lead acid battery having a very low energy-to-weight and energy-to-volume ratio. The battery can produce high surge currents, owing to its relatively high power-to-weight ratio as compared to other rechargeable batteries. |
| Other Batteries | This includes electric bikes using nickel–metal hydroxide (NiMH), silicon, and lithium-polymer batteries. |
| Business-to-Business (B2B) | The sales of e-bikes to business customers such as urban fleet and logistics company, rental/sharing operators, last-mile fleet operators, and corporate fleet operators are considered under this category. |
| Business-to-Customers (B2C) | The sales of electric scooters and motorcycles to direct consumers is considered under this category. The consumers acquire these vehicles either directly from manufacturers or from other distributers and dealers through online and offline channel. |
| Unorganized Local OEMs | These players are small local manufacturers and assemblers of e-bikes. Most of these manufacturers import the components from China and Taiwan and assemble them locally. They offer the product at low cost in this price sensitive market which give them advantage over organized manufacturers. |
| Battery-as-a-Service | A business model in which the battery of an EV can be rented from a service provider or swapped with another battery when it runs out of charge |
| Dockless e-Bikes | Electric bikes that have self-locking mechanisms and a GPS tracking facility with an average top speed of around 15mph. These are mainly used by bike-sharing companies such as Bird, Lime, and Spin. |
| Electric Vehicle | A vehicle which uses one or more electric motors for propulsion. Includes cars, scooters, buses, trucks, motorcycles, and boats. This term includes all-electric vehicles and hybrid electric vehicles |
| Plug-in EV | An electric vehicle that can be externally charged and generally includes all-electric vehicles as well as plug-in hybrids. In this report we use the term for all-electric vehicles to differentiate them from plug-in hybrid electric vehicles. |
| Lithium-Sulphur Battery | A rechargeable battery that replaces the liquid or polymer electrolyte found in current lithium-ion batteries with sulfur. They have more capacity than Li-ion batteries. |
| Micromobility | Micromobility is one of the many modes of transport involving very-light-duty vehicles to travel short distances. These means of transportation include bikes, e-scooters, e-bikes, mopeds, and scooters. Such vehicles are used on a sharing basis for covering short distances, usually five miles or less. |
| Low Speed Electric Vehicls (LSEVs) | They are low speed (usually less than 25 kmph) light vehicles that do not have an internal combustion engine, and solely use electric energy for propulsion. |


Research Methodology
Mordor Intelligence follows a four-step methodology in all its reports.
- Step-1: Identify Key Variables: To build a robust forecasting methodology, the variables and factors identified in Step-1 are tested against available historical market numbers. Through an iterative process, the variables required for market forecast are set and the model is built based on these variables.
- Step-2: Build a Market Model: Market-size estimations for the historical and forecast years have been provided in revenue and volume terms. Market revenue is calculated by multiplying the volume demand with volume-weighted average battery pack price (per kWh). Battery pack price estimation and forecast takes into account various factors affecting ASP, such as inflation rates, market demand shifts, production costs, technological developments, and consumer preferences, providing estimations for both historical data and future trends.
- Step-3: Validate and Finalize: In this important step, all market numbers, variables, and analyst calls are validated through an extensive network of primary research experts from the market studied. The respondents are selected across levels and functions to generate a holistic picture of the market studied.
- Step-4: Research Outputs: Syndicated Reports, Custom Consulting Assignments, Databases & Subscription Platforms


