
Technology, Media and Telecom
5th MayPricing Strategy for Semiconductor Components
3 Min Read
The Satellite-Based Earth Observation Market Report is Segmented by Service (Data, Value-Added-Services), Technology (Optical, Synthetic Aperture Radar, and More), Orbit Type (Very-Low-Earth Orbit, Low-Earth Orbit, and More), Application (Urban Development and Public Safety, Agriculture and Food Security, and More), and Geography. The Market Forecasts are Provided in Terms of Value (USD).
Market Overview
| Study Period | 2019 - 2030 |
|---|---|
| Market Size (2025) | USD 4.30 Billion |
| Market Size (2030) | USD 6.29 Billion |
| Growth Rate (2025 - 2030) | 7.90 % CAGR |
| Fastest Growing Market | Asia Pacific |
| Largest Market | North America |
| Market Concentration | Medium |
Major Players *Disclaimer: Major Players sorted in no particular order. Image © Mordor Intelligence. Reuse requires attribution under CC BY 4.0. |
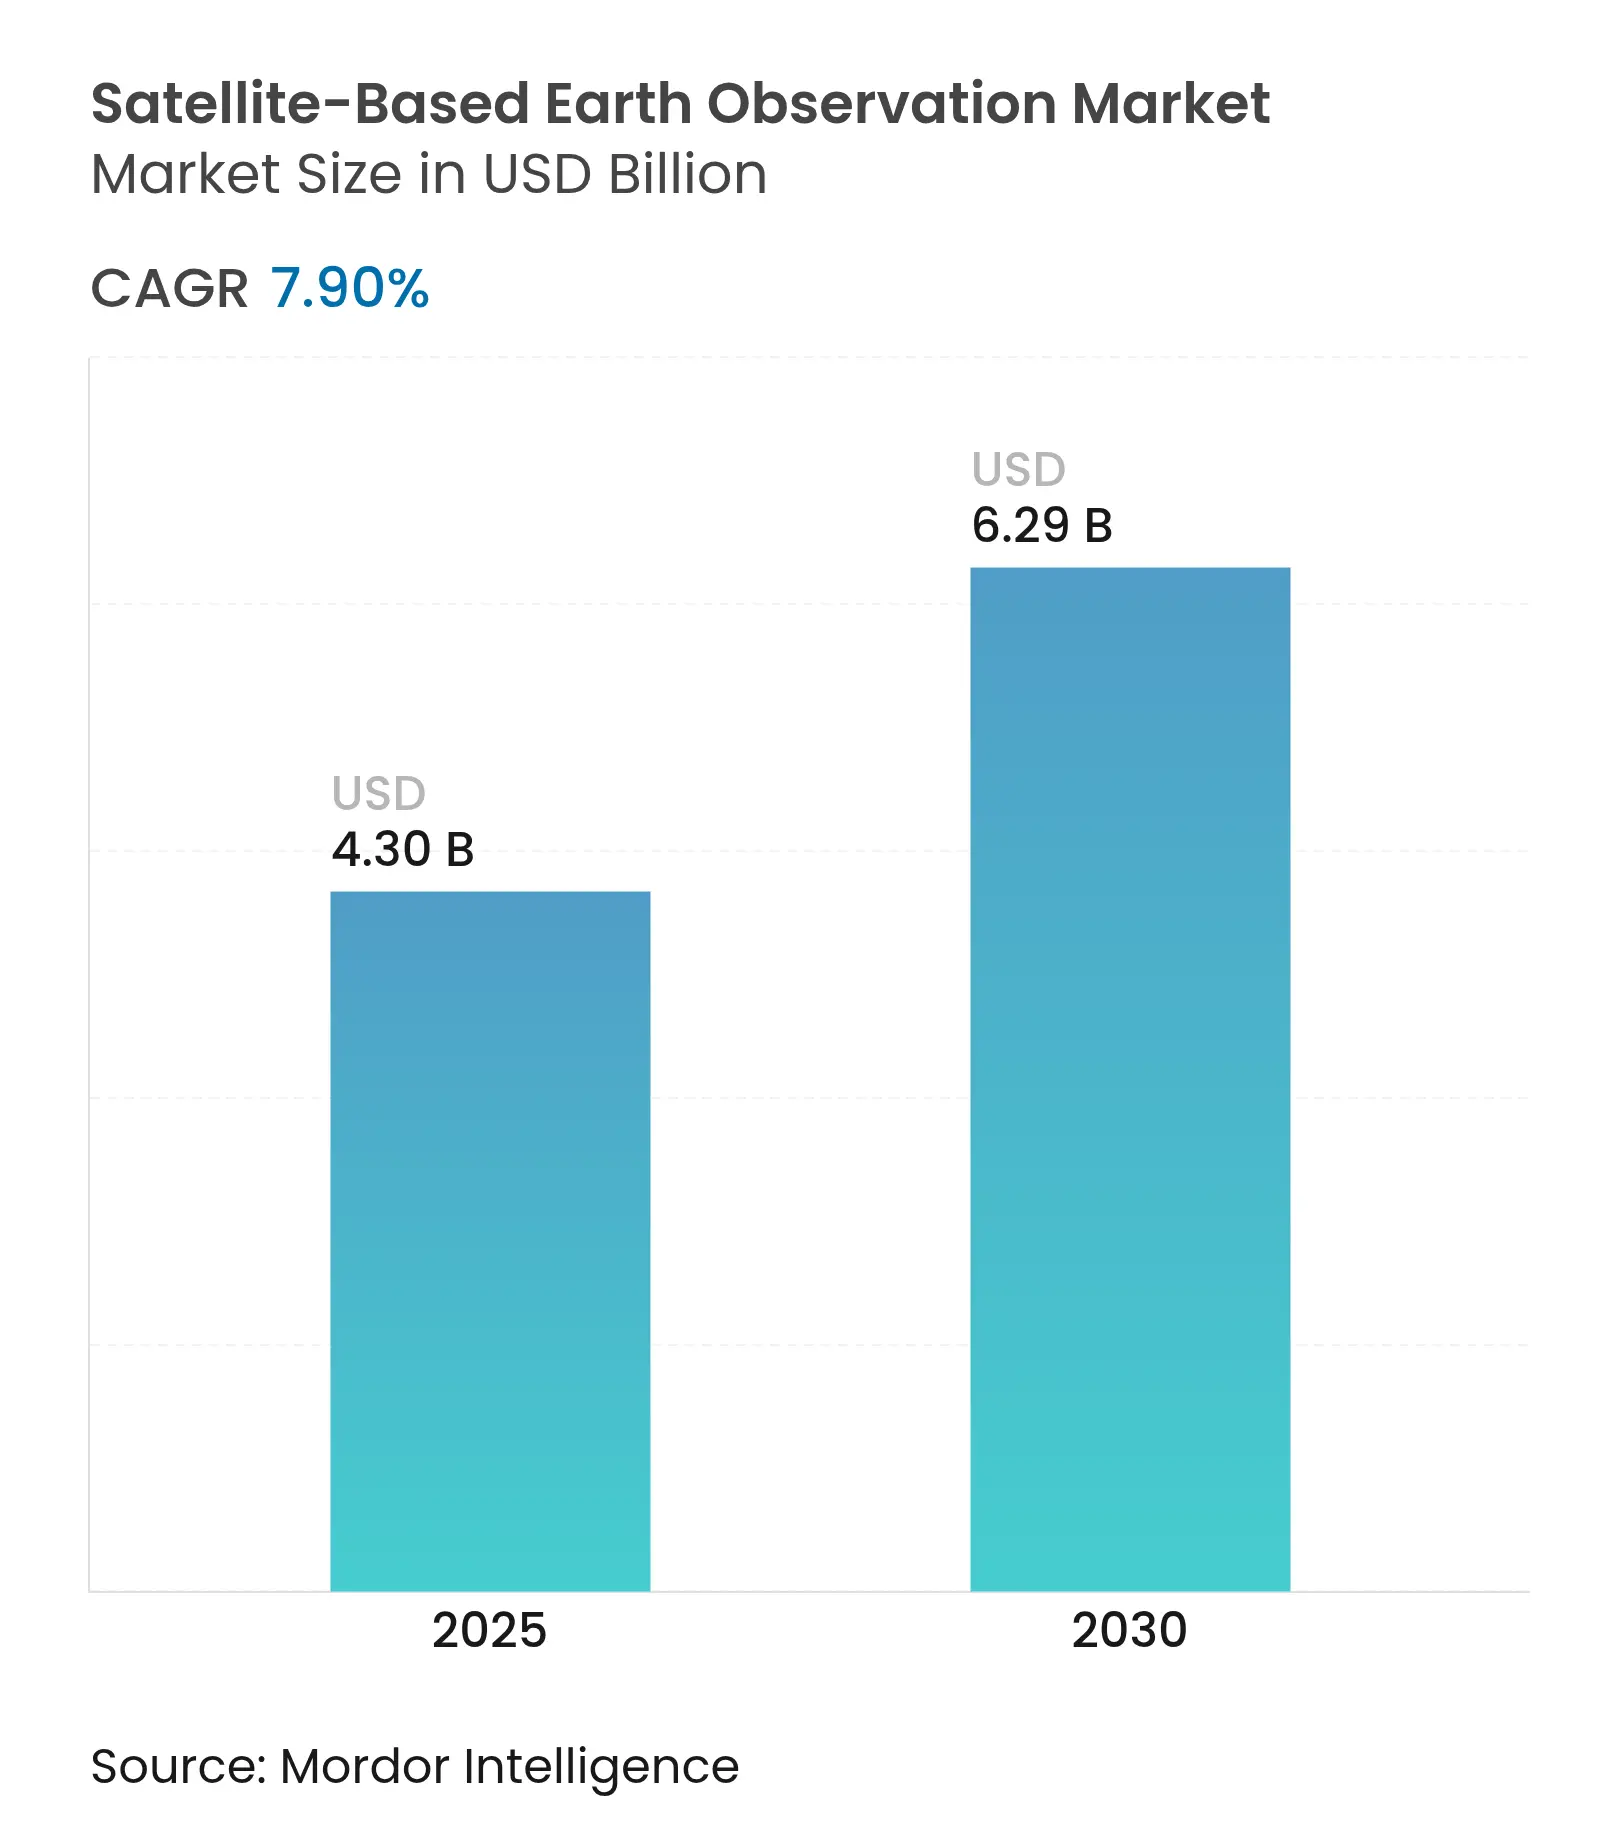
The Satellite-Based Earth Observation Market size is estimated at USD 4.30 billion in 2025, and is expected to reach USD 6.29 billion by 2030, at a CAGR of 7.90% during the forecast period (2025-2030). This expansion reflects a pivotal shift from government-centric programs toward commercial Earth-intelligence offerings that help corporations meet ESG reporting mandates, monitor supply chains, and manage climate risk. Robust demand for sub-daily imagery, enabled by Very Low Earth Orbit (VLEO) constellations, is lowering revisit times and creating real-time monitoring opportunities. Data-fusion platforms that blend optical, radar, and hyperspectral feeds with artificial-intelligence analytics are reducing time-to-insight, while cloud-native distribution models broaden customer access. North America’s early adoption of commercial tasking contracts and Asia-Pacific’s aggressive launch cadence reinforce a virtuous cycle of constellation growth, sensor innovation, and lower per-scene pricing. Against this backdrop, established aerospace primes face pricing pressure from agile NewSpace operators that package imagery with APIs and subscription dashboards, opening fresh revenue pools in insurance, commodities trading, and carbon-credit verification.
Key Report Takeaways
Drivers Impact Analysis
| Driver | (~) % Impact on CAGR Forecast | Geographic Relevance | Impact Timeline | |||
|---|---|---|---|---|---|---|
Increasing requirement for efficient monitoring of vast land areas Increasing requirement for efficient monitoring of vast land areas | +1.8% | Global, with concentration in North America and APAC | Long term (≥ 4 years) |
(~) % Impact on
CAGR Forecast
:
+1.8%
|
Geographic
Relevance
:Global, with concentration in North America
and APAC |
Impact Timeline
:
Long term (≥ 4 years)
|
Rising smart city and critical infrastructure initiatives Rising smart city and critical infrastructure initiatives | +1.5% | APAC core, spill-over to Europe and North America | Medium term (2-4 years) | |||
Big-data and imagery-analytics adoption across enterprises Big-data and imagery-analytics adoption across enterprises | +1.2% | Global, led by North America and Europe | Medium term (2-4 years) | |||
Emergence of VLEO constellations enabling sub-daily revisit Emergence of VLEO constellations enabling sub-daily revisit | +1.4% | Global deployment, early gains in North America | Short term (≤ 2 years) | |||
ESG-linked “Earth-Intelligence” demand from corporates ESG-linked “Earth-Intelligence” demand from corporates | +1.0% | Europe and North America, expanding to APAC | Medium term (2-4 years) | |||
Commercialization of SAR/hyperspectral sensors Commercialization of SAR/hyperspectral sensors | +1.1% | Global, with technology leadership in North America and Europe | Long term (≥ 4 years) | |||
| Source: Mordor Intelligence | ||||||
Increasing Requirement for Efficient Monitoring of Vast Land Areas
Large nations managing forests, pipelines, and critical supply routes require persistent observation that human-crewed aircraft or ground patrols cannot deliver at scale. Constellations equipped with optical and synthetic-aperture-radar (SAR) sensors now map deforestation, wildfire progression, and pipeline encroachments within hours of data collection. Governments integrate this flow into national security and environmental compliance systems, securing multi-year procurement budgets that underpin constellation cash flows. Cloud-hosted analytics convert terabytes of raw imagery into geofenced dashboards, enabling agencies to allocate resources quickly rather than wait for quarterly survey flights. The high-volume cadence drives down per-scene costs and opens doors for midsized agribusinesses to subscribe to the same feeds once reserved for federal authorities. Sustained land-management demand therefore provides a long-term underpinning for capacity expansion across the satellite-based earth observation market.
Rising Smart-City and Critical-Infrastructure Initiatives
Asia-Pacific megacities are installing digital twins that rely on centimeter-class remote-sensing layers to manage traffic, utilities, and climate-resilience upgrades [1]Staff Correspondent, “India’s Space-Startup Surge,” Economic Times, economictimes.indiatimes.com. Municipal authorities blend thermal and hyperspectral channels to detect heat-island hot spots, water-leak signatures, and structural fatigue in elevated railways. Commercial operators that guarantee fixed revisit windows obtain service-level agreements that smooth revenue volatility. In parallel, Europe’s Green Deal attaches grant funding to projects that use Earth-observation data as a verification tool, embedding remote sensing deep into public works procurement. As smart-infrastructure budgets scale, local system integrators partner with satellite companies to deliver turnkey dashboards, expanding the total contract value beyond raw imagery sales.
Big-Data and Imagery-Analytics Adoption Across Enterprises
Cloud-native analytics pipelines now ingest petabyte-scale archives and apply object-detection models that flag deforestation, illegal mining, or infrastructure anomalies within minutes of downlink [2]Staff Analysts, “Cloud-Egress Economics for Sat-Imagery,” Via Satellite, viasatellite.com. Corporations integrate alerts into enterprise resource planning software, triggering automated supply-chain interventions when risk thresholds are breached. Subscription models replace one-off scene purchases, driving sticky monthly recurring revenue that boosts valuation multiples for publicly listed operators. AI-driven analytics also lowers the technical barrier for non-geospatial professionals, expanding the customer base across fast-moving consumer goods, retail banking, and audit services. These dynamics amplify demand for value-added insight layers, reinforcing a virtuous cycle of constellation upgrades focused on spectral diversity and higher revisit frequency.
Emergence of VLEO Constellations Enabling Sub-Daily Revisit
Operating at altitudes below 450 km, VLEO spacecraft collect 10-centimeter imagery with revisit intervals of less than one hour over densely populated corridors [3]Editorial Desk, “Next-Gen VLEO Platforms,” SpaceNews, spacenews.com. Reduced atmospheric interference yields crisper scene geometry, improving machine-learning classification accuracy for small objects such as individual solar panels or road-surface cracks. Early-stage operators have demonstrated streamlined propulsion systems that counter aerodynamic drag, extending orbital life without frequent refueling maneuvers. National disaster agencies already issue real-time flood-risk alerts driven by VLEO snapshots, showcasing the life-safety benefits that strengthen public-funding coalitions. Heightened user expectations for near-real-time data subsequently spill into commercial segments, accelerating order books for next-generation platforms that can assure sub-hourly monitoring over strategic assets.
Restraints Impact Analysis
| Restraint | (~) % Impact on CAGR Forecast | Geographic Relevance | Impact Timeline | |||
|---|---|---|---|---|---|---|
Availability of open-source imagery for many countries Availability of open-source imagery for many countries | -1.2% | Global, particularly impacting developing markets | Long term (≥ 4 years) |
(~) % Impact on
CAGR Forecast
:
-1.2%
|
Geographic
Relevance
:
Global, particularly impacting developing
markets
|
Impact Timeline
:
Long term (≥ 4 years)
|
High bandwidth-costs for downlink and cloud egress High bandwidth-costs for downlink and cloud egress | -0.8% | Global, with higher impact in regions with limited ground infrastructure | Medium term (2-4 years) | |||
Spectrum congestion and inter-satellite interference Spectrum congestion and inter-satellite interference | -0.6% | Global, concentrated in heavily utilized orbital slots | Long term (≥ 4 years) | |||
Cyber-risk across satellite-ground data pipelines Cyber-risk across satellite-ground data pipelines | -0.4% | Global, with heightened concern in defense and critical infrastructure applications | Short term (≤ 2 years) | |||
| Source: Mordor Intelligence | ||||||
Availability of Open-Source Imagery for Many Countries
NASA’s Landsat archive and the European Space Agency’s Copernicus Sentinels distribute more than 20 TB of data each day at zero cost to the end user [4]ESA Editorial Team, “Copernicus Data Access Annual Report,” European Space Agency, esa.int. Non-profit organizations leverage this imagery for deforestation alerts and flood-mapping portals, setting a baseline expectation that geospatial data should be free. Commercial operators must therefore outperform on either spatial resolution or temporal frequency to justify subscription pricing. The result is a bifurcation of the satellite-based earth observation market, where entry-level mapping needs to default to open data while premium applications, such as methane leak detection, command higher rates. Although the open-data movement democratizes access, it also compresses margins on generic scenes and forces private firms to accelerate their shift into analytics and sector-specific solutions.
High Bandwidth Costs for Downlink and Cloud Egress
A single day of 30 cm global coverage can exceed multiple petabytes, making ground-station bandwidth and cloud-egress fees a material cost line. Operators prioritize high-revenue tasks during peak orbital passes, leaving lower-margin scenes uncollected or delayed. To mitigate expenses, constellations explore on-board processing that filters and compresses imagery before transmission, yet power and thermal constraints limit compute intensity. The economic trade-off shapes constellation design: fewer high-capacity buses with wide downlink pipes versus swarm-style fleets that rely on inter-satellite links and mesh networks. Until cloud providers adjust pricing for Earth-observation workloads, bandwidth drag will continue to temper the growth vector of the satellite-based Earth observation market.
By Service: Analytics Edge Fuels Upsell Potential
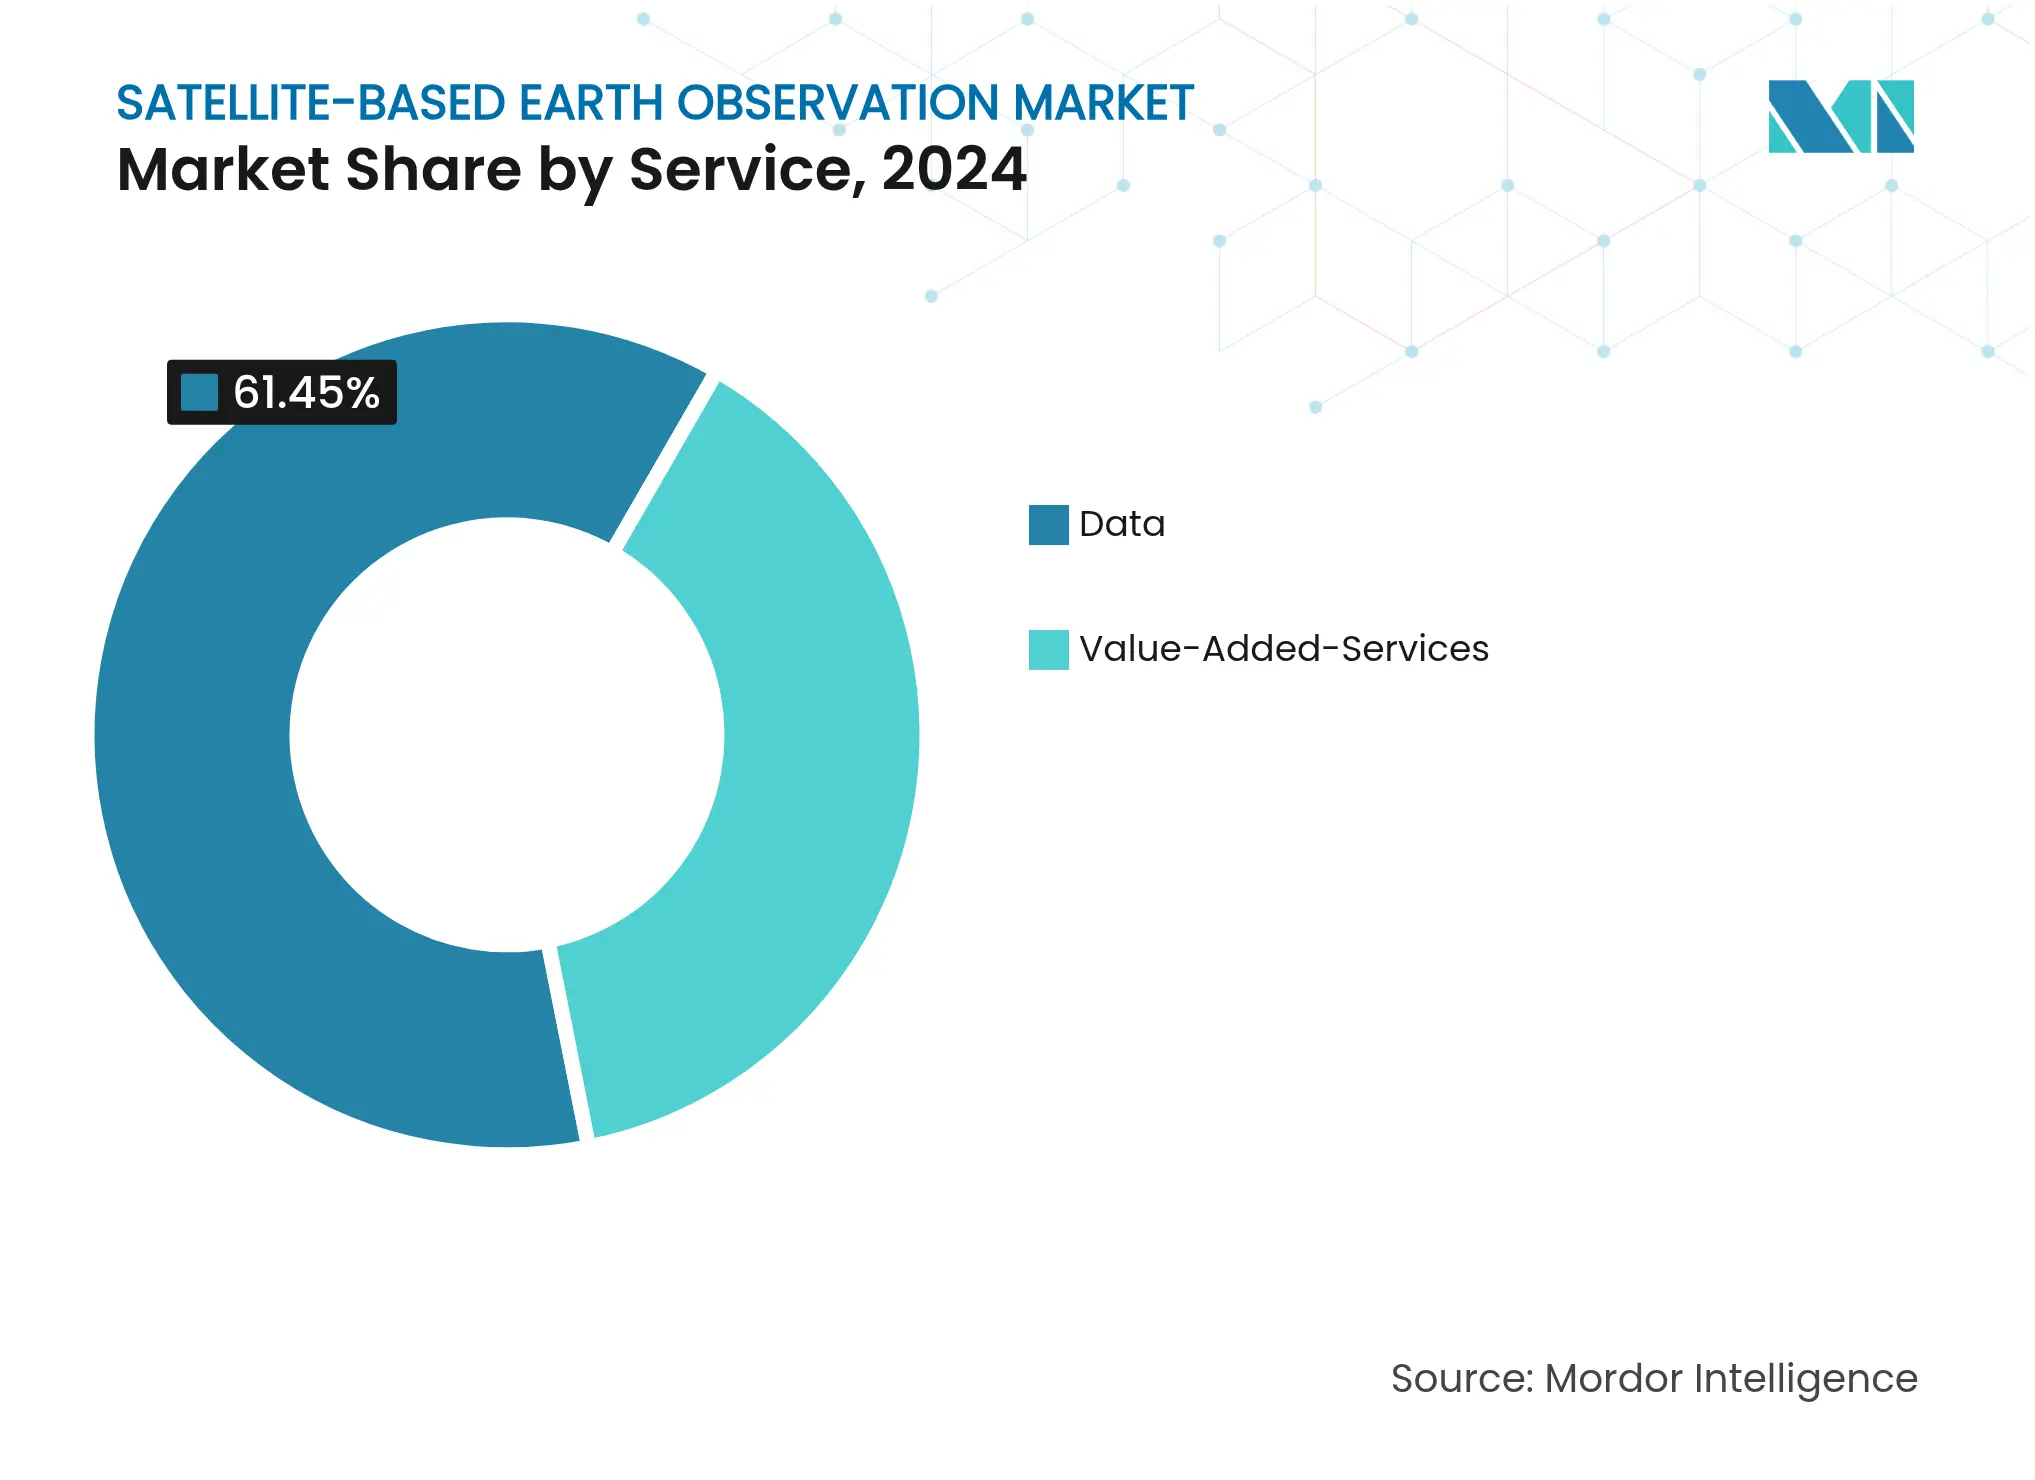
The service dimension of the satellite-based earth observation market places Data services firmly in the lead, but Value-Added Services are claiming an ever-larger slice of the revenue pie. In 2024, Data services contributed USD 2.8 billion, equating to 61.45% of the satellite-based earth observation market share. Value-Added Services, however, are tracking a 9.87% CAGR that will swell their contribution to more than one-third of the total by 2030. This shift aligns with corporate moves to outsource geospatial workflows and subscribe to dashboards that deliver anomaly alerts, compliance metrics, and predictive analytics.
Demand momentum stems from enterprise risk managers seeking seamless API hooks that pump location-specific insight directly into governance, risk, and compliance software. Planet Labs’ agriculture partnership pipeline demonstrates that thematic analytics can command premium unit economics compared with raw imagery. Multisource fusion, blending SAR, optical, and Internet-of-Things data, further differentiates service tiers and cements customer lock-in. As competition intensifies, operators able to package insights, host historical archives, and guarantee uptime are positioned to monetize recurring contracts far longer than the five-year depreciation cycle of an imaging satellite itself.
By Technology: Hyperspectral Ascends Beyond Niche
Optical sensors anchor 58.23% of the technology mix, yet the hyperspectral subset is racing ahead at a 10.34% CAGR. In numerical terms, hyperspectral payload revenue is expected to more than double between 2025 and 2030, lifting its slice of the satellite-based earth observation market size well above the mid-single-digit range attached in 2024. Agricultural co-ops, mining majors, and environmental auditors prize the 200-plus spectral bands that detect chemical fingerprints invisible to RGB lenses, opening lucrative verticals in nutrient management and ore-body identification.
This performance triggers a reinvestment loop: lower launch costs encourage additional spectral channels, which in turn attract specialized analytic workflows that monetize the granularity. SAR retains a robust following in maritime, defense, and infrastructure monitoring because it penetrates cloud cover and operates day and night. Meanwhile, radio-occultation sensors, though modest in market contribution, supply atmospheric profiles that feed numerical weather models indispensable to transport and energy traders. Technology diversity, therefore, invigorates supplier competition and advances the total functional scope of the satellite-based earth observation market.
By Orbit Type: VLEO Redraws the Cadence Map
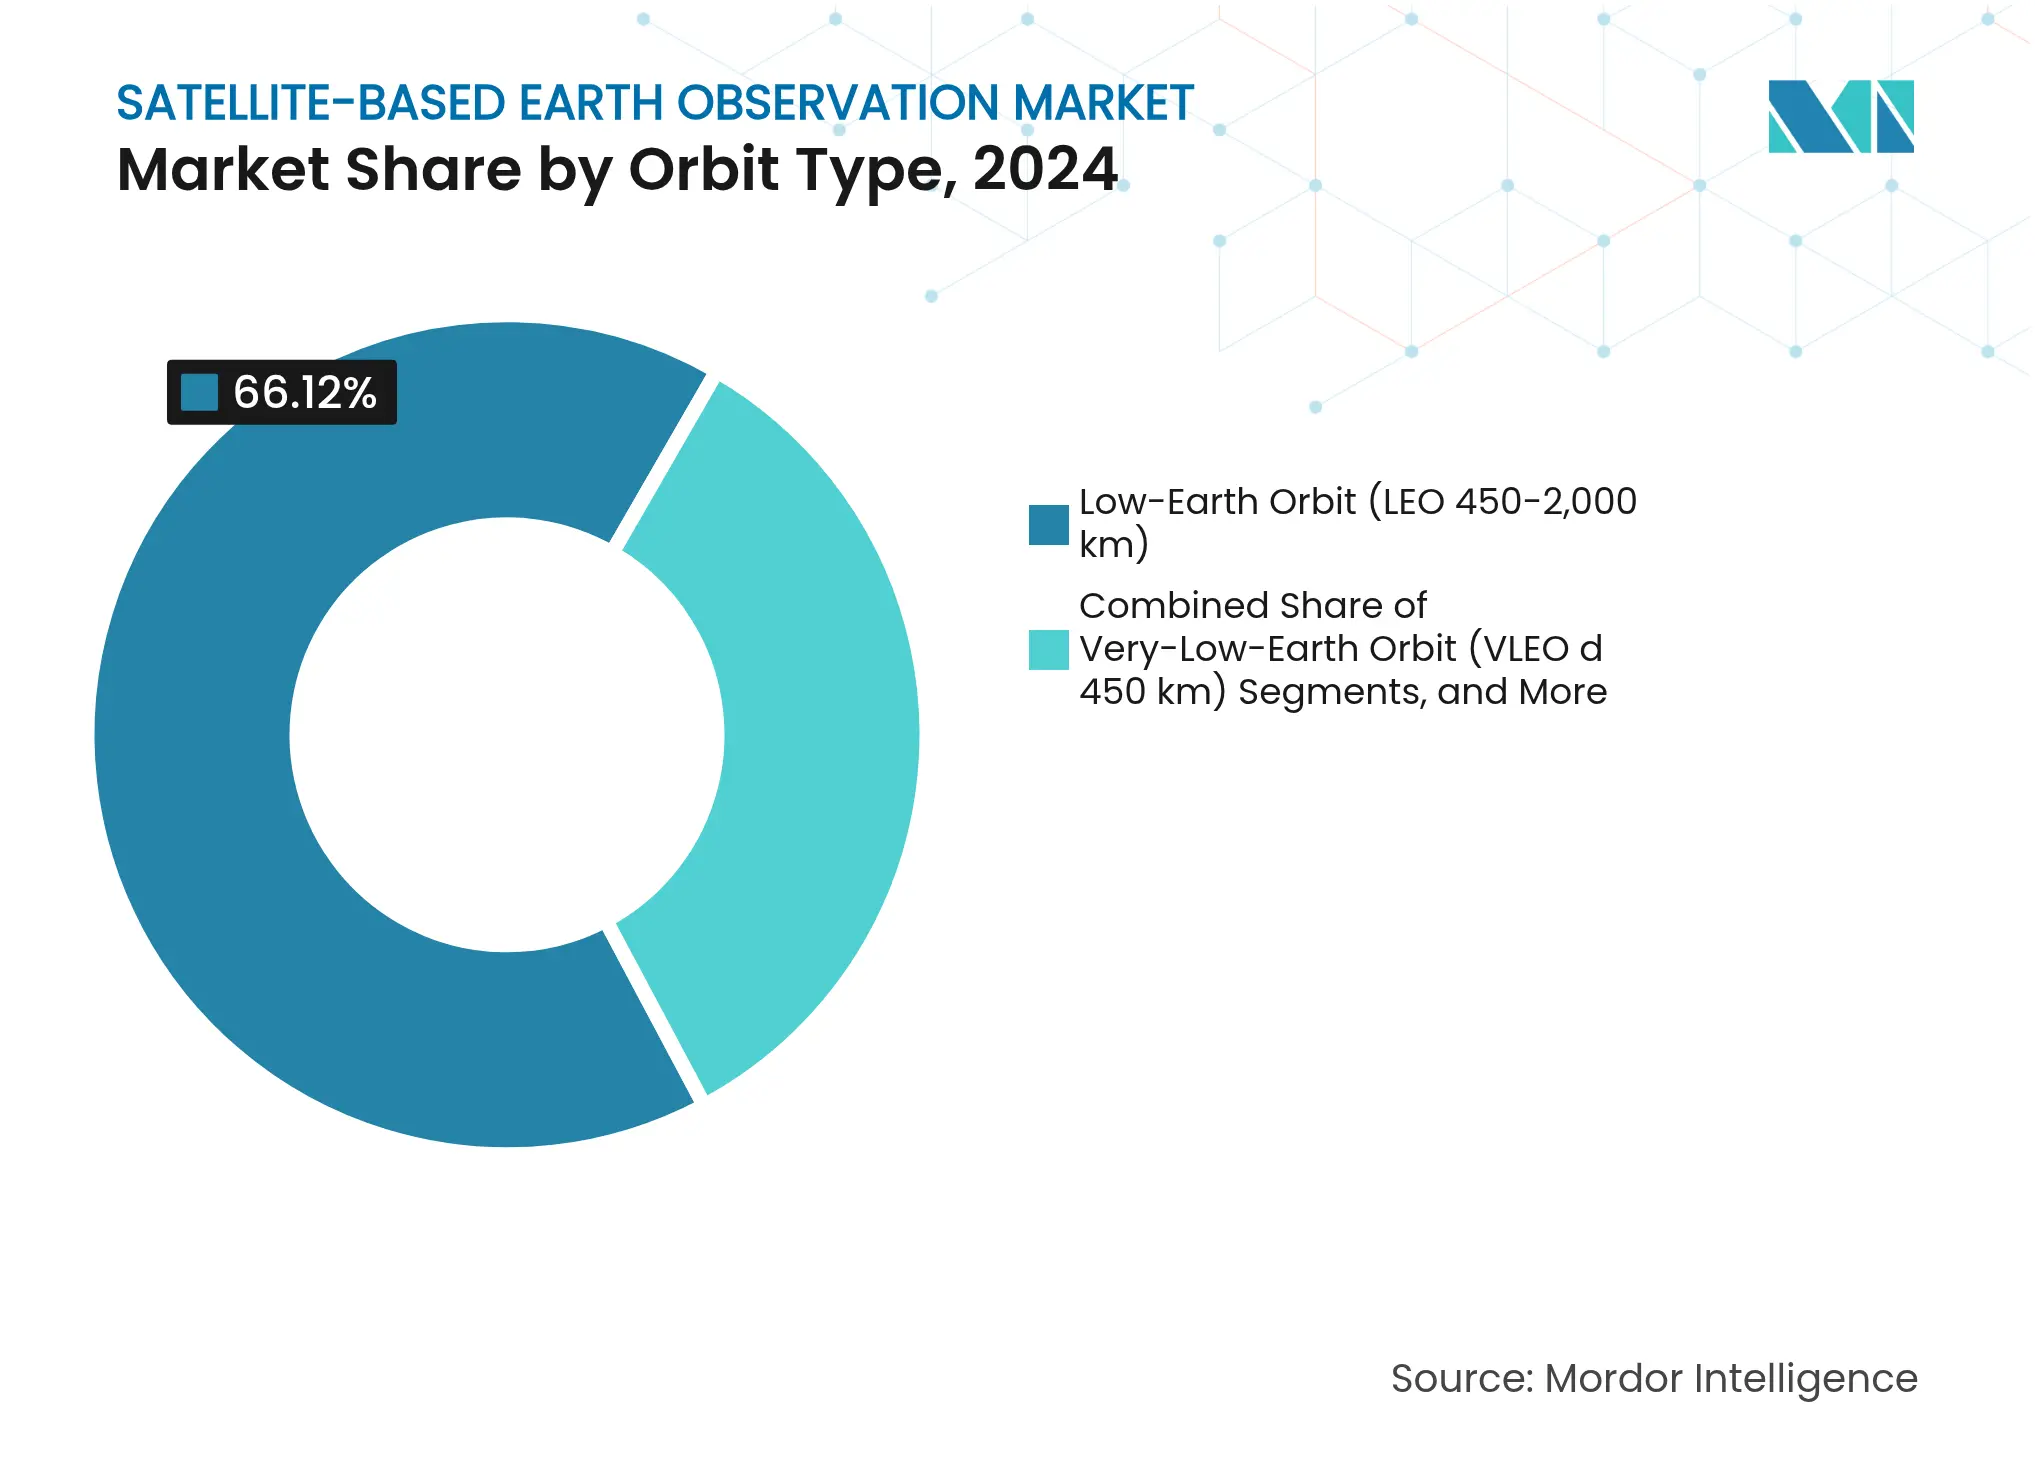
Low Earth Orbit remains the workhorse, accounting for 66.12% of revenue in 2024, but Very Low Earth Orbit is scaling quickly. Operators that settle below 450 km deliver sharper imagery and revisit rates measured in tens of minutes, a leap that resonates with insurers running catastrophe-response protocols and utilities tracking wildfire proximity. With an expected 11.22% CAGR, VLEO’s revenue share could climb into the high-teens by 2030, adding a fresh dynamic to the satellite-based earth observation market.
Operational drag at these altitudes raises station-keeping costs, so propulsion efficiency and automated maneuvering algorithms become decisive competitive levers. Hybrid constellations that mix VLEO for urgency with higher-orbit assets for endurance optimize both temporal and lifetime economics. Medium Earth Orbit and geostationary nodes persist as complementary platforms, providing atmospheric sounders and broadband backhaul that fuse seamlessly with optical and SAR imaging streams. Orbit versatility is therefore transforming procurement decisions, as customers pivot from platform-specific bids toward service-level agreements that specify resolution, latency, and guarantee windows irrespective of altitude.
Note: Segment shares of all individual segments available upon report purchase
By Application: Climate-Linked Use-Cases Gain Policy Tailwind
Defense and intelligence contracts supplied 24.87% of 2024 revenue, but climate and environmental services now headline growth charts at 10.12% CAGR. EU Carbon Border Adjustment mechanisms and US SEC climate-disclosure proposals institutionalize satellite verification of emission baselines, triggering long-term service agreements for greenhouse-gas mapping and biodiversity audits.
Energy majors map methane plumes with hyperspectral lenses, while consumer-goods conglomerates police zero-deforestation pledges through weekly canopy-loss dashboards. Agriculture shapes another growth pillar, with fertilization algorithms fed by multispectral indices that cut input costs and improve yield predictability. Urban planners layer thermal imaging over cadastral maps to prioritize cooling-corridor projects, aligning with smart-city directives that unlock multilateral development financing. Such breadth insulates the satellite-based earth observation market from cyclical swings in any single sector, delivering a diversified demand portfolio that underwrites investor confidence.
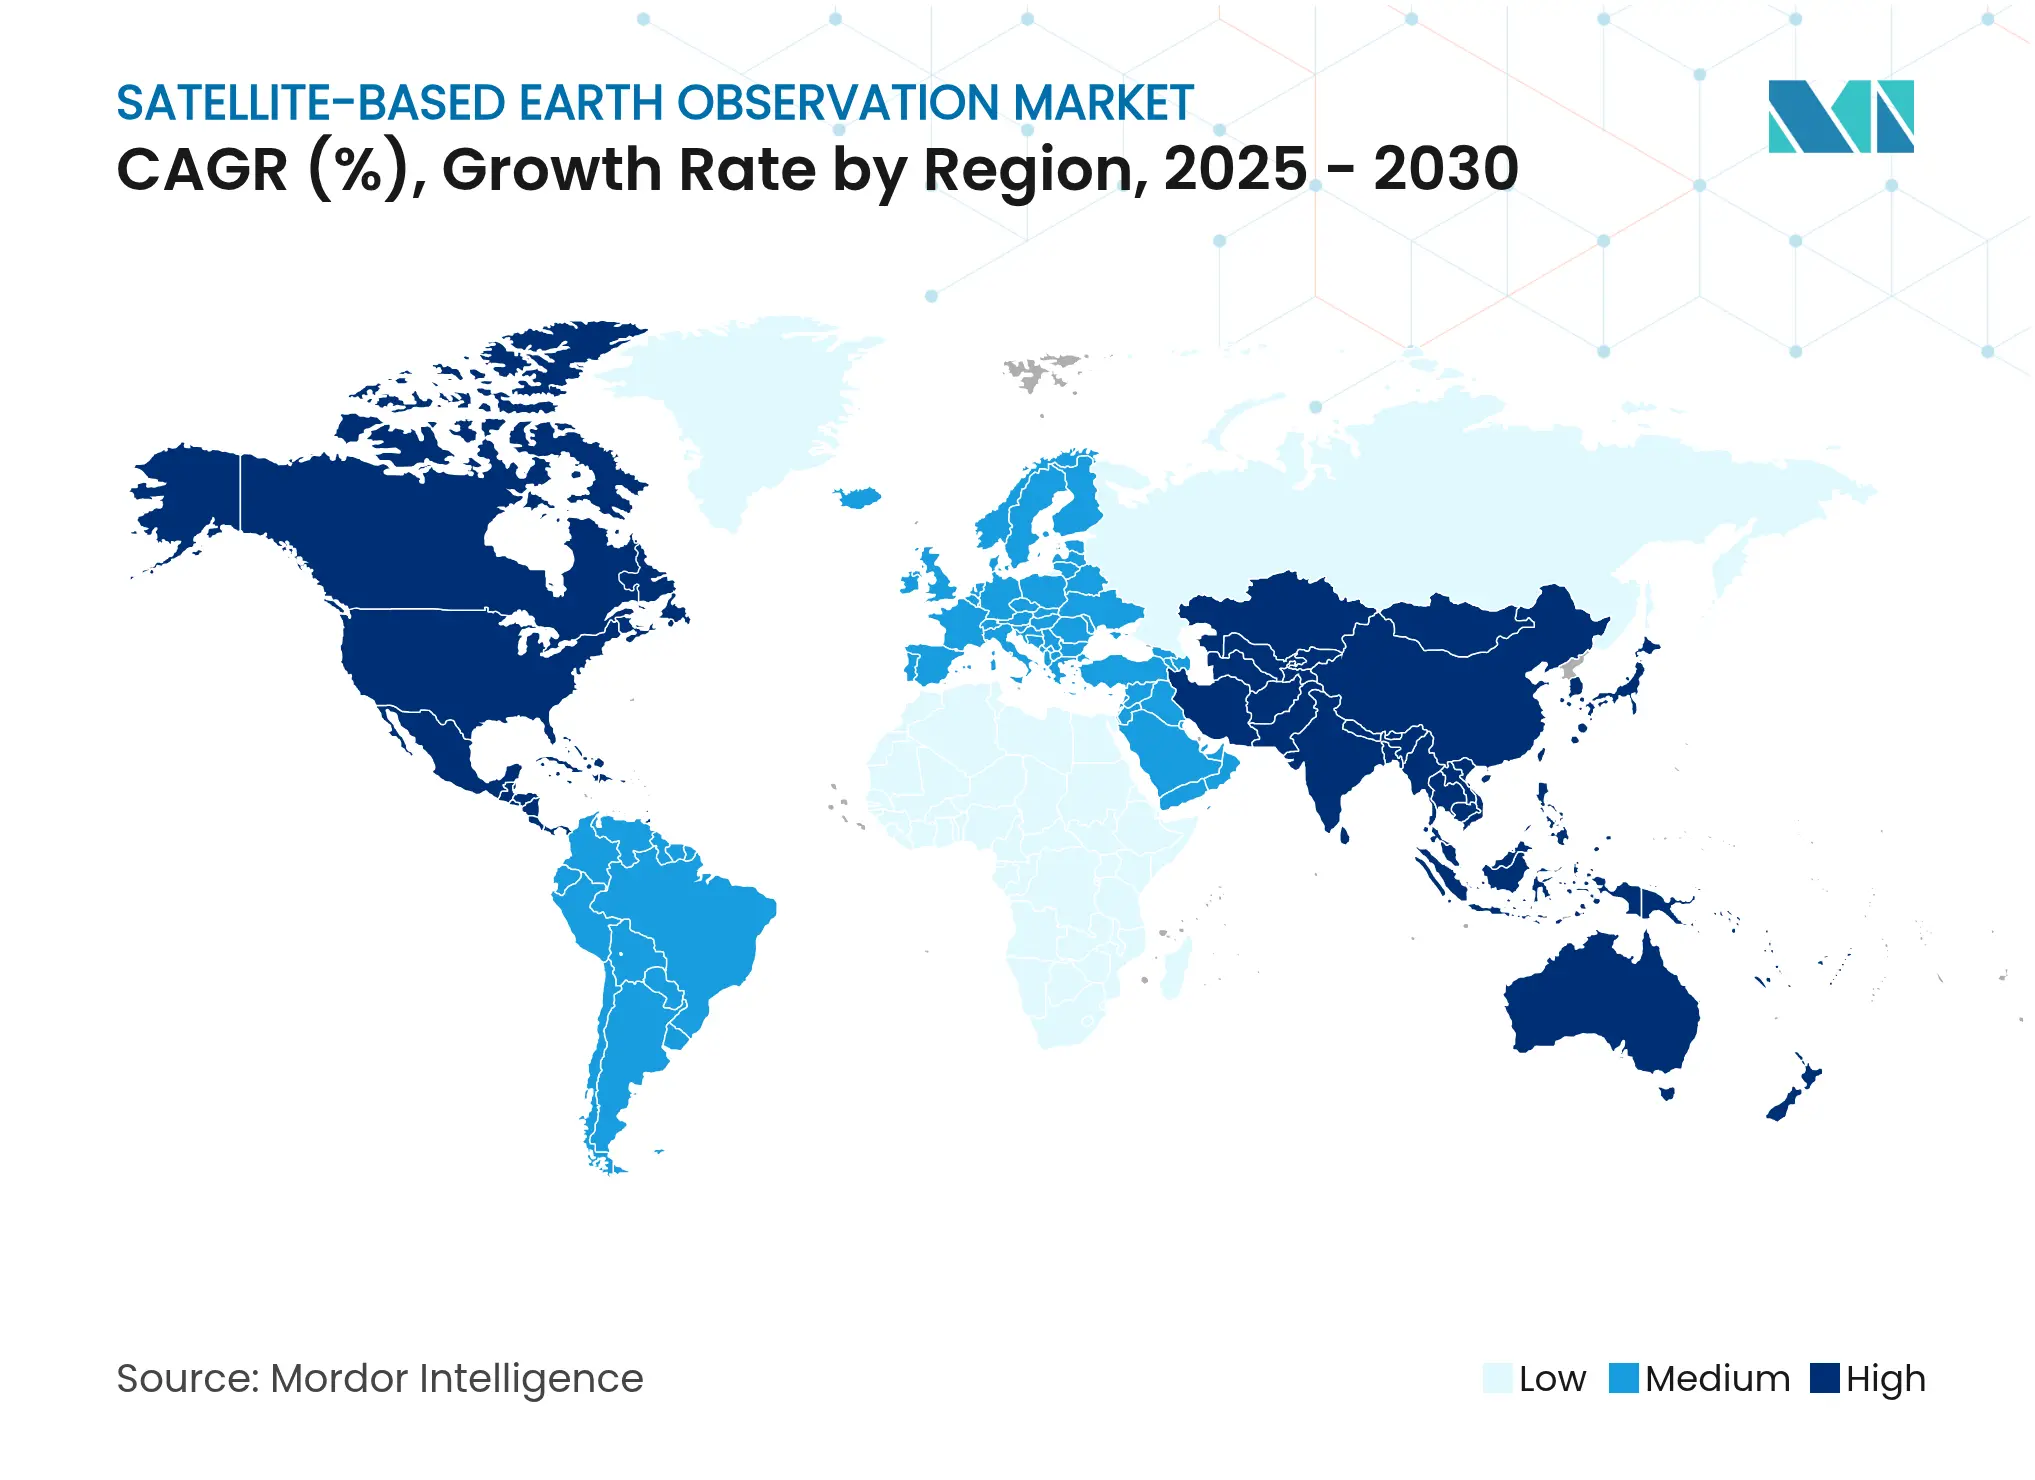
North America booked 38.60% of global 2024 revenue on the back of defense procurement, robust venture financing, and a vibrant downstream analytics ecosystem. Federal anchor contracts from the National Reconnaissance Office and the National Geospatial-Intelligence Agency secure baseline cash flows that absorb early-stage constellation risk. Public-private partnerships accelerate technology maturation, as seen in synthetic-aperture-radar data buys that guarantee uptake years before launch. The region’s developer community also leads in serverless-processing architectures that curtail total-cost-of-ownership for imagery analytics, reinforcing the continent’s primacy within the satellite-based earth observation market.
Asia-Pacific posts the fastest 8.70% CAGR to 2030, buoyed by India’s private-launch reforms and China’s end-to-end supply chain that folds satellite buses, propulsion, and data sales into unified state-backed conglomerates. Startup incubators from Bengaluru to Singapore channel seed capital into hyperspectral payload developers and maritime-tracking analytics firms. Government demand peaks around smart-city pilots and agricultural modernization projects, turning local municipalities into anchor tenants that stimulate regional ground-station build-outs. Japan and South Korea supplement this ecosystem with robotics and sensor miniaturization, while Australia funnels climate-adaptation grants into drought-monitoring constellations.
Europe combines policy heft with scientific rigor, leveraging the Copernicus program to maintain a global index of openly accessible imagery. Commercial operators pivot toward premium layers, higher resolution, thermal channels, or near-real-time analytics to escape direct price competition with Sentinel data. EU sustainability regulations mandate geospatial evidence in corporate disclosures, creating a consistent pull-through for value-added services. Meanwhile, South America, Africa, and the Middle East represent frontier arenas where lower launch costs and PAYG data platforms align with resource-management challenges such as artisanal mining oversight and groundwater stress mapping. Collectively, these geographies broaden the addressable base and diversify currency exposure for firms active in the satellite-based earth observation market.
Market Concentration
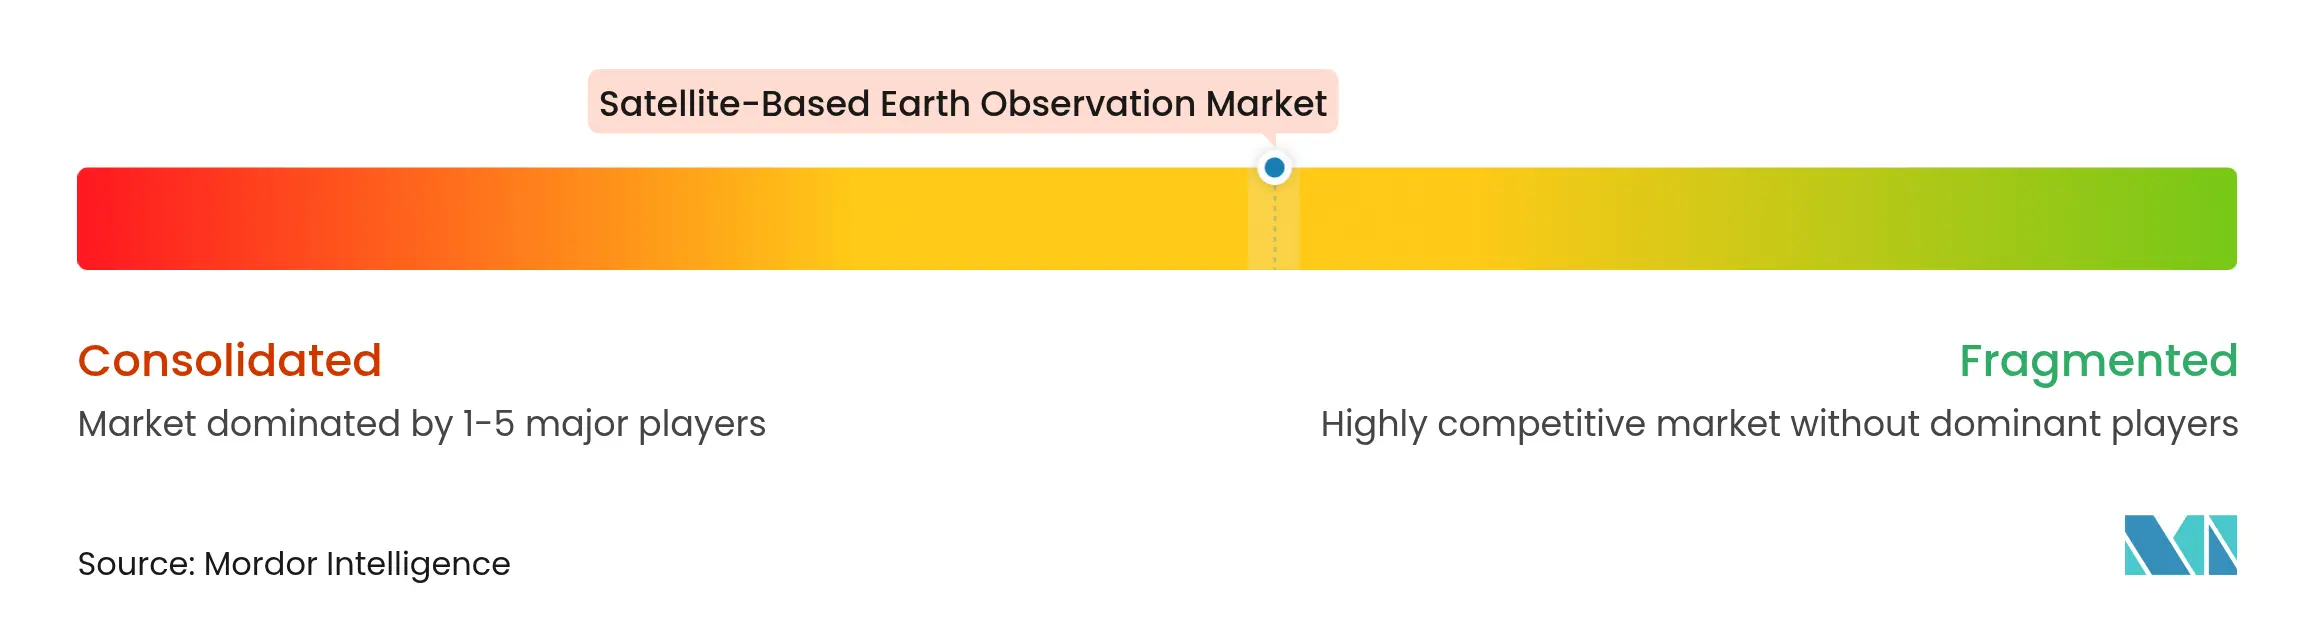
The satellite-based earth observation market balances moderate consolidation with disruptive entry, as the top five vendors command roughly one-half of global revenue while more than 150 startups jostle for niche footholds. Planet Labs, Maxar Technologies, and Airbus Defense and Space weaponize scale, offering archived scenes dating back decades and throughput exceeding 10 million square kilometers per day. Subscription bundles encourage multi-year renewals that deepen switching costs. Concurrently, SAR specialist ICEYE and hyperspectral newcomer Pixxel champion sensor differentiation over volume, illustrating that precision beats breadth in high-margin verticals such as mineral exploration or flood underwriting.
Strategic moves over 2024-2025 spotlight integration. Maxar aligned with Satellogic to weave tasking APIs across optical fleets, lifting revisit metrics without fresh capex. Neo Space Group’s takeover of the UP42 marketplace curates third-party algorithms besides in-house imagery, monetizing a platform model akin to app stores in mobile ecosystems. Private operators also co-locate ground stations near low-latency cloud regions to shorten ingestion pipelines, addressing user demand for sub-hour reporting. Pricing discipline remains a pressure point: open-source data undercuts commoditized scenes, forcing premium providers to justify tariffs through analytics, time guarantee, or spectral richness.
National security imperatives inject another layer of competition. Governments lean on domestic champions to secure assured access, driving differential regulation on foreign ownership and spectrum allocation. This segmentation favors players willing to localize data storage or create joint ventures, particularly across Asia-Pacific and Middle East jurisdictions. As capital markets shift toward profitability scrutiny, merger-and-acquisition chatter intensifies around constellation pooling and downstream-software roll-ups. Operators with vertically integrated stacks, from sensor design through analytics dashboards, stand best placed to harvest end-to-end margin and withstand cyclical downturns in raw-imagery pricing.

*Disclaimer: Major Players sorted in no particular order
1. INTRODUCTION
2. RESEARCH METHODOLOGY
3. EXECUTIVE SUMMARY
4. MARKET LANDSCAPE
5. MARKET SIZE AND GROWTH FORECASTS (VALUE)
6. COMPETITIVE LANDSCAPE
7. MARKET OPPORTUNITIES AND FUTURE OUTLOOK
The satellite-based earth observation market study captures the revenue accrued through imaging services of the earth for monitoring, surveillance, and decision-making for various end-user verticals across the world.
The satellite-based earth observation market is segmented by service (data, value-added-service), technology (synthetic aperture radar, optical), application (urban development, agriculture, climate and environment services, energy, infrastructure monitoring, disaster and emergency management, other applications), and geography (North America, Europe, Asia Pacific, Middle East, and Africa, Latin America). The market sizes and forecasts are provided in terms of value (USD) for all the above segments.
Pricing Strategy for Semiconductor Components
3 Min Read
Accelerating Additive Manufacturing Adoption in India
3 Min Read
When decisions matter, industry leaders turn to our analysts. Let’s talk.