Market Overview
| Study Period | 2018 - 2031 |
|---|---|
| Forecast Data Period | 2026 - 2031 |
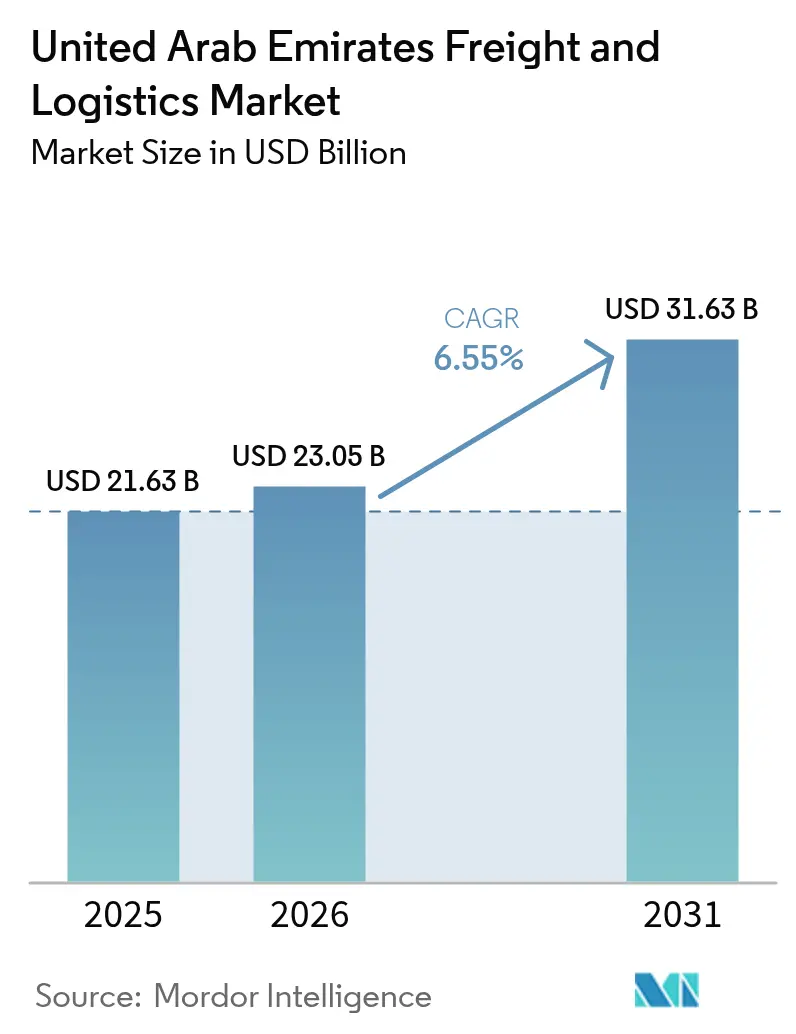
| Base Year Market Size (2025) | USD 21.63 Billion |
| Market Size (2026) | USD 23.05 Billion |
| Market Size (2031) | USD 31.63 Billion |
| Growth Rate (2026 - 2031) | 6.55% CAGR |
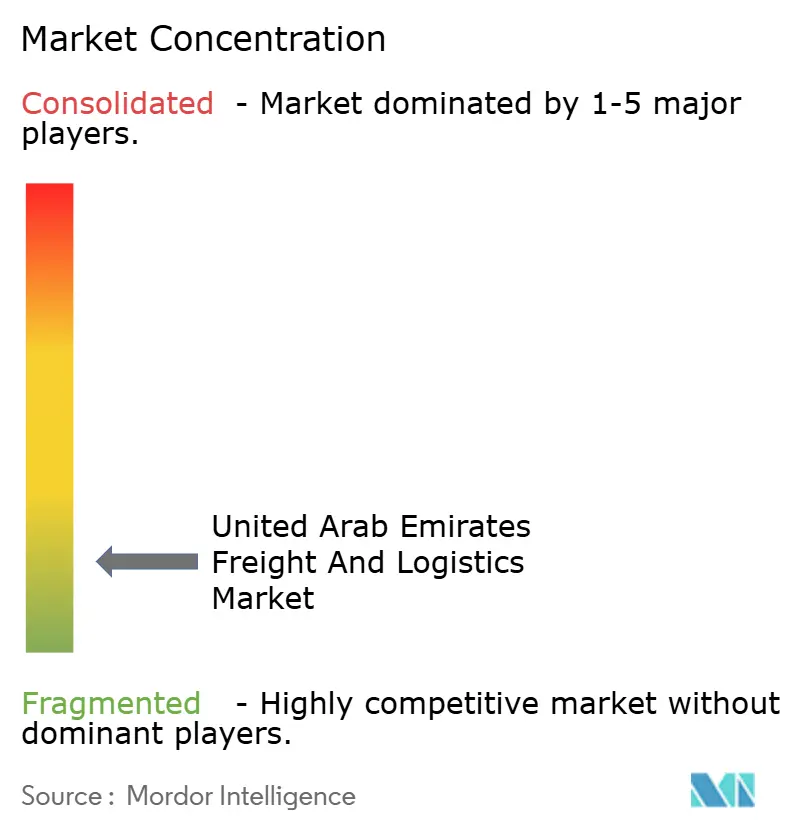
| Market Concentration | Low |
Major Players *Disclaimer: Major Players sorted in no particular order Image © Mordor Intelligence. Reuse requires attribution under CC BY 4.0. | |
United Arab Emirates Freight And Logistics Market Analysis by Mordor Intelligence
The United Arab Emirates freight and logistics market size was valued at USD 21.63 billion in 2025 and estimated to grow from USD 23.05 billion in 2026 to reach USD 31.63 billion by 2031, at a CAGR of 6.55% during the forecast period (2026-2031). The expansion rests on the Emirates’ gateway location between Asia, Europe, and Africa, multi-modal capacity upgrades, and investor-friendly rules that have already lifted non-oil foreign trade to USD 1.42 trillion in 2024, 49% above 2021 levels. Air cargo still dominates in value terms, yet expanded port, rail, and free-zone assets are accelerating sea and inland freight growth. The sector also benefits from e-commerce density in Dubai and Abu Dhabi, regulatory liberalization that allows 100% foreign ownership, and aggressive adoption of AI-enabled route optimization that cuts operating costs and emissions. Geopolitical risks, fuel volatility, and mandated greenhouse-gas reporting under the 2024 Federal Climate Law temper margins, but the overall growth trajectory of the United Arab Emirates freight and logistics market remains firmly upward as capacity additions outpace restraints through 2030.
Key Report Takeaways
- By logistics function, freight transport led with 53.35% of the United Arab Emirates market share in 2025, whereas courier, express, and parcel services are forecast to register the quickest expansion at 7.52% CAGR between 2026-2031.
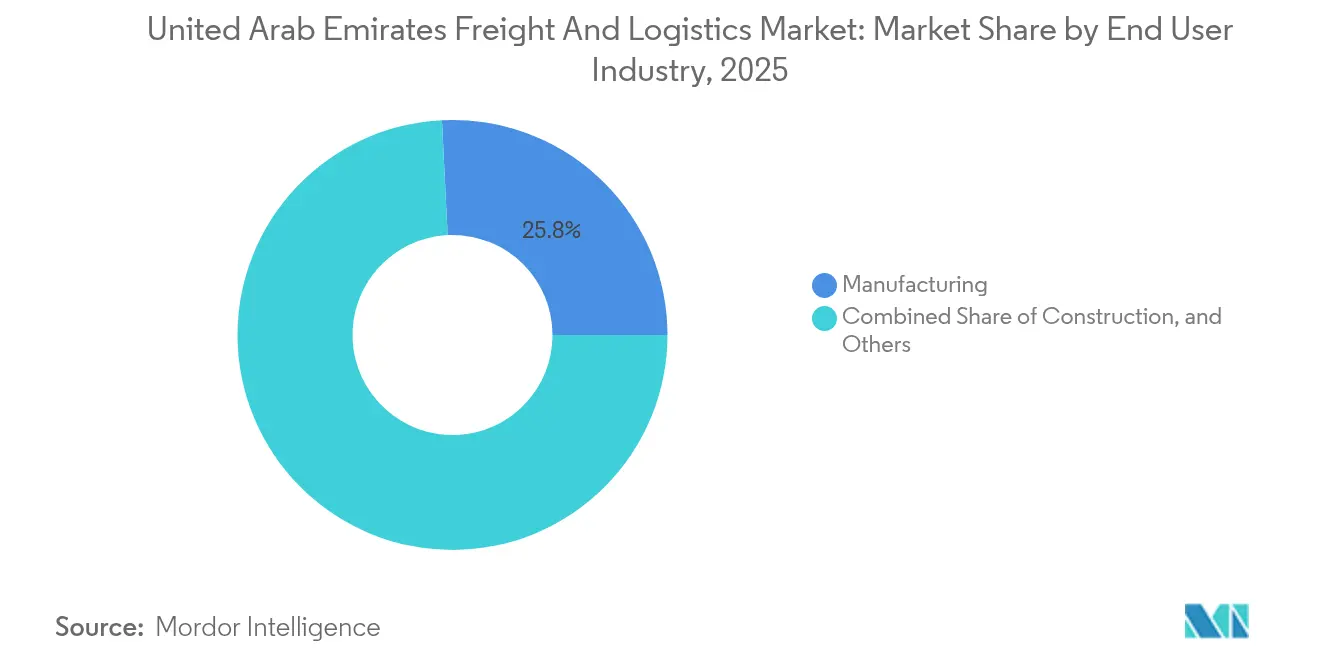
- By end user industry, manufacturing accounted for 25.78% of the United Arab Emirates market size in 2025, while wholesale and retail trade is projected to grow at a 7.05% CAGR between 2026-2031, the highest across industries.
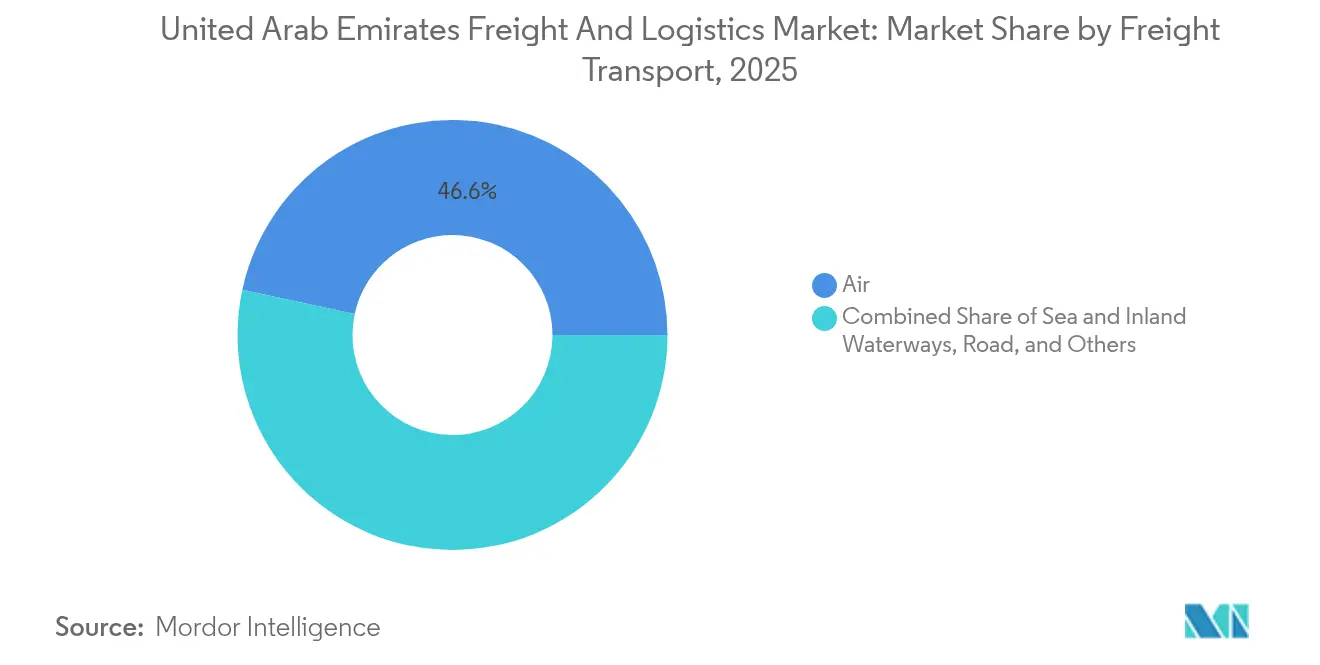
- By freight transport mode, air freight captured a 46.62% share in 2025, yet sea and inland waterways freight are set to advance at an 8.55% CAGR between 2026-2031.
- By courier, express, and parcel type, domestic deliveries dominated with 64.72% revenue share in 2025, whereas international flows are poised to expand at an 7.85% CAGR between 2026-2031.
- By warehousing and storage type, non-temperature-controlled sites comprised 89.60% of revenue share in 2025, while temperature-controlled facilities are expected to expand at a 7.60% CAGR between 2026-2031.
- By freight forwarding mode, air freight forwarding held a 44.33% share in 2025, but sea and inland waterways freight forwarding are forecast to grow fastest at 8.12% CAGR between 2026-2031.
Note: Market size and forecast figures in this report are generated using Mordor Intelligence’s proprietary estimation framework, updated with the latest available data and insights as of 2026.
United Arab Emirates Freight And Logistics Market Trends and Insights
Drivers Impact Analysis*
| Driver | (~) % Impact on CAGR Forecast | Geographic Relevance | Impact Timeline |
|---|---|---|---|
| Exploding B2C e-commerce volumes | +1.8% | Dubai and Abu Dhabi core | Medium term (2-4 years) |
| Multi-billion-dollar port, airport and rail upgrades | +1.5% | National / GCC spillover | Long term (≥ 4 years) |
| Free-zone incentives and 100% foreign-ownership rules | +1.2% | Nationwide | Short term (≤ 2 years) |
| Etihad Rail Phase 2 and GCC rail integration | +1.0% | UAE-Saudi-Oman corridor | Long term (≥ 4 years) |
| AI-led supply-chain density strategies | +0.8% | Dubai and Abu Dhabi | Medium term (2-4 years) |
| Hyperloop cargo pilot Dubai–Abu Dhabi | +0.4% | Dubai–Abu Dhabi corridor | Long term (≥ 4 years) |
| Source: Mordor Intelligence | |||


Exploding B2C E-Commerce Volumes
E-commerce logistics demand is soaring as national online food sales crossed USD 1.07 billion in 2023 and Amazon enlarged domestic fulfillment space by 175,000 m², a 70% capacity jump[1]“Exporter Guide Annual: United Arab Emirates,” U.S. Department of Agriculture, Foreign Agricultural Service, USDA.gov. Dense population clusters in Dubai and Abu Dhabi allow parcel carriers to meet same-day service promises at scale. Government-run digitization programs simplify business licensing and customs, encouraging omnichannel models that blend storefront, mobile and social commerce. Global integrators such as UPS locked in a USD 100 million Dubai South investment in March 2025 to automate last-mile sorting, thereby positioning early for the next wave of volume. Tougher cold-chain rules embedded in the Federal Food Safety Law elevate entry barriers, giving incumbents with compliant infrastructure an edge as temperature-sensitive segments from groceries to biologics migrate online. GCC neighbors increasingly source via UAE e-hubs, extending domestic parcel growth into high-margin cross-border moves.
Multi-Billion-Dollar Port, Airport and Rail Upgrades
DP World’s USD 2.5 billion program pushed national throughput capacity past 100 million TEU in January 2025, an 8.3% jump over 2024 volumes. Jebel Ali’s fourth container terminal coincides with revamped cargo aprons at Dubai International Airport, shrinking air–sea transshipment dwell times for high-value goods. Red Sea disruptions diverted flows toward the Emirates, where excess berth space absorbed traffic that faced 15-25% rate hikes elsewhere. Etihad Rail Phase 2, traversing 605 kilometers, will lift rail freight capacity to 50 million tonnes and cut road-freight carbon output by 21% by 2050. Pharmaceutical and perishables handling is further strengthened by targeted upgrades from Emirates SkyCargo and Etihad Cargo, cementing the country’s appeal as a regional cold-chain node. Future GCC rail links to Saudi Arabia and Oman can unlock USD 100 billion in incremental trade, deepening the United Arab Emirates freight and logistics market’s hinterland.
Free-Zone Incentives and 100% Foreign-Ownership Rules
Full foreign ownership, zero income taxes and modern customs regimes lured more than USD 5 billion in fresh logistics capital during 2024, including Kuehne+Nagel’s e-commerce hub in Dubai South. Forty-five active free zones now compete on sector-specific perks—ranging from bonded warehousing to biotech labs—driving continuous service upgrades. The October 2024 RAKEZ-Emirates Post pact illustrates how public-private tie-ups bundle licensing, warehousing and last-mile delivery for 25,000 resident firms. These pro-investment policies shorten set-up timelines, slash administrative costs and encourage multinationals to base regional inventory pools in the Emirates. Rapid warehouse take-up is keeping rental levels firm, incentivizing new large-box and automated build-outs.
Etihad Rail Phase 2 and Future GCC Rail Integration
Phase 2 connects Shah to Fujairah Port, offering shippers a 30-40% cost saving over road and cutting Riyadh transit to four hours once the Saudi link goes live. Newly imposed truck-weight limits on federal roads reinforce rail’s cost competitiveness, steering bulk and container flows toward the steel-wheel network[2]“UAE Climate Law,” Government of the UAE, Government.ae. Dedicated terminals at industrial parks support oil, gas and construction commodities, while customs harmonization promises friction-less cross-border clearance. Planned extensions into Oman’s Sohar Port will ease sea-to-rail transfers, strengthening the Emirates’ role as multimodal bridge for 55 million GCC consumers. The network’s carbon advantage also helps operators meet mandatory emission reporting, making rail an environmental compliance hedge[3]“Heavy vehicle regulations on federal roads,” UAE Ministry of Infrastructure Development, Moid.gov.ae.
Restraints Impact Analysis*
| Restraint | (~) % Impact on CAGR Forecast | Geographic Relevance | Impact Timeline |
|---|---|---|---|
| High fuel and trucking operating costs | -1.2% | Nationwide, sharper in North | Short term (≤ 2 years) |
| Import-dependence exposes supply chains to shocks | -0.8% | Major ports and free zones | Medium term (2-4 years) |
| Shortage of advanced logistics and cold-chain talent | -0.6% | Dubai and Abu Dhabi | Medium term (2-4 years) |
| Strait-of-Hormuz geopolitical risk premium | -0.5% | Energy corridors | Long term (≥ 4 years) |
| Source: Mordor Intelligence | |||
High Fuel and Trucking Operating Costs
Fuel price swings lifted trucking outlays by up to 20% in 2024 and tighter Euro 6 norms demand costly fleet upgrades. New axle-load rules force operators to deploy more vehicles for the same tonnage, inflating per-kilometer costs. The Federal Climate Law’s emission-reporting clause, effective May 2025, requires telematics and auditing systems that can run USD 50,000-200,000 for a mid-size carrier. Driver wages rose double-digits amid regional competition, and extended licensing curricula add further compliance spend. Together, these items compress margins and could slow small-fleet renewal, especially outside the main emirates.
Import-Dependence Exposes Supply Chains to Shocks
The Emirates rely on imports for 85% of food and 70% of consumer goods; Red Sea delays in 2024 added 7-10 days to lead times and pushed freight rates up to 25%[4]“Federal Medical Products Law 2024,” UAE Ministry of Health and Prevention, Mohap.gov.ae. Insurance premiums spike whenever Strait-of-Hormuz tensions rise, thereby raising landed costs for energy-linked cargo. Concentrated sourcing from Asia leaves inventories vulnerable to factory outages or export bans, and currency shifts against the USD-pegged dirham alter procurement budgets overnight. Limited petroleum reserves (42 days coverage) accentuate exposure to sustained disruption, obliging firms to hold larger safety stocks that inflate working capital and warehouse demand.
*Our forecasts treat driver/restraint impacts as directional, not additive. The impact forecasts reflect baseline growth, mix effects, and variable interactions.
Segment Analysis
By End User Industry: Manufacturing Commands the Freight Wallet
Manufacturing consumed 25.78% revenue share of the total value in 2025, propelled by ADNOC’s USD 24.5 billion local content program and free-zone based metal fabrication. Complex inbound flows for raw materials and outbound distribution of finished goods demand multimodal orchestration, making manufacturers cornerstone accounts for 3PLs. Wholesale and retail trade is the fastest-growing vertical at 7.05% CAGR (2026-2031), fueled by population growth and digital marketplace penetration. Construction, energized by giga-projects and housing schemes, sustains heavy-lift and project cargo niches. Oil and gas, mining, and quarrying continue to procure specialized tubing, rigs, and chemicals via dedicated corridors, although proportionally slower as diversification policies take hold.
Agriculture and fisheries still account for a small slice, yet new food-security strategies and vertical farming pilots are injecting higher-value refrigerated moves. The rise of renewable-energy assemblies and electric-vehicle components further diversifies cargo composition. Collectively, these shifts ensure the United Arab Emirates freight and logistics market maintains balanced exposure across cyclical and defensive sectors, cushioning operators against demand swings in any single industry.


By Logistics Function: Freight Transport Remains the Anchor
Freight transport recorded 53.35% revenue share in 2025, underscoring its stand-alone heft within the United Arab Emirates freight and logistics market. Continued FDI inflows into petrochemicals, metals, and fast-moving consumer goods keep bulk and containerized volumes robust. Intermodal offerings that stitch together truck, rail, and barge legs are gaining favor as shippers chase carbon reduction along with cost savings. Courier, express, and parcel revenue is climbing faster at 7.52% CAGR (2026-2031) thanks to e-commerce surges and same-day delivery promises. Operators are bundling express and freight forwarding to maximize fleet utilization, while warehousing arms monetize inventory financing via bonded storage. Customs brokerage, duty drawback, and supply-chain finance round out ancillary services that command premium margins. From 2025 onward, emissions-reporting mandates will encourage load consolidation and digital visibility, thereby widening the performance gap between integrated and fragmentary players.
The express boom is prompting facility redesigns that merge high-speed sortation with cross-dock freight transport, compressing order-to-delivery windows. Warehouse developers are adding mezzanine pick towers and temperature-controlled chambers, positioning for pharmaceuticals and online grocery. In turn, trucking fleets are investing in dual-fuel tractors to hedge diesel volatility. Overall, the segment landscape illustrates how the United Arab Emirates freight and logistics market is shifting from asset-heavy point solutions toward platform-enabled ecosystems that monetize data, scale and sustainability compliance.
By Courier, Express, and Parcel (CEP): Domestic Scale, Cross-Border Upside
Domestic CEP flows represented a revenue share of 64.72% in 2025, leveraging dense metro geographies and digital-payment penetration to deliver within hours. International parcels will advance at 7.85% CAGR (2026-2031) as free-zone exporters tap duty-free agreements and simplified GCC customs to reach 55 million regional consumers. DHL’s pledge to invest USD 570 million regionally and FedEx’s automated World Central hub illustrate the capital pouring into air-express infrastructure. Local champion Aramex, freshly acquired by Q Logistics, is integrating regional ground networks with cross-border e-commerce APIs to protect its share amid rising global competition.
Government postal operator Emirates Post has repositioned through partnerships with free zones to address SME needs for document and sample deliveries. Going forward, CEP firms will refine micro-fulfillment nodes and locker networks that lower failed-delivery rates, solidifying their role as the consumer-facing edge of the United Arab Emirates freight and logistics market.
By Warehousing and Storage: Cold-Chain Gains Momentum
Non-temperature stock accounted for 89.60% of revenue share in 2025, housing fast-moving consumer goods, apparel, and project materials. Temperature-controlled footprints, though smaller, will log a 7.60% CAGR (2026-2031) as perishable food imports expand and biologics trade intensifies. The Federal Medical Products Law obliges pharma players to secure Good Distribution Practice-certified space, spurring retrofit and green-field cold stores.
Developers now incorporate sub-zero chambers and multi-level shuttle systems from day one, optimizing cubic utilization and energy efficiency. Solar-electric integration and thermal insulation standards help operators navigate the 2025 emissions-reporting regime. As urban land tightens, vertical span and automation will matter more than plot size, reshaping how the United Arab Emirates freight and logistics market warehouses high-value, temperature-sensitive cargo.
By Freight Transport Mode: Air Value Leads, Sea Volume Accelerates
Air freight contributed 46.62% of market revenue in 2025, reflecting the Emirates’ status as a global re-export hub served by Emirates SkyCargo’s 140-destination network. Tight capacity management and specialized cool-chain chambers capture pharmaceutical and high-tech yields. Sea and inland waterways, however, will post the fastest tonnage growth at 8.55% CAGR between 2026-2031 as Jebel Ali’s 100 million TEU capacity intersects with new inland rail drayage. Road remains vital for final-mile coverage, but stricter weight rules and congestion fees encourage modal shift for inter-emirate hauls over 200 kilometers. The nascent rail freight offer will open bulk and container corridors linking western oil fields to eastern seaports, trimming highway wear and greenhouse gases.
Inland waterway pilots in Dubai Water Canal illustrate the government’s intent to enable low-emission urban freight, while pipeline investments backstop liquid bulk security. Together, these multimodal investments raise the competitiveness of the United Arab Emirates' freight and logistics market against rival hubs and help meet federal net-zero ambitions.
By Freight Forwarding Mode: Air-Dominant, Sea-Driven Growth
Air freight forwarding yielded 44.33% of forwarding revenue in 2025, bolstered by factory-to-market lead-time needs for electronics and fast fashion. Sea forwarding will outpace at 8.12% CAGR (2026-2031) as capacity additions and digitized paperwork widen the appeal of Jebel Ali and Fujairah gateways. Digital platforms now furnish instant quotes and real-time container tracking, cutting administrative friction and enabling SMEs to bypass traditional brokerage queues. Road and emerging rail forwarding solutions complement door-to-door offerings, enhancing service stickiness.
Multimodal bundles that blend sea-air or rail-sea promise competitive transit times at lower carbon intensity, an increasingly salient selling point in shipper RFPs. Consequently, forwarding margins will hinge on data transparency, regulatory fluency, and network breadth within the United Arab Emirates freight and logistics market.
Geography Analysis
Dubai and Abu Dhabi jointly housed 52% of the population and generated more than 70% of retail sales in 2024, concentrating parcel densities that make rapid delivery economically viable. Dubai International Airport retained top global ranking for international tonnage, while Jebel Ali’s mega-terminal buffered rerouted Asia-Europe trade. Amazon’s upcoming 175,000 m² Abu Dhabi site will reinforce the emirate’s stature as the fastest-growing e-commerce node.
Northern Emirates each foster distinct logistics niches. Sharjah International Airport offers an uncongested cargo gateway that attracts small-package and relief cargo. Fujairah Port, lying outside the Strait of Hormuz, secures energy and bulk trades that require geopolitical redundancy. Ras Al Khaimah’s RAKEZ free zone hosts 25,000 companies whose logistics needs are now served through an Emirates Post alliance that wraps licensing, storage, and delivery in one bundle.
Etihad Rail’s west-east spine stitches Al Ghuweifat on the Saudi border to Fujairah Port, reducing trucking costs by up to 40% and forging a land bridge that shields cargo from Hormuz risk. Planned branch lines to Oman will channel Sohar Port throughput into UAE distribution centers, broadening hinterland capture for the United Arab Emirates freight and logistics market. Geographic diversification also mitigates capacity shocks, enabling operators to reroute via multiple emirates or modes when disruptions strike.
Competitive Landscape
The landscape exhibits fragmentation: global integrators, Gulf-based champions, and scores of specialized SMEs vie for a share. DSV capped its EUR 14.3 billion (USD 15.78 billion) takeover of DB Schenker in May 2025, instantly boosting Middle East capacity and network density. Q Logistics’ acquisition of Aramex folds a major regional parcel carrier into an Abu Dhabi-backed conglomerate, intensifying scale dynamics. UPS secured a strategic foothold in Dubai South to anchor automated last-mile services at a USD 100 million price tag.
Technology remains the competitive fault line. Emirates-grown AI houses partner with logistics players to harness predictive demand, optimize routes, and manage carbon baselines. Warehouse automation suppliers report surging demand for shuttle-based storage and robotic picking, accelerating speed-to-customer and lowering labor intensity. Cold-chain specialists leverage pharmaceutical certifications and halal auditing to win business in regulatory-heavy verticals.
White-space opportunities persist in renewable-energy project cargo, advanced pharmaceutical logistics, and GCC cross-border e-commerce fulfillment. Federal Competition Law 36 of 2023 provides an antitrust backstop, requiring clearance for deals that could impair market contestability, thereby balancing consolidation with innovation.
United Arab Emirates Freight And Logistics Industry Leaders
DP World
DSV A/S (including DB Schenker)
DHL Group
Aramex
Kuehne+Nagel
- *Disclaimer: Major Players sorted in no particular order

Recent Industry Developments
- July 2025: ADQ completed a majority acquisition of Aramex, strengthening regional consolidation and potentially altering slot allocations for cross-border parcels.
- April 2025: DSV finalized its EUR 14.3 billion (USD 15.78 billion) purchase of DB Schenker, expanding multimodal coverage across the Emirates.
- March 2025: UPS and Dubai South unveiled a USD 100 million logistics district featuring automated sortation and regional distribution infrastructure.
- July 2024: Aldar Properties and DP World agreed to co-develop a 1.55 million ft² logistics park in Jebel Ali to serve regional supply chains.


United Arab Emirates Freight And Logistics Market Report Scope
Agriculture, Fishing, and Forestry, Construction, Manufacturing, Oil and Gas, Mining and Quarrying, Wholesale and Retail Trade, Others are covered as segments by End User Industry. Courier, Express, and Parcel (CEP), Freight Forwarding, Freight Transport, Warehousing and Storage are covered as segments by Logistics Function.End User Industry
| Agriculture, Fishing, and Forestry |
| Construction |
| Manufacturing |
| Oil and Gas, Mining and Quarrying |
| Wholesale and Retail Trade |
| Others |
By Logistics Function
| Courier, Express, and Parcel (CEP) | By Destination Type | Domestic |
| International | ||
| Freight Forwarding | By Mode of Transport | Air |
| Sea and Inland Waterways | ||
| Others | ||
| Freight Transport | By Mode of Transport | Air |
| Pipelines | ||
| Road | ||
| Sea and Inland Waterways | ||
| Warehousing and Storage | By Temperature Control | Non-Temperature-Controlled |
| Temperature-Controlled | ||
| Other Services | ||
| End User Industry | Agriculture, Fishing, and Forestry | ||
| Construction | |||
| Manufacturing | |||
| Oil and Gas, Mining and Quarrying | |||
| Wholesale and Retail Trade | |||
| Others | |||
| By Logistics Function | Courier, Express, and Parcel (CEP) | By Destination Type | Domestic |
| International | |||
| Freight Forwarding | By Mode of Transport | Air | |
| Sea and Inland Waterways | |||
| Others | |||
| Freight Transport | By Mode of Transport | Air | |
| Pipelines | |||
| Road | |||
| Sea and Inland Waterways | |||
| Warehousing and Storage | By Temperature Control | Non-Temperature-Controlled | |
| Temperature-Controlled | |||
| Other Services | |||


Market Definition
- Agriculture, Fishing, and Forestry (AFF) - This end user industry segment captures the external (outsourced) logistics expenditure incurred by the AFF industry players. The end user players considered are the establishments primarily engaged in growing crops, raising animals, harvesting timber, harvesting fish & other animals from their natural habitats and providing related support activities. Herein, Logistics Service Providers (LSPs) play a crucial role in acquisition, storage, handling, transportation, and distribution activities for the optimal & continuous flow of inputs (seeds, pesticides, fertilizers, equipment, and water) from manufacturers or suppliers to the producers and smooth flow of output (produce, agro-goods) to distributors/ consumers. This includes both termperature controlled and non-temperature controlled logistics, as and when required according to the shelf life of goods being transported or stored.
- Construction - This end user industry segment captures the external (outsourced) logistics expenditure incurred by the construction industry players. The end user players considered are the establishments primarily engaged in constructing, repairing and renovating residential & commercial buildings, infrastructure, engineering works, subdividing and developing land. Logistics Service Providers (LSPs) play a crucial role in increasing profitability of construction projects by maintaing the inventory of raw materials & equipment, time-critical supplies and by providing other value added services for effective project management.
- Courier, Express, and Parcel - The Courier, Express, and Parcel services, often called as CEP Market, refers to the logistics and postal service providers which specialize in moving small goods (parcels/packages). It captures the overall market size (USD) and market volume (number of parcels) of (1) the shipments/parcels/packages which are under 70kgs/ 154lbs weight, (2) Business Customer packages viz. Business-to-Business (B2B) & Business-to-Consumer (B2C) as well as private customer packages (C2C), (3) non-express parcel delivery services (Standard and Deferred) as well as express parcel delivery services (Day-Definite-Express and Time-Definite-Express), (4) domestic as well as international parcels.
- Demographics - To analyse total addressable market demand, population growth & forecasts have been studied and presented in this industry trend. It represents population distribution across categories like gender (male/female), development area (urban/rural), major cities among other key parameters like population density and final consumption expenditure (growth and share % of GDP). This data has been used for assessing the fluctations in demand & consumption expenditure, and the major hotspots (cities) of potential demand.
- Export Trends and Import Trends - Overall logistics performance of an economy is positively and significantly (statistically) correlated to its trade performance (exports and imports). Hence, in this industry trend, total value of trade, major commodities/ commodity groups and the major trade partners, for the studied geography (country or region as per the scope of report) have been analysed alongside the impact of major trade/logistics infrastructure investments & regulatory environment.
- Freight Forwarding - Freight forwarding which herein refers to the freight transportation arrangement (FTA) industry includes establishments primarily engaged in arranging & tracking transportation of freight between shippers and carriers. Logistics Service Providers (LSPs) considered are freight forwarders, NVOCCs, custom brokers and marine shipping agents. Others segment under Freight Forwarding captures the revenue earned through value added services of FTA like custom brokerage/clearance activities, preparation of freight related documentation, consolidation-deconsolidation of goods, cargo insurance & compliance, arrangement of warehousing & storage, liasing with shippers, and freight forwarding through other modes of transport viz. road and rail.
- Freight Pricing Trends - Freight pricing by mode of transport (USD/tonkm), over the review period, has been presented in this industry trend. The data has been used in assessing the inflationary environment, impact on trade, freight turnover (tonkm), freight and logistics market demand by mode of transport segments and hence the overall freight and logistics market size.
- Freight Tonnage Trends - Freight tonnage (weight of goods in tons) handled by mode of transport, over the review period, has been presented in this industry trend. The data has been used as one of the parameters apart from average distance per shipment (km), freight volume (tonkm), and freight pricing (USD/tonkm) to assess the freight transport market size.
- Freight Transport - Freight Transport refers to the hiring of a logistics service provider (outsourced logistics) for the transport of commodities (raw materials/final/intermediate/finished goods including both solids and fluids) from the origin to a destination within the country (domestic) or cross-border (international).
- Freight and Logistics - External expenditure on (or outsourced) facilitation of freight transport (freight transportation), arrangement of freight transport through an agent (freight forwarding), warehousing and storage (temperature controlled or non-temperature controlled), CEP (domestic or international courier, express and parcel) and other value-added logistics services involved in the transportation of commodities (raw materials or finished goods including both solids and fluids) from the origin to a destination within the country (domestic) or cross-border (international), through one or more modes of transportation viz. road, rail, sea, air and pipelines constitute freight and logistics market.
- Fuel Price - Fuel price spikes can cause delays and diruption for logistics service providers (LSPs), while drops in the same can result in higher short-term profitability and increased market rivalry to offer consumers with the best deals. Hence, the fuel price variations have been studied over the review period and presented along with the causes as well as market impacts.
- GDP Distribution by Economic Activity - Nominal Gross Domestic Product and distribution of the same, across major economic sectors in the geography studied (country or region as per scope of the report) have been studied and presented in this industry trend. As GDP is positively related to the profitability and growth of logistics industry, this data has been used in adjunction to the input-output tables/ supply-use tables for analyzing the potential major contributing sectors towards the logistics demand.
- GDP Growth by Economic Activity - Growth of Nominal Gross Domestic Product across major economic sectors, for the geography studied (country or region as per scope of the report) have been presented in this industry trend. This data has been utilized for assessing the growth of logistics demand from all the market end users (economic sectors considered here).
- Inflation - Variations in both Wholesale Price Inflation (YoY change in producer price index) and Consumer Price Inflation have been presented in this industry trend. This data has been used to assess the inflationary environment as it plays a vital role in smooth functioning of the supply chain, directly impacting the logistics operational cost components e.g., pricing of tyres, driver wages & benefits, energy/fuel prices, maintenace costs, toll charges, warehousing rents, custom brokerage, forwarding rates, courier rates etc. hence impacting the overall freight and logistics market.
- Infrastructure - As infrastructure plays a vital role in an economy's logistics performance, variables like length of roads, distribution of road length by surface category (paved v/s unpaved), distribution of road length by road classification (expressways v/s highways v/s other roads), rail length, volume of containers handled by major ports and tonnage handled by major airports have been analysed and presented in this industry trend.
- Key Industry Trends - The report section named "Key Industry Trends" include all the key variables/parameters studied to better analyze the market size estimates and forecasts. All the trends have been presented in the form of data points (time series or latest available data points) along with analysis of the paramter in the form of concise market relevant commentary, for the geography studied (country or region as per the scope of report).
- Key Strategic Moves - The action taken by a company to differentiate from its competitor or used as a general strategy is referred to as a key strategic move (KSM). This includes (1) Agreements (2) Expansions (3) Financial Restructuring (4) Mergers and Acquisitions (5) Partnerships, and (6) Product Innovations. Key players (Logistics Service Providers, LSPs) in the market have been shortlisted, their KSM have been studied and presented in this section.
- Liner Shipping Bilateral Connectivity Index - It indicates a country pair's integration level into global liner shipping networks and plays a crucial role in determining bilateral trade, which in turn potentially contributes toward the prosperity of a country and its surrounding region. Hence the major economies connected to the country/ region as per scope of the report, have been analyzed and presented in "Liner Shipping Connectivity" industry trend.
- Liner Shipping Connectivity - This industry trend analyses the state of connectivity to the global shipping networks based on the status of maritime transport sector. It includes the analysis of liner shipping connectivity, bilateral shipping connectivity, and port liner shipping connectivity indices for the geography (country/ region as per scope of the report) over the review period.
- Liner Shipping Connectivity Index - It indicates how well countries are connected to global shipping networks based on the status of their maritime transport sector. It is based on five components of the maritime transport sector: (1) The number of shipping lines servicing a country, (2) The size of the largest vessel used on these services (in TEUs), (3) The number of services connecting a country to the other countries, (4) The total number of vessels deployed in a country, (5) The total capacity of those vessels (in TEUs).
- Logistics Performance - Logistics Performance and Logistics Costs are the backbone of trade, and influences trade costs, making countries compete globally. Logistics performance is influenced by market wide adopted supply chain management strategies, government services, investments & policies, fuel/ energy costs, inflationary environment etc. Hence, in this industry trend, the logistics performance of the geography studied (country/ region as per the scope of report) has been analysed and presented over the review period.
- Major Truck Suppliers - Market share of truck brands is influenced by factors like geographical preferences, portfolio of truck types, truck prices, local production, truck repair & maintenance service peneteration, customer support, technological innovations (like electric vehicles, digitalization, autonomous trucks), fuel efficiency, financing options, annual maintenance costs, availability of substitutes, marketing startegies etc. Hence, the distribution (share % for base year of the study) of truck sales volume for leading truck brands and commentary on current market scenario & market anticipation over the forecast period have been presented in this industry trend.
- Manufacturing - This end user industry segment captures the external (outsourced) logistics expenditure incurred by the Manufacturing industry players. The end user players considered are the establishments primarily engaged in the chemical, mechanical or physical transformation of materials or substances into new products. Logistics Service Providers (LSPs) play a crucial role in maintaining a smooth flow of raw materials across the supply chain, enabling timely delivery of finished goods to distributors or end customers and storing & supplying the raw materials to clients for just-in-time manufacturing.
- Maritime Fleet Load Carrying Capacity - Maritime fleet load carrying capacity depicts the development state of an economy's maritime infrastructure & trade. It is influenced by factors like volume of production, international trade, major end user industries, maritime connectivity, environmental regulations, investments in port infrastructure development, port container cargo handling capacity etc. This industry trend represents the maritime fleet load carrying capacity by type of ship viz. container ships, oil tankers, bulk carriers, general cargo, among other types alongwith the influencing factors for the geography studied (country/ region as per scope of the report), over the review period.
- Modal Share - Freight Modal Share is influenced by factors like modal productivity, government regulations, containerization, distance of shipment, temperature control requirements, type of goods, international trade, terrain, speed of delivery, shipment weight, bulk shipments, etc. Also, modal share by tonnage (tons) and modal share by freight turnover (ton-km) differ as per average distance of shipments, weight of major commodity groups transported in the economy and number of trips. This industry trend represents the distribution of freight transported by mode of transport (tons as well as ton-km), for the study base year.
- Oil and Gas, Mining and Quarrying - This end user industry segment captures the external (outsourced) logistics expenditure incurred by the extraction industry players. The end user players considered are the establishments that extract naturally occurring mineral solids, such as coal and ores; liquid minerals, such as crude petroleum; and gases, such as natural gas. Logistics Service Providers (LSPs) covers entire phases from upstream to downstream and plays a crucial role in the transportation of machinery, drilling equipments, extracted minerals, crude oil & natural gas and refined/ processed products from one place to another.
- Other End Users - Other end user segment captures the external (outsourced) logistics expenditure incurred by the financial services (BFSI), real estate, educational services, healthcare, and professional services (administrative, waste management, legal, architectural, engineering, design, consulting, scientific R&D). Logistics Service Providers (LSPs) plays a crucial role in the reliable movement of supplies and documents to/from these industries such as transporting any equipment or resources required, shipping confidential documents and files, movement of medical goods & supplies (surgical supplies and instruments, including gloves, masks, syringes, equipment) to name a few.
- Other Services - Other Services segment captures revenue earned through (1) Value added services (VAS) for freight transportation by road, rail, air and sea & inland waterways, (2) VAS for marine cargo transportation (operation of terminal facilities such as harbours and piers, operation of waterway locks, navigation, pilotage and berthing activities, lighterage, salvage activities, lighthouse activities, among other miscellaneous support activities), (3) VAS for land freight transportation (operation of terminal facilities such as railway stations, stations for the handling of goods, operation of railroad infrastructure, switching and shunting, towing and road side assistance, liquefaction of gas for transportation purposes, among other miscellaneous support activities), (4) VAS for air cargo transportation (operation of terminal facilities such as airway terminals, airport and air-traffic-control activities, ground service activities on airfields, runway maintenance, inspection/ ferrying/ maintenance/ testing of aircrafts, aircraft fuelling services, among other miscellaneous support activities), (5) VAS for warehousing and storage service (operation of grain silos, general merchandise warehouses, refrigerated warehouses, storage tanks etc., storage of goods in foreign trade zones, blast freezing, crating goods for shipping, packing and preparing goods for shipping, labelling and/or imprinting the package, kit assembling and packaging services, among other miscellaneous support activities), and (6) VAS for courier, express and parcel service (pickup, sorting).
- Port Calls and Performance - The performance of ports is key to an economy's freight movement, trade, global connectivity, successful growth strategies, investment attractiveness for production & distribution systems, and thus affects GDP, employment, per capita income and industrial growth. Hence, the port perfomance parameters like median time spent by vessels in the ports; average age, size, cargo carrying capacity, container carrying capacity, of vessels entering the ports, port calls, and container port throughput have been analysed and presented in this industry trend.
- Port Liner Shipping Connectivity Index - It reflects a port's position in the global liner shipping network, wherein a higher value of index is associated with better connectivity. Efficient and well-connected ports (1) contribute towards minimizing transport costs, linking supply chains and supporting international trade, (2) pave the way for economies of scale and development of expertise by permitting producers to better exploit possibilities in domestic as well as foreign markets. Hence the major ports of strategic importance, in the country/ region as per scope of the report, have been analyzed and presented in "Liner Shipping Connectivity" industry trend.
- Port Throughput - It reflects the amount of cargo or number of vessels a port handles annually. It can be related to (1) cargo tonnage, (2) container TEU, and (3) vessel calls. Port throughput in terms of total containers handled (TEU's), has been presented in the "Port Calls and Performance" industry trend.
- Producer Price Inflation - It indicates inflation from viewpoint of the producers viz. the average selling price received for their output over a period of time. Annual change (YoY) of producer price index is reported as wholesale price inflation in the "Inflation" industry trend. As WPI captures dynamic price movements in most comprehensive way, it is widely used by governments, banks, industry, business circles and is deemed important in formulation of trade, fiscal and other economic policies. The data has been used in adjunction to consumer price inflation for better understanding the inflationary environment.
- Segmental Revenue - Segmental Revenue has been triangulated or computed and presented for all the major players in the market. It refers to the freight and logistics market specific revenue earned by the company, over the base year of study, in the geography studied (country or region as per the scope of report). It is computed through the study and analysis of major parameters like financials, service portfolio, employee strength, fleet size, investments, number of countries present in, major economies of concern, etc. that have been reported by the company in its annual reports, webpage. For companies having scarce financial disclosures, paid databases like D&B Hoovers, Dow Jones Factiva have been resorted to and verified through industry/expert interactions.
- Transport and Storage Sector GDP - Value and growth of Transport and Storage Sector GDP has a direct relation to the freight and logistics market size. Hence, this variable has been studied and presented over the review period, in value terms (USD) and as share % of total GDP, in this industry trend. The data has been supported by concise and relevant commentary around the investments, developments, and current market scenario.
- Trends in E-Commerce Industry - Enhanced internet connectivity and boom in smartphone penetration, coupled with increasing disposable incomes, has led to a phenomenal growth in the e-commerce market globally. Online shoppers require fast and efficient delivery of their orders leading to an increase in the demand for logistics services especially e-commerce fulfilment services. Hence, the Gross Merchandise Value (GMV), historial and projected growth, breakup of major commodity groups in e-commerce industry for the studied geography (country or region as per scope of the report) have been analysed and presented in this industry trend.
- Trends in Manufacturing Industry - Manufacturing industry involves the transformation of raw materials into finished products, while logistics industry ensures the efficient flow of raw materials to the factory, and the transport of manufactured products to the distributors & consumers. Demand-Supply of both industries are highly cross-linked and critical for a seamless supply chain. Hence, the Gross Value Added (GVA), breakup of GVA into major manufacturing sectors, and growth of manufacturing industry over the review period have been analysed and presented, in this industry trend.
- Trucking Fleet Size By Type - Market share of truck types is influenced by factors like geographical preferences, major end user industries, truck prices, local production, truck repair & maintenance service peneteration, customer support, technological disruptions (like electric vehicles, digitalization, autonomous trucks) etc. Hence, the distribution (share % for base year of study) of truck parc volume by type of truck, market disruptors, truck manufacturing investments, truck specifications, truck use & import regulations, and market anticipation over the forecast period have been presented in this industry trend.
- Trucking Operational Costs - The prime reasons for measuring/ benchmarking logistics performance of any trucking company are to reduce operational costs and increase profitability. On the other hand, measuring operational costs helps to identify whether and where to make operational changes to control expenses and identify areas for improved performance. Hence, in this industry trend, trucking operational costs and the variables involved viz. driver wages & benefits, fuel prices, repairs & maintenance costs, tyre costs etc. have been studied over the base year of study, and presented for the geography studied (country or region as per the scope of report).
- Warehousing and Storage - Warehousing and storage segment captures revenue earned through the operation of general merchandise, refrigerated and other types of warehousing & storage facilities. These establishments take responsibility for storing the goods and keeping them secure in lieu of charges. Value added services (VAS) they may provide are considered to be a part of the "other services" segment. Here VAS refer to a range of services, related to the distribution of a customer's goods and can include labelling, breaking bulk, inventory control & management, light assembly, order entry & fulfillment, packaging, pick & pack, price marking & ticketing and transportation arrangement.
- Wholesale and Retail Trade - This end user industry segment captures the external (outsourced) logistics expenditure incurred by the wholesalers and retailers. The end user players considered are the establishments primarily engaged in wholesaling or retailing merchandise, generally without transformation, and rendering services incidental to the sale of merchandise. Logistics Service Providers (LSPs) plays a crucial role in the reliable movement of supplies to and finished products from production houses to the distributors and finally to the end customer covering activites like material sourcing, transportation, order fulfillment, warehousing & storage, demand forecasting, inventory management etc.
| Keyword | Definition |
|---|---|
| Axle Load | The axle load of a wheeled vehicle is the total weight bearing on the roadway for all wheels connected to a given axle. |
| Back Haul | Backhaul is the return movement of a transport vehicle from its original destination to its original point of departure. |
| Bill of Lading | A bill of lading is a legal document issued by a carrier to a shipper that details the type, quantity, and destination of the goods being carried. |
| Bunkering | Bunkering is the process of supplying fuel and/or gasoil to be used to power the propulsion system of a ship (such fuel is referred to as bunker). It includes the logistics of loading and distributing the fuel among available shipboard tanks. A person dealing in trade of bunker (fuel) is called a bunker trader. |
| Bunkering Service | Bunkering service is the supply of a requested quality and quantity of bunkers to a ship. |
| C-commerce | C-commerce (Collaborative commerce) describes electronically enabled business interactions among an enterprise’s internal personnel, business partners and customers throughout a trading community. The trading community could be an industry, industry segment, supply chain or supply chain segment. |
| Cabotage | Transport by a vehicle registered in a country performed on the national territory of another country. |
| Cartage Agent | A ground transportation service that provides pickup and delivery of freight in locations not served directly by an air or ocean carrier. |
| Contract logistics | Contract logistics refers to the outsourcing of resource management tasks by one company to a third-party company specializing in logistical matters, such as transportation, warehousing, and order fulfillment. |
| Courier | A business that is used to send messages, packages, etc. Courier service refers to the fast or quick, door to door pickup and delivery service for goods or documents. It can be local or international. A company that provides such delivery services is called a courier company. A courier company hires people to provide their services. Such a person hired by the courier service company is called a courier. |
| Cross docking | Cross docking is a practice in logistics management that includes unloading incoming delivery vehicles and loading the materials directly into outbound delivery vehicles, omitting traditional warehouse logistical practices and saving time and money. |
| Cross Trade | International transport between two different countries performed by a vehicle registered in a third country. A third country is a country other than the country of loading/embarkation and than the country of unloading/disembarkation. |
| Customs Clearance | The procedures involved in getting cargo released by Customs through designated formalities such as presenting import license/permit, payment of import duties and other required documentations by the nature of the cargo such as FCC or FDA approval. |
| Customs seal | Customs seal means a seal, stamp or any other preventive means affixed by customs officials to ensure the inviolability of goods, commercial means of transport or warehouses. |
| Dangerous Goods | Dangerous goods (or hazardous materials or HAZMAT) include flammable liquids/solids, gases, compressed, liquified, dissolved under pressure, corrosives, oxidising substances, explosive substances and articles, substances, which on contact with water, emit flammable gasses, organic peroxides, toxic substances, infectious substances, radioactive materials, miscellaneous dangerous goods and articles. |
| Direct Shipment | Direct shipment is a method of delivering goods from the supplier or the product owner to the customer directly. In most cases, the customer orders the goods from the product owner. This delivery scheme reduces transportation and storage costs, but requires additional planning and administration. |
| Drayage | A drayage is a form of trucking service that connects the different modes of shipping (intermodal), such as ocean freight or air freight. It’s a short-haul trip that transports goods from one place to another, usually before or after its long-haul shipping process. Drayage trucks move cargo to and from various destinations, such as container ships, storage lots, order fulfillment warehouses, and rail yards. Typically, drayage only transports goods in short distances and operates only in one metropolitan area. It also requires only one trucker in a single shift. |
| Dry Docking | Dry docking is a term used for repairs or when a ship is taken to the service yard. During dry docking, the whole ship is brought to a dry land so that the submerged portions of the hull can be cleaned or inspected. |
| Dry van | A dry van is a type of semi-trailer that's fully enclosed to protect shipments from outside elements. Designed to carry palletized, boxed or loose freight, dry vans aren't temperature-controlled (unlike refrigerated “reefer” units) and can't carry oversized shipments (unlike flatbed trailers). |
| Feedering | Transport service whereby loaded or empty containers in a regional are transferred to a “mother ship” for a long-haul ocean voyage. |
| Final Demand | Final demand includes all types of commodities (goods as well as services) consumed as final use and might include personal consumption, or consumption by government, by businesses as capital investment, and as exports. includes all types of commodities (goods as well as services) consumed as final use and might include personal consumption, or consumption by government, by businesses as capital investment, and as exports. |
| First mile Delivery | First mile delivery refers to the first stage of the transportation. This is when the parcel leaves the seller’s warehouse and is taken by the courier pick up agent to process it or take it to the warehouse. Once the package reaches the post office or the courier’s hub, it is then sorted and transported further until it reaches the customer’s doorstep. |
| Fiscal storage services | It means a facility, clearly separated from other premises, where the excise goods are produced, processed, held, received or dispatched under a duty suspension arrangement by an authorized depositor, in the course of his business, under conditions laid down by the customs authorities. |
| Flat Bed | It has a back body that is flatly shaped for easy loading and unloading of goods. The flatbed truck is mostly used to transport heavy, oversized, wide and indelicate goods. |
| Flatbed Truck | A flatbed truck is a type of truck with rigid design. It has a back body that is flatly shaped for easy loading and unloading of goods. The flatbed truck is mostly used to transport heavy, oversized, wide and indelicate goods such as machinery, building supplies or equipment. Due to the truck open body, the goods transported with it must not be vulnerable to rain. By functionality, the flatbed truck is comparable to a flatbed trailer. |
| Freight Transit Time | Transit time is how long it takes for a shipment to be delivered to its final destination after being picked up from a designated pick up point. |
| Halal Logistics | It refers to the process of managing the logistics operations such as fleet management, storage/warehousing, and materials handling according to the principles of Shariah law in ensuring the integrity of the halal products at the point of consumption. |
| Haulage | The commercial transport of goods. |
| Inbound Logistics | Inbound logistics is the way materials and other goods are brought into a company. This process includes the steps to order, receive, store, transport and manage incoming supplies. Inbound logistics focuses on the supply part of the supply-demand equation. |
| Intermediate Demand | Intermediate demand includes goods, services, and maintenance and repair construction sold to businesses, excluding capital investment. |
| International Loaded | Place of loading of goods in reporting country (i.e., country in which the vehicle performing the transport is registered) and place of unloading in a different country. |
| International Unloaded | Place of unloading of goods in reporting country (i.e., country in which the vehicle performing the transport is registered) and place of loading in a different country. |
| Last Mile Delivery | Last mile delivery refers to the very last step of the delivery process when a parcel is moved from a transportation hub to its final destination—which, usually, is a personal residence or retail store. |
| Less than-Truck-Load (LTL) | Less-than-truckload, also known as less-than-load (LTL), is a shipping service for relatively small loads or quantities of freight. An LTL provider combines the loads and shipping requirements of several different companies on their trucks, using a hub-and-spoke system to get goods to their destinations. |
| Locomotives Haluage | The transport of coal, ore, workers, and materials underground by means of locomotive-hauled mine cars. The locomotive may be powered by battery, diesel, compressed air, trolley, or some combination such as battery-trolley or trolley-cable reel. |
| Milkrun | A Milk Run is a delivery method used to transport mixed loads from various suppliers to one customer. Instead of each supplier sending a truck every week to meet the needs of one customer, one truck (or vehicle) visits the suppliers to pick up the loads for that customer. This method of transport got its name from the dairy industry practice, where one tanker used to collect milk from several dairy farms for delivery to a milk processing company. |
| Multi country consolidation | Multi-Country Consolidation (MCC) is a cost-effective solution that consolidates ones cargo from different countries of origin to build Full Container Loads (FCL). MCC is most suitable for companies that import light volumes of goods from multiple countries but want to take advantage of the more economic FCL freight rates. |
| Multi-Modal Logistics | Multimodal transportation or multimodal shipping refers to logistics and freight processes that require multiple modes of transportation. |
| Omni Channel Logistics | Omnichannel distribution is a multichannel approach taken by companies to give customers a way to purchase and receive orders from several sales channels with one-touch seamless integration. Some of the ways include- 1. Buy online, then pick-up at the brick and mortar store; 2. Buy online, then have it delivered to the home or another location; 3.In store purchase, with the delivery either to the home or another location; 4. Drop ship from a warehouse or manufacturing center to store, home or other location; 5.Buy online, then return at store or online; 6. Buy online, then return online. |
| OOG cargo | Out of Gauge (OOG) cargo is any cargo that can not be loaded into six-sided shipping containers simply because it is too large. The term is a very loose classification of all cargo with dimensions beyond the maximum 40HC container dimensions. That is a length beyond 12.05 meters – a width beyond 2.33 meters – or a height beyond 2.59 meters. |
| Other ships | Other ships include: Liquefied petroleum gas carriers, liquefied natural gas carriers, parcel (chemical) tankers, specialized tankers, reefers, offshore supply vessels, tugboats, dredgers, cruise, ferries, other non-cargo ships |
| Other Specialised Cargo | Other specialised goods include pre-slung goods (Goods, one or more items, supplied with a sling or slings), mobile units (Mobile Self Propelled Units, Non Self Propelled Units, unrolled vehicles), oversized equipment load (light and heavy machinery that is often too big or too heavy), high value freight that needs extra protection like electronics, financial services road freight. |
| Outsourced Freight Transport | Transport for hire or reward; The carriage for remuneration of goods. |
| Pallets | Raised platform, intended to facilitate the lifting and stacking of goods. |
| Part load | A part load describes goods which only fills a truck partially. In essence, the quantity of the shipment is bigger than the Less Than Truckload (LTL) shipment. Also, the shipment cannot fully occupy a truck i.e. its capacity is much lower than a Full Truckload (FTL) shipment. |
| Paved Road | Road surfaced with crushed stone (macadam) with hydrocarbon binder or bituminized agents, with concrete or with cobblestone. |
| Q-commerce | Q-commerce, also referred to as quick commerce, is a type of e-commerce where emphasis is on quick deliveries, typically in less than an hour. |
| Quay | A stone or metal platform lying alongside or projecting into water for loading and unloading ships. |
| Recommerce | Recommerce is the selling of previously owned items through online marketplaces to buyers who reuse, recycle or resell them. |
| ReverseLogistics | Reverse logistics is a type of supply chain management that moves goods from customers back to the sellers or manufacturers. |
| Road Freight Transport Service | Hiring a trucking agency for transport of commodities (raw materials or manufactured goods including both solids and liquids) form the origin to a destination within the country (domestic) or cross-border (international) constitutes road freight transport market. The service might be Full-Truck-Load or Less than-Truck-Load, containerized or non-containerized, temperature controlled or non temperature controlled, short haul or long haul. |
| Roll-on/roll-off cargo | Roll-on/roll-off (RORO or ro-ro) ships are cargo ships designed to carry wheeled cargo, such as cars, motorcycles, trucks, semi-trailer trucks, buses, trailers, and railroad cars, that are driven on and off the ship on their own wheels or using a platform vehicle, such as a self-propelled modular transporter. |
| Swap bodies | A swap body, swop body, exchangeable container or interchangeable unit, is one of the types of standard freight containers for road and rail transport. |
| Tank Barge | A non-self-propelled vessel constructed or adapted primarily to carry liquid, solid or gaseous commodities or cargos in bulk in cargo spaces (or tanks) through rivers and inland waterways, and may occasionally carry commodities or cargos through oceans and seas when in transit from one inland waterway to another. The commodities or cargos transported are in direct contact with the tank interior. |
| Tautliner vehicle | Tautliner and curtainsider are used as generic names for curtain sided trucks/trailers. The curtains are permanently fixed to a runner at the top and detachable rails/poles at front and rear, allowing the curtains to be drawn open and forklifts used all along the sides for easy and efficient loading and unloading. When closed for travel, vertical load restraint straps are attached to a rope rail beneath the truck bed, connecting the truck bed and curtain along both sides. Winches at either end of the curtain tension it, hence the 'Tautliner' name. This stops the curtain from flapping or drumming in the wind and can also help retain light loads from slipping sideways. |
| Transloading | Transloading is a shipping term that refers to the transfer of goods from one mode of transportation to another en route to their ultimate destination. |
| Tsubo | A Japanese unit of area equal to 35.58 square feet. |
| Unpaved Road | Road with a stabilized base not surfaced with crushed stone, hydrocarbon binder or bituminized agents, concrete or cobblestone. |
| Vessel Husbandry Services | It includes ship maintenance, repairs, cleaning, upkeep of the hull and rigging and equipment. |


Research Methodology
Mordor Intelligence follows a four-step methodology in all our reports.
- Step-1: Identify Key Variables: In order to build a robust forecasting methodology, the variables and factors identified in Step-1 are tested against available historical market numbers. Through an iterative process, the variables required for market forecast are set and the model is built on the basis of these variables.
- Step-2: Build a Market Model: Market-size estimations for the forecast years are in nominal terms. Inflation is not a part of the pricing, and the average selling price (ASP) is kept constant throughout the forecast period for each country.
- Step-3: Validate and Finalize: In this important step, all market numbers, variables and analyst calls are validated through an extensive network of primary research experts from the market studied. The respondents are selected across levels and functions to generate a holistic picture of the market studied.
- Step-4: Research Outputs: Syndicated Reports, Custom Consulting Assignments, Databases & Subscription Platforms


