Integrated Workplace Management System (IWMS) Market Size and Share
Market Overview
| Study Period | 2020 - 2031 |
|---|---|
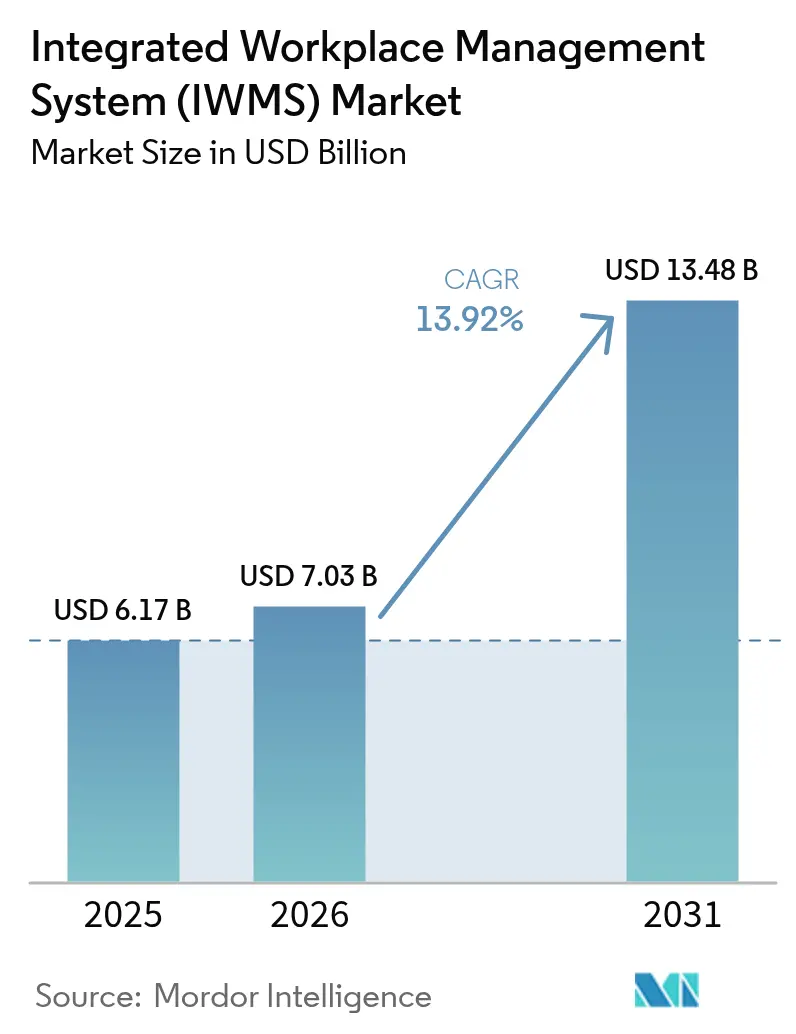
| Market Size (2026) | USD 7.03 Billion |
| Market Size (2031) | USD 13.48 Billion |
| Growth Rate (2026 - 2031) | 13.92% CAGR |
| Fastest Growing Market | Asia Pacific |
| Largest Market | North America |
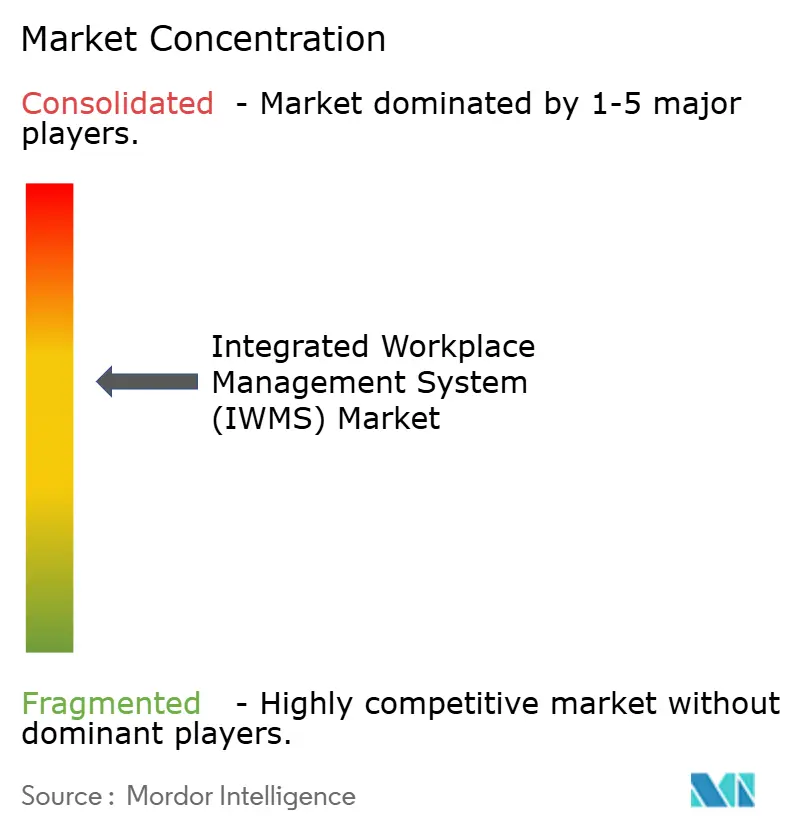
| Market Concentration | Medium |
Major Players *Disclaimer: Major Players sorted in no particular order Image © Mordor Intelligence. Reuse requires attribution under CC BY 4.0. | |
Integrated Workplace Management System (IWMS) Market Analysis by Mordor Intelligence
Integrated workplace management system market size in 2026 is estimated at USD 7.03 billion, growing from 2025 value of USD 6.17 billion with 2031 projections showing USD 13.48 billion, growing at 13.92% CAGR over 2026-2031. The acceleration reflects enterprises replacing disconnected facility tools with single platforms that centralize real estate, maintenance, and sustainability data. Remote and hybrid work, heightened ESG scrutiny, and the push for real-time operational visibility keep demand elevated. Cloud availability shortens deployment cycles, and subscription pricing lowers entry barriers for mid-market buyers. Vendors add AI to automate space planning, while regulators tighten energy reporting rules, turning compliance into a driver for integrated platforms. Cybersecurity and data sovereignty remain priorities, prompting hybrid architectures that balance control with scalability.
Key Report Takeaways
- By offering, facilities and space management captured 27.05% of the integrated workplace management system market share in 2025, while environmental sustainability management is set to grow at a 15.62% CAGR to 2031.
- By deployment mode, on-premise solutions held 50.70% of the integrated workplace management system market share in 2025; cloud deployment is projected to expand at a 17.11% CAGR through 2031.
- By organization size, large enterprises accounted for 66.80% of the integrated workplace management system market size in 2025, whereas SMEs are advancing at a 14.56% CAGR between 2026 and 2031.
- By end-use industry, information technology and telecommunications led with 24.10% revenue share in 2025; healthcare and life sciences is forecast to post the fastest 16.18% CAGR to 2031.
- By geography, North America dominated with 33.20% market share in 2025, while Asia-Pacific is expected to register the leading 15.44% CAGR through 2031.
Note: Market size and forecast figures in this report are generated using Mordor Intelligence’s proprietary estimation framework, updated with the latest available data and insights as of 2026.
Market Trends and Insights
Drivers Impact Analysis of Integrated Workplace Management System (IWMS) Market*
| Driver | (~) % Impact on CAGR Forecast | Geographic Relevance | Impact Timeline |
|---|---|---|---|
| Cloud-first IWMS adoption | +3.2% | Global, with North America and EU leading | Medium term (2-4 years) |
| Cost-out through space optimization | +2.8% | Global concentrated in high-rent urban markets | Short term (≤ 2 years) |
| Compliance with IFRS 16 and ESG mandates | +2.1% | Global with EU and North America pressure | Long term (≥ 4 years) |
| Post-pandemic hybrid work programs | +2.4% | Global advanced economies | Medium term (2-4 years) |
| CPIP shift to unify OT-IT-IoT data | +1.8% | North America and EU expanding to Asia-Pacific | Long term (≥ 4 years) |
| Workplace carbon-credit trading readiness | +1.4% | EU leading with North America and Asia-Pacific following | Long term (≥ 4 years) |
| Source: Mordor Intelligence | |||


Cloud-First IWMS Adoption
Enterprises now mandate cloud-native platforms to cut infrastructure spending and deploy in weeks rather than months. SAP recorded EUR 4.993 billion cloud revenue in Q1 2025, with cloud ERP rising 34% year over year, underscoring buyer confidence in subscription delivery models[2]SAP, “First Quarter 2025 Results,” investing.com. Integration with existing HR and finance systems improves data quality and speeds decision-making. Usage-based pricing broadens access for mid-sized firms that once found comprehensive suits unaffordable. Vendors also embed continuous updates that deliver new analytics features without customer downtime.
Cost-Out Through Space Optimization
Commercial property expenses can exceed 20% of operating costs, so occupancy analytics tools that reduce unused floorspace gain rapid traction. Cisco cut floor area by 25% at its PENN1 facility while improving energy efficiency by 36% through sensor-driven layout redesign. IWMS dashboards visualize real-time utilization, allowing timely consolidation or subletting decisions. In hybrid settings, dynamic seating assignments replace static desk ratios, keeping vacancies low even with variable attendance.
Compliance With IFRS 16 and ESG Mandates
IFRS 16 requires real-time lease accounting, while ESG regulations demand audited energy and emissions data. Singapore obliged listed companies to disclose Scope 1 and 2 emissions from 2024 and will extend Scope 3 reporting in 2026. Integrated platforms automate data capture across meters, assets, and contracts, eliminating manual spreadsheets that invite audit risk. Automated reporting also surfaces cost-saving opportunities such as peak-load reduction and preventive maintenance scheduling.
Post-Pandemic Hybrid Work Programs
Hybrid strategies create fluctuating occupancy that legacy systems cannot model. Microsoft introduced indoor mapping and IoT sensors to manage booking and navigation, demonstrating how integrated data removes friction from space sharing. IWMS mobile apps let employees locate free desks and reserve rooms in seconds, boosting satisfaction and supporting flexible attendance policies. Analytics track utilisation trends, informing long-term real-estate planning.
Restraints Impact Analysis of Integrated Workplace Management System (IWMS) Market*
| Restraint | (~) % Impact on CAGR Forecast | Geographic Relevance | Impact Timeline |
|---|---|---|---|
| Shortage of IWMS domain expertise | -1.8% | Global acute in emerging markets | Medium term (2-4 years) |
| High transformational switching costs | -2.1% | Global especially large enterprises | Short term (≤ 2 years) |
| Data-sovereignty limits for IoT telemetry | -1.2% | EU and China expanding globally | Long term (≥ 4 years) |
| Shadow-IT data-quality inconsistencies | -1.4% | Global in decentralized firms | Medium term (2-4 years) |
| Source: Mordor Intelligence | |||
Shortage of IWMS Domain Expertise
Projects stall when teams lack professionals who understand both facility workflows and enterprise software integration. A peer-reviewed study on SME ERP rollouts cites skilled manpower as a critical success factor, mirroring IWMS challenges. Scarcity inflates consulting fees and elongates deployments, particularly in emerging economies where facility management remains manual. Limited local support also deters buyers that require on-site assistance for regulatory or language reasons.
High Transformational Switching Costs
Replacing legacy CAFM systems can cost two to three times the new software budget once data cleansing, workflow redesign, and dual system operation are included. Large multinationals face the steepest bills due to entrenched custom integrations. Training thousands of end users and change-management programs further raise the total. These expenses often push payback periods beyond acceptable corporate thresholds, delaying investment approvals and slowing market expansion.
*Our forecasts treat driver/restraint impacts as directional, not additive. The impact forecasts reflect baseline growth, mix effects, and variable interactions.
Integrated Workplace Management System (IWMS) Market Segment Analysis
By Offering:
Solutions Dominate With Services GainingFacilities and Space Management contributed USD 1.67 billion in 2025, equal to 27.05% of the integrated workplace management system market size. Firms adopt these modules first because they deliver visible savings by reducing vacancy and trimming energy waste. Real-estate and lease management follows closely as IFRS 16 compliance deadlines tighten. Environmental sustainability management, although smaller, leads growth at 15.62% CAGR to 2031. Its momentum underscores how carbon accounting now influences boardroom decisions as much as financial accounting.
Professional services revenue surpassed USD 1.41 billion in 2025, reflecting the scarcity of in-house expertise. Vendors provide configuration, data migration, and training, ensuring customers achieve intended return on investment. Managed services attract mid-market firms that prefer to outsource operations entirely, lowering payroll and retention risks. Case studies such as McLaren Health Care, which raised facilities funding by 25% after adopting Brightly Origin, illustrate the gains realized when expert partners run the platform.


By Deployment Mode:
Hybrid Paths MultiplyOn-premise installations commanded 50.70% of the integrated workplace management system market share in 2025. Highly regulated industries keep sensitive data within their firewalls and integrate cloud analytics on top, creating layered architectures that minimize breach exposure. Large enterprises also leverage existing server capacity instead of retiring sunk investments early.
Cloud subscriptions, however, register the quickest climb at 17.11% CAGR. Government grants such as Singapore’s Productivity Solutions push SMEs toward cloud models that need no hardware outlay. Vendors issue feature updates monthly, letting clients consume innovations without upgrade projects. Hybrid deployment blends cloud portals with on-premise data lakes, giving organizations granular control while benefiting from elastic processing for AI workloads.
By Organization Size:
Democratization in MotionLarge enterprises retained 66.80% of revenue in 2025, driven by global portfolios and complex compliance charters. They deploy full suites across dozens of sites, linking IWMS with HR, finance, and procurement systems to support strategic facilities planning. Use cases include multi-currency lease accounting, scenario modelling, and predictive maintenance for vast asset inventories.
SMEs post a 14.56% CAGR owing to subscription licensing that aligns cost with headcount. Vendors bundle core functions such as room booking, asset logs, and energy dashboards into simplified packages that deploy in days. Japanese maintenance provider Taiho Kanzai moved from paper files to a cloud system dubbed Bilkan, cutting manual entries and workforce reliance. Academic research shows that top management sponsorship and resource availability remain decisive factors for SME success, elements easier to secure when capital expense is low and payback appears within a fiscal year.

By End-Use Industry:
Healthcare Outpaces PeersInformation technology and telecommunications generated USD 1.49 billion in 2025, representing 24.10% of the integrated workplace management system market size. Tech firms use their own premises as testbeds, then commercialize successful practices as product enhancements. Multi-tenant campuses also spur adoption of real-time desk booking and indoor navigation apps.
Healthcare and life sciences should witness 16.18% CAGR through 2031. Hospitals face strict uptime demands and regulatory audits on everything from air changes to asset sterilization. MaintainX enabled THIRA Health to raise proactive maintenance work orders to 36% of total, nearly triple the industry norm, boosting compliance and patient safety. Banking and insurance firms deploy IWMS for IFRS 16 lease reporting and branch consolidation projects, while universities prioritise sustainability certificates to appeal to students and alumni donors.
Geography Analysis
North America Integrated Workplace Management System (IWMS) Market
North America generated USD 2.05 billion in 2025, or 33.20% of global revenue. Early mover advantage, stringent SEC disclosure rules, and mature vendor ecosystems sustain spending. Enterprises there increasingly layer AI over historical building information to predict occupancy and pre-empt equipment failures, keeping operational metrics high.
Europe Integrated Workplace Management System (IWMS) Market
Europe recorded USD 1.83 billion, with growth tied to expanded climate regulations such as the Corporate Sustainability Reporting Directive. Facilities teams integrate energy meters and carbon dashboards into IWMS to produce audit-ready reports for authorities and investors. Uptake is notable in Germany, the Netherlands, and the Nordics, where net-zero roadmaps accelerate retrofits.
APAC and Middle East Integrated Workplace Management System (IWMS) Market
Asia-Pacific contributed USD 1.56 billion yet will post the fastest 15.44% CAGR. Rapid urbanisation necessitates efficient space use, while talent shortages in building trades push automation. Japanese developers deploy LPWA sensor networks across portfolios, and Singapore sponsors smart facilities curricula to close skill gaps. India and Indonesia adopt cloud suites to bypass legacy systems altogether, and Middle East projects link IWMS with district cooling and photovoltaic assets to manage extreme climates.


Competitive Landscape
The market remains moderately fragmented. IBM, ServiceNow, and SAP leverage broad enterprise suites to bundle workplace modules alongside HR and finance. Their scale ensures continuous investment in AI functions such as predictive cleaning schedules. Planon, Archibus, and FM: Systems differentiate through domain depth, adding industry-specific templates that shorten configuration cycles.
Acquisitions shape strategy. IBM bought HashiCorp for USD 6.4 billion in 2024 to reinforce hybrid cloud governance, an offer that underpins distributed IWMS deployments. ServiceNow launched AI Agent Orchestrator and intends to purchase Moveworks to embed conversational workflows inside workplace tickets, streamlining user engagement.
Technology patents focus on AI detection of free space, object tracking, and advanced wayfinding. Meta filed claims for object-free space identification to support dynamic room allocation, hinting at broader competition from consumer tech giants. White-space opportunities exist in SME bundles and vertical SaaS offerings for sectors such as logistics, where warehouse layouts and cold chain compliance require custom logic.
Integrated Workplace Management System (IWMS) Industry Leaders
Planon Group BV
Eptura Inc.
IBM Corporation
MRI Software LLC
Trimble Inc.
- *Disclaimer: Major Players sorted in no particular order
Integrated Workplace Management System (IWMS) Market Companies Covered in this Report
- International Business Machines Corporation
- Planon Group B.V.
- MRI Software LLC
- Trimble Inc.
- Eptura Inc.
- Accruent LLC
- FM:Systems (Johnson Controls International plc)
- SAP SE
- Oracle Corporation
- ServiceNow, Inc.
- Nuvolo, Inc.
- Spacewell International NV
- Tango Analytics LLC
- iOFFICE, LP
- SpaceIQ, Inc.
- Archibus, Inc.
- Schneider Electric SE
- Causeway Technologies Limited
- AssetWorks, LLC
- OfficeSpace Software, Inc.
- Flairsoft Ltd.

Recent Industry Developments in Integrated Workplace Management System (IWMS) Market
- June 2025: ServiceNow announced Oracle integration to enhance Workflow Data Fabric for real-time data sharing across both platforms, scheduled for select availability in H2 2025.
- May 2025: Trimble posted USD 841 million Q1 2025 revenue, highlighting 17% organic ARR growth to USD 2.11 billion and deeper AI penetration in its portfolio.
- April 2025: ServiceNow reported USD 3.005 billion subscription revenue with 19% year-over-year growth and announced intent to acquire Moveworks and Logik.ai to amplify AI features.
- April 2025: IBM generated USD 14.54 billion Q1 2025 revenue with hybrid cloud software up 12%, and generative AI sales hitting USD 6 billion.


Global Integrated Workplace Management System (IWMS) Market Report Scope
An integrated workplace management system (IWMS) helps management executives deliver an accurate picture of their facilities' data. The integrated workplace management system (IWMS) market is defined based on the revenues generated from the solutions and services used by various end users across the globe. The analysis is based on the market insights captured through secondary research and the primaries. The market also covers the major factors impacting the growth of the market in terms of drivers and restraints.
The integrated workplace management system market is segmented by offering (type of solution [real-estate and lease management, facilities and space management, asset and maintenance management, project management, environmental sustainability, and other solutions], service [professional services, managed services]), deployment (cloud and on-premise), and geography (North America [United States and Canada], Europe [United Kingdom, Germany, France, and Rest of Europe], Asia-Pacific [China, Japan, India, and Rest of Asia Pacific], Latin America [Brazil, Mexico, and Rest of Latin America], and Middle East and Africa [Saudi Arabia, United Arab Emirates, and Rest of Middle East and Africa]). The market size and forecasts are provided in terms of value in USD for all the above segments.
Segmentation Overview
| Solutions | Real Estate and Lease Management |
| Facilities and Space Management | |
| Asset and Maintenance Management | |
| Project Management | |
| Environmental Sustainability Management | |
| Integrated Workplace Analytics | |
| Other Solutions | |
| Services | Professional Services |
| Managed Services |
| Cloud |
| On-premise |
| Hybrid |
| Large Enterprises |
| Small and Medium Enterprises |
| Information Technology and Telecommunications |
| Banking, Financial Services and Insurance |
| Healthcare and Life Sciences |
| Manufacturing |
| Retail and E-commerce |
| Government and Public Sector |
| Education |
| Other Industries |
| North America | United States | |
| Canada | ||
| Mexico | ||
| South America | Brazil | |
| Argentina | ||
| Rest of South America | ||
| Europe | United Kingdom | |
| Germany | ||
| France | ||
| Italy | ||
| Spain | ||
| Nordics | ||
| Rest of Europe | ||
| Middle East and Africa | Middle East | Saudi Arabia |
| United Arab Emirates | ||
| Turkey | ||
| Rest of Middle East | ||
| Africa | South Africa | |
| Egypt | ||
| Nigeria | ||
| Rest of Africa | ||
| Asia-Pacific | China | |
| India | ||
| Japan | ||
| South Korea | ||
| ASEAN | ||
| Australia | ||
| New Zealand | ||
| Rest of Asia-Pacific | ||
| By Offering | Solutions | Real Estate and Lease Management | |
| Facilities and Space Management | |||
| Asset and Maintenance Management | |||
| Project Management | |||
| Environmental Sustainability Management | |||
| Integrated Workplace Analytics | |||
| Other Solutions | |||
| Services | Professional Services | ||
| Managed Services | |||
| By Deployment Mode | Cloud | ||
| On-premise | |||
| Hybrid | |||
| By Organization Size | Large Enterprises | ||
| Small and Medium Enterprises | |||
| By End-use Industry | Information Technology and Telecommunications | ||
| Banking, Financial Services and Insurance | |||
| Healthcare and Life Sciences | |||
| Manufacturing | |||
| Retail and E-commerce | |||
| Government and Public Sector | |||
| Education | |||
| Other Industries | |||
| By Geography | North America | United States | |
| Canada | |||
| Mexico | |||
| South America | Brazil | ||
| Argentina | |||
| Rest of South America | |||
| Europe | United Kingdom | ||
| Germany | |||
| France | |||
| Italy | |||
| Spain | |||
| Nordics | |||
| Rest of Europe | |||
| Middle East and Africa | Middle East | Saudi Arabia | |
| United Arab Emirates | |||
| Turkey | |||
| Rest of Middle East | |||
| Africa | South Africa | ||
| Egypt | |||
| Nigeria | |||
| Rest of Africa | |||
| Asia-Pacific | China | ||
| India | |||
| Japan | |||
| South Korea | |||
| ASEAN | |||
| Australia | |||
| New Zealand | |||
| Rest of Asia-Pacific | |||


Key Questions Answered in the Report
What is the projected value of the integrated workplace management system market by 2031?
The market is forecast to reach USD 13.48 billion by 2031, growing at a 13.92% CAGR from 2026.
Which deployment mode is expanding the fastest?
Cloud deployment is advancing at a 17.11% CAGR because subscription pricing and rapid rollout appeal to organisations of all sizes.
Why is healthcare the fastest-growing end-use industry segment?
Hospitals require stringent compliance and asset uptime, pushing adoption at a 16.18% CAGR as they integrate maintenance, safety, and energy data under one platform.
How do IWMS platforms support ESG compliance?
They automatically aggregate energy, water, and emissions data, generate audit-ready reports, and surface efficiency projects that lower costs and carbon footprints.
What is the biggest restraint hampering adoption?
High transformational switching costs divert budgets and lengthen payback periods, particularly for large enterprises with entrenched legacy systems.
Page last updated on:


