Commercial and Industrial Energy Storage Market Size and Share
Market Overview
| Study Period | 2021 - 2031 |
|---|---|
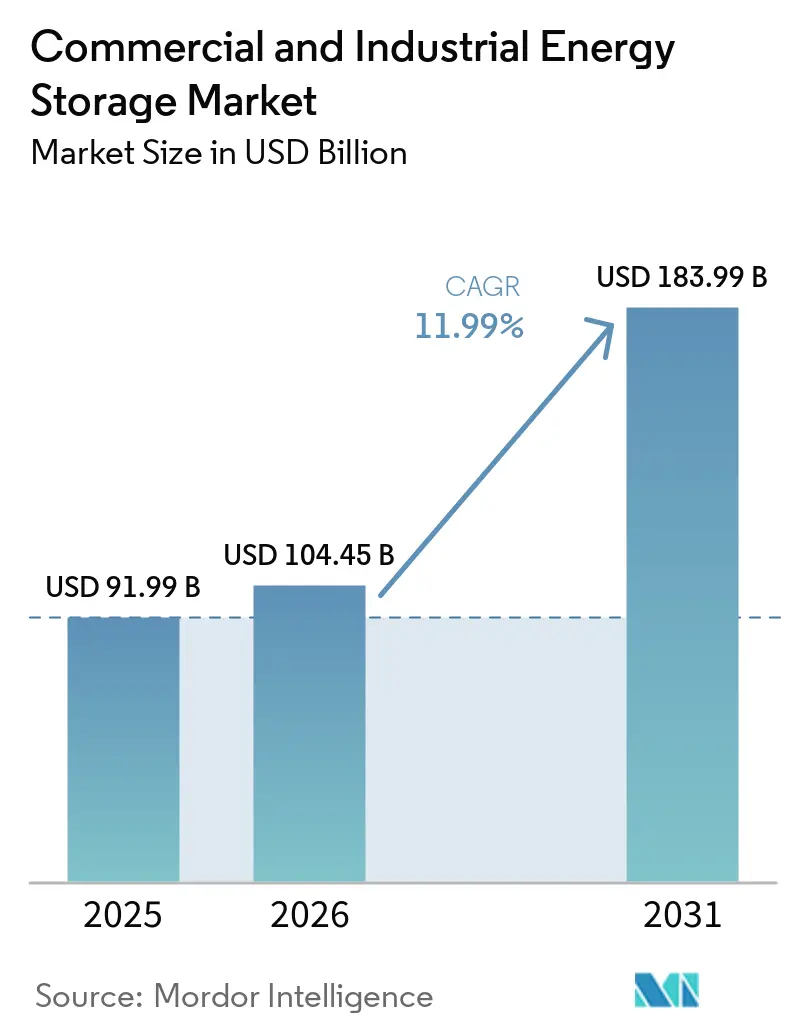
| Market Size (2026) | USD 104.45 Billion |
| Market Size (2031) | USD 183.99 Billion |
| Growth Rate (2026 - 2031) | 11.99% CAGR |
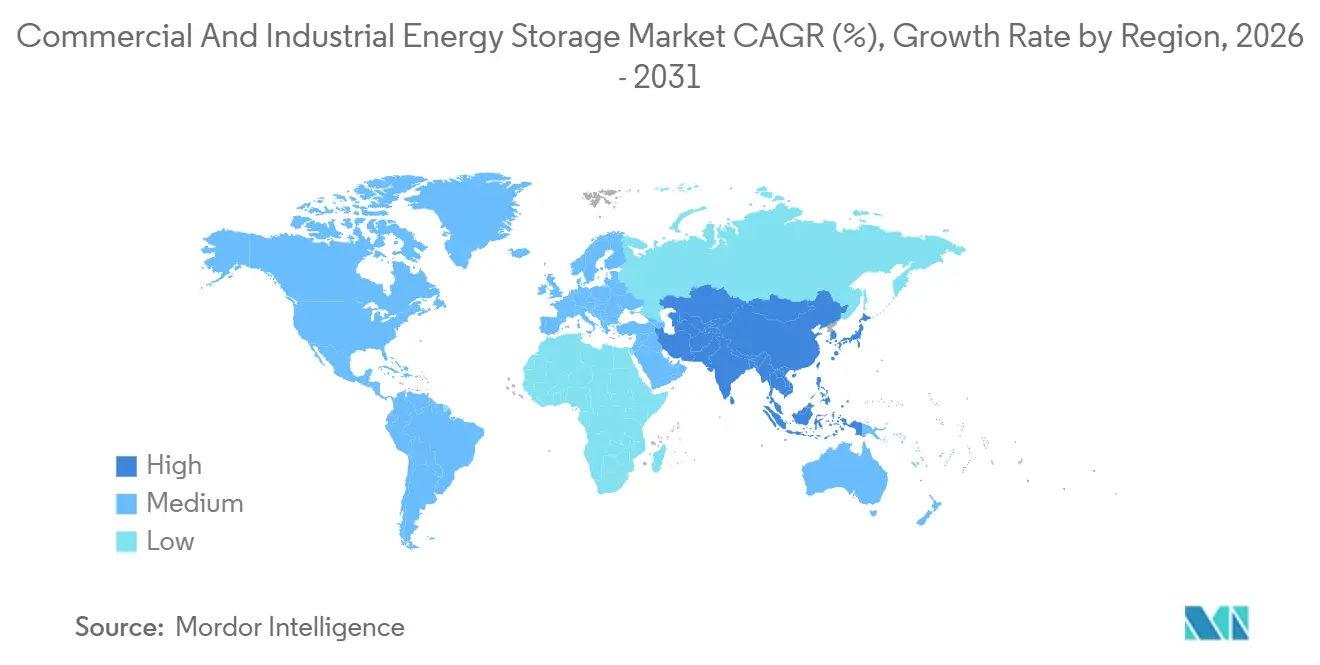
| Fastest Growing Market | Asia Pacific |
| Largest Market | North America |
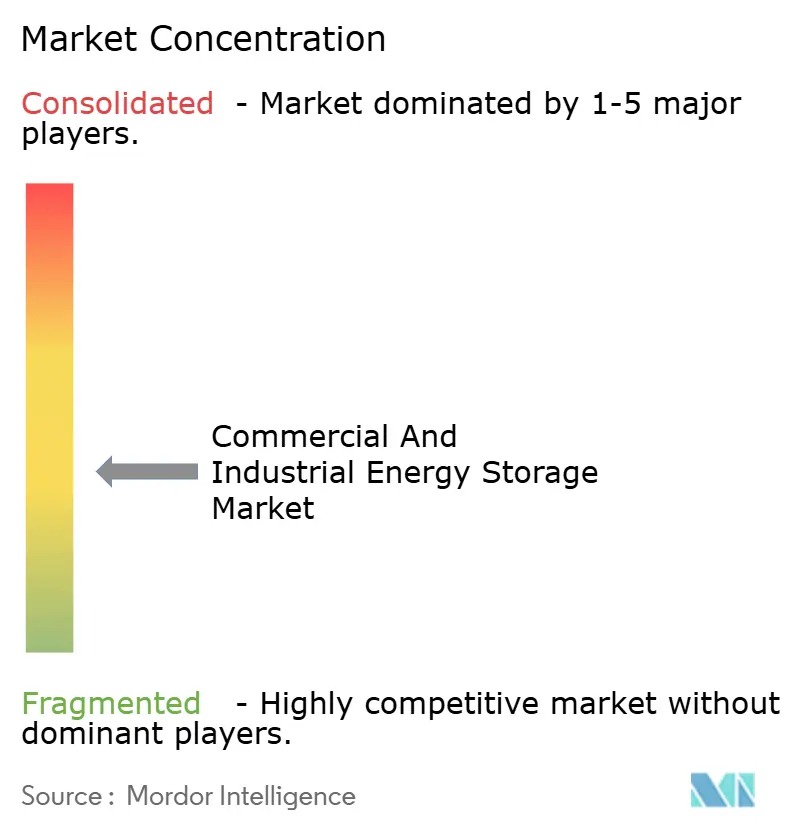
| Market Concentration | Medium |
Major Players *Disclaimer: Major Players sorted in no particular order Image © Mordor Intelligence. Reuse requires attribution under CC BY 4.0. | |
Commercial and Industrial Energy Storage Market Analysis by Mordor Intelligence
The Commercial And Industrial Energy Storage Market size is expected to increase from USD 91.99 billion in 2025 to USD 104.45 billion in 2026 and reach USD 183.99 billion by 2031, growing at a CAGR of 11.99% over 2026-2031. Intensifying peak-demand charges, falling lithium-ion pack prices, and policy incentives that now recognize standalone batteries as dispatchable assets are shifting energy-management strategies for enterprises. Companies increasingly deploy storage to arbitrage wholesale prices, defer costly grid upgrades, and firm on-site renewables, services that diesel gensets cannot replicate at a comparable speed or emissions levels. North American momentum stems from the U.S. Investment Tax Credit extension, while Asia-Pacific acceleration reflects China’s cost leadership and India’s renewable-integration mandate. Software that orchestrates multiple revenue streams, together with innovative financing models, is broadening access to storage for mid-sized facilities, cementing growth prospects for the commercial and industrial energy storage market.
Key Report Takeaways
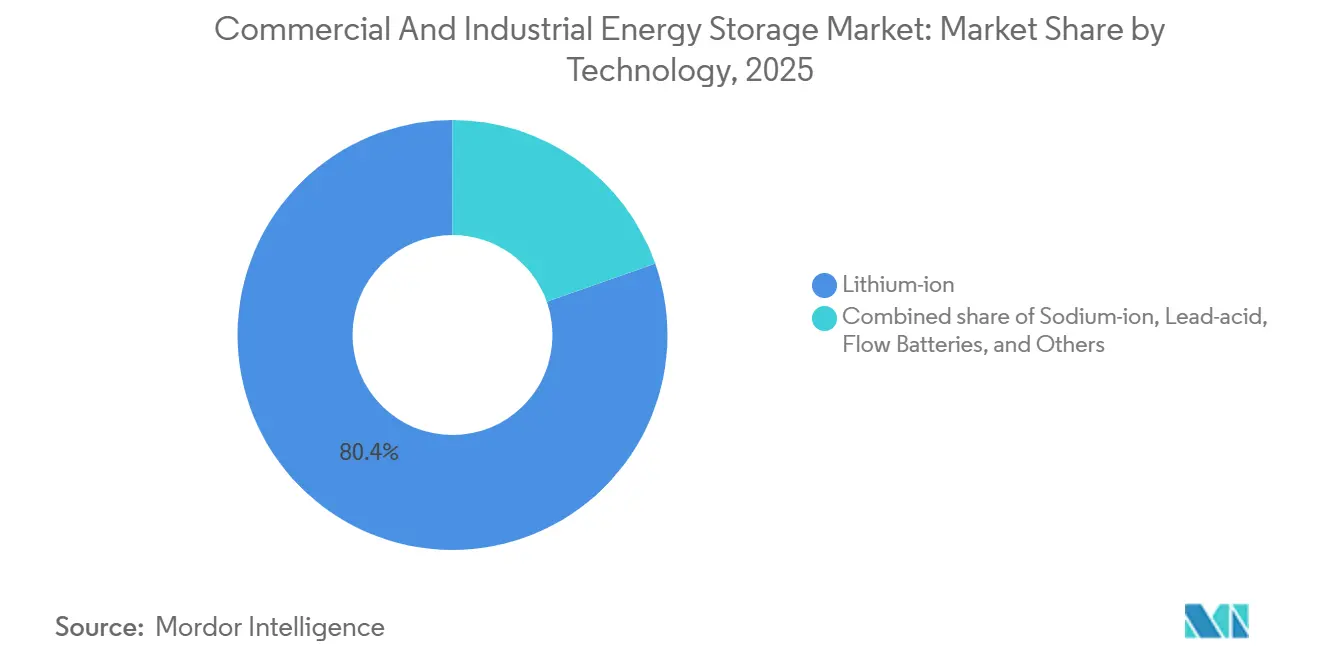
- By technology, lithium-ion commanded 80.4% of the commercial and industrial energy storage market share in 2025; sodium-ion is projected to expand at a 37.5% CAGR through 2031.
- By application, peak shaving led with 22.1% revenue share in 2025; EV fast-charging support is expected to advance at a 28.2% CAGR through 2031.
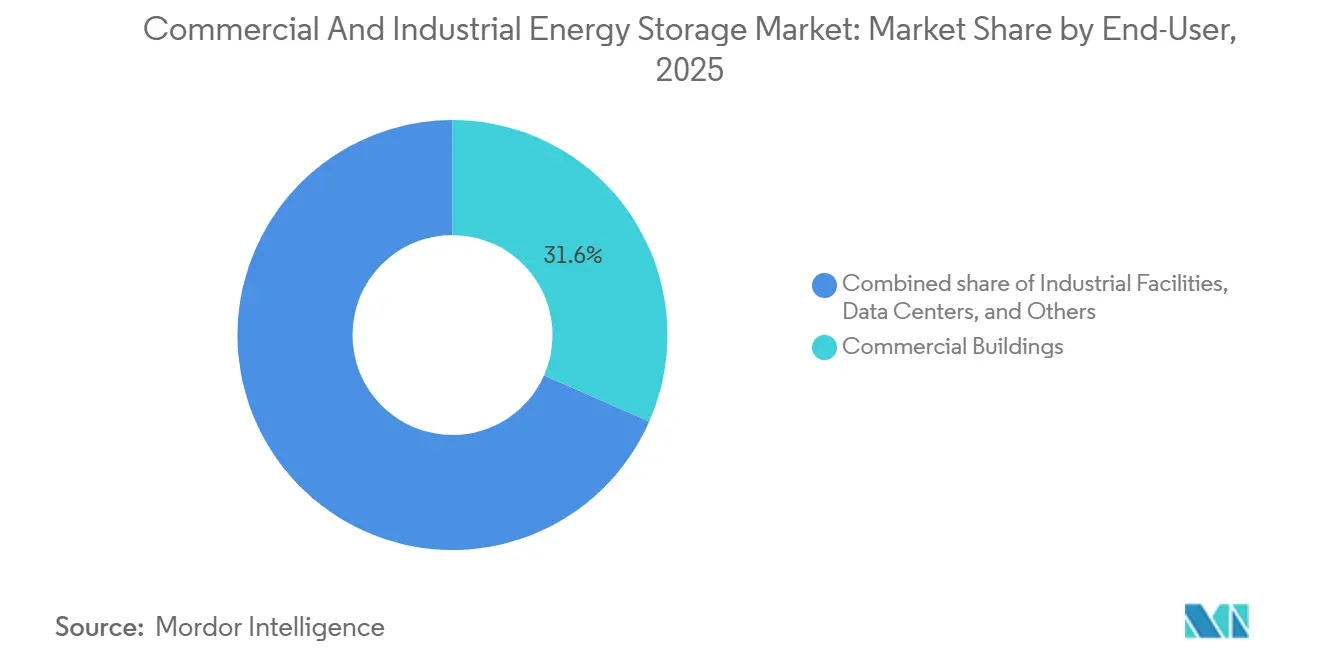
- By end user, commercial buildings accounted for 31.6% of the commercial and industrial energy storage market size in 2025; EV-fleet operators are forecast to rise at a 28.7% CAGR over 2026-2031.
- By geography, North America captured 36.5% share in 2025; Asia-Pacific is expected to grow at a 23.3% CAGR to 2031.
Note: Market size and forecast figures in this report are generated using Mordor Intelligence’s proprietary estimation framework, updated with the latest available data and insights as of January 2026.
Global Commercial and Industrial Energy Storage Market Trends and Insights
Drivers Impact Analysis*
| Driver | (~) % Impact on CAGR Forecast | Geographic Relevance | Impact Timeline |
|---|---|---|---|
| Li-ion cost curve approaching sub-$90/kWh | +2.80% | Global, with APAC manufacturing scale accelerating adoption in North America & EU | Medium term (2-4 years) |
| Global renewable mandates & corporate RE100 targets | +2.30% | Global, particularly EU and North America where corporate procurement is most mature | Long term (≥ 4 years) |
| Stand-alone storage ITC (US) & equivalent global incentives | +1.90% | North America primary, with spillover to Latin America and select APAC markets | Short term (≤ 2 years) |
| Rising global C&I peak-demand charges | +1.60% | North America & EU core, with emerging impact in ASEAN and India | Medium term (2-4 years) |
| Hyperscale data-centre grid-deferral demand | +1.40% | North America & EU, with APAC expansion in Singapore, Tokyo, Sydney | Medium term (2-4 years) |
| Surge in synthetic PPAs needing dispatchable load-shifting | +1.10% | North America & EU, limited penetration in APAC and MEA | Long term (≥ 4 years) |
| Source: Mordor Intelligence | |||
Li-ion Cost Curve Approaching Sub-USD 90/kWh
Stationary battery pack prices averaged USD 70 per kWh in 2025, a 35% drop from 2020, crossing the point where three-to-five-year paybacks become common for commercial facilities in high-tariff regions. Manufacturing scale in China and the pivot to cobalt-free LFP chemistries have trimmed material costs by up to 20%. Lower capex broadens the addressable base from hyperscale users to mid-sized industrial plants, stimulating fresh demand for the commercial and industrial energy storage market. Major supply contracts, such as LG Energy Solution’s USD 4.3 billion LFP deal with Tesla, signal sustained downward pricing over the next 18 months. Pilot lines for sodium-ion and early solid-state designs are expected to push average installed costs beneath USD 350 per kWh by late 2026, deepening penetration across cost-sensitive sectors.
Global Renewable Mandates & Corporate RE100 Targets
More than 400 multinational firms have pledged 100% renewable electricity, together consuming upwards of 380 TWh annually, roughly Germany’s load.(1)RE100, “RE100 Progress and Insights 2024,” re100.org These commitments force large facilities to store surplus midday solar and nighttime wind for evening peaks, converting variable output into dispatchable supply. Google’s 300 MW / 30 GWh Minnesota project, operational since mid-2025, cuts fossil peaker reliance by 85% and exemplifies large-scale corporate adoption. In Europe, the REPowerEU plan mandates that 45% of electricity be renewable by 2030, explicitly linking storage targets to congestion relief. Industrial operators in Germany now face curtailment penalties approaching EUR 100 per MWh, making batteries a cost-effective hedge.
Stand-alone Storage ITC & Equivalent Global Incentives
The U.S. Inflation Reduction Act trimmed the levelized storage cost for 100 MW, 4-hour systems to USD 124/MWh and eliminated co-location requirements, prompting a wave of standalone commercial projects. Fluence’s USD 4.5 billion backlog illustrates how tax incentives translate into supplier order books.
Rising Global C&I Peak-Demand Charges
Demand charges comprise up to 70% of large-facility electricity bills, enabling storage systems that shave 15-25% of monthly peaks to achieve sub-five-year paybacks in California, Japan, and Germany. AI-enabled dispatch algorithms maximize savings beyond static TOU schedules.
Restraints Impact Analysis*
| Restraint | (~) % Impact on CAGR Forecast | Geographic Relevance | Impact Timeline |
|---|---|---|---|
| High CAPEX vs diesel gensets | -1.80% | Global, with acute impact in price-sensitive ASEAN and Latin America markets | Short term (≤ 2 years) |
| Critical-mineral supply-chain volatility | -1.50% | Global, with upstream concentration in China, Chile, and DRC creating geopolitical risk | Medium term (2-4 years) |
| Fragmented interconnection & permitting rules | -0.90% | North America & EU, where regulatory fragmentation delays project timelines | Medium term (2-4 years) |
| Urban fire-code compliance costs for indoor BESS | -0.70% | North America & EU urban cores, with limited impact in APAC and MEA | Short term (≤ 2 years) |
| Source: Mordor Intelligence | |||
High CAPEX vs Diesel Gensets
Installed costs of USD 280-580/kWh still exceed a diesel generator’s USD 500-1,000/kW upfront, deterring smaller enterprises lacking low-cost finance, despite superior lifetime economics. Energy-as-a-service contracts help mitigate capital barriers but add transaction complexity.
Critical-Mineral Supply-Chain Volatility
Lithium carbonate prices swung between USD 12,000 and USD 38,000 per metric ton during 2024-2025, while cobalt moved from USD 28,000 to USD 42,000. Such volatility inflates project contingencies and complicates long-term service agreements. Concentration of cobalt refining in the Democratic Republic of Congo and lithium brine in Chile exposes buyers to geopolitical shocks. Developers are pivoting to cobalt-free LFP and sodium-ion chemistries, but these alternatives require larger footprints, challenging dense urban sites. Strategic stockpiling and diversified offtake contracts can mitigate swings, yet mineral risk continues to shave points from forecast CAGR.
*Our forecasts treat driver/restraint impacts as directional, not additive. The impact forecasts reflect baseline growth, mix effects, and variable interactions.
Segment Analysis
By Technology: LFP Dominance Meets Sodium-Ion Disruption
Lithium-ion technologies controlled 80.4% of the commercial and industrial energy storage market in 2025, thanks to cycle lives exceeding 6,000 cycles at 80% depth of discharge and lower thermal-runaway risk. Sodium-ion platforms, commercialized by CATL and BYD, are expanding at a 37.5% CAGR through 2031, enabled by abundant raw materials and parity pricing with LFP for stationary duties. Although energy density trails NMC, warehouse rooftops and ground-mount yards offer ample space, softening the penalty for commercial users. Lead-acid remains in telecom backup niches, but environmental disposal rules erode its share each year. Flow batteries, especially vanadium redox and iron-flow variants, are carving out long-duration roles beyond four-hour discharge, with ESS Inc. delivering 500 MWh to industrial microgrids in 2025. Hybrid supercapacitors secure frequency-regulation contracts in markets like PJM, though low energy density caps their addressable segment. Solid-state chemistries linger in pilot stages; wide deployment before 2028 appears unlikely, given unresolved manufacturing scale-up hurdles. Mandatory UL 9540A testing, now common in the United States and Europe, adds USD 30,000–50,000 per project but cuts insurance costs by up to 25%, improving lifecycle economics for compliant suppliers.
Second-life automotive packs, retired at 70-80% state of health, entice value-oriented buyers, offering landed costs 40-50% below new systems. Standardization, however, lags: warranty schemes, cell traceability, and varying chemistries complicate integration. The resulting patchwork slows widespread adoption, but localized pilots in Spain and California illustrate promise for price-sensitive commercial users. On balance, technology diversification widens choice yet reinforces lithium-ion’s incumbency, sustaining its leading position in the commercial and industrial energy storage market.


By Application: Peak Shaving Leads, EV Charging Surges
Peak shaving represented 22.1% of 2025 revenues, reflecting predictable savings from trimming utility-defined demand windows, especially where charges top USD 15 per kW monthly. Facilities in New York, California, and Germany recover investment within four to six years, triggering repeat orders across retail chains and logistics warehouses. EV fast-charging support is the fastest-growing segment, projected at a 28.2% CAGR, as clusters of 350 kW chargers would otherwise trigger grid upgrades costing millions. Tesla’s early Megapack deployments cut interconnection fees by up to 60%, inspiring similar rollouts by BP Pulse and Ionity. Load shifting harvesting arbitrage margins exceeding USD 0.15 per kWh in ERCOT summer peaks. Backup power remains essential for data centers and hospitals, though diesel displacement proceeds gradually owing to higher upfront costs. Renewable self-consumption gains traction among rooftop solar owners, aligning midday excess with evening retail activity. Ancillary-service revenues, frequency regulation, voltage support, spinning reserve, complement core applications, yielding recurring cash flows between USD 10 and USD 30 per kW monthly in remunerative markets.
Collectively, these value streams underscore why diversified software, rather than cell chemistry alone, increasingly differentiates suppliers in the commercial and industrial energy storage market. Customer economics hinge on stacking services, a capability maturing rapidly as analytics platforms integrate wholesale forecasts, tariff databases, and real-time controls.
By End-user: Fleet Operators Drive Market Evolution
Commercial buildings, retail, offices, and hotels commanded 31.6% demand in 2025, motivated by operating-cost relief and sustainability pledges. Property owners exploit batteries to flatten demand curves, unlocking preferred electricity tariffs and Green Building certifications. EV-fleet depots are climbing fastest, at 28.7% CAGR, as logistics giants electrify vans and buses yet face peak-power fees exceeding USD 20 per kW in many urban grids. Industrial plants use storage for power-quality smoothing, demand-response earnings, and generator substitution in emissions-controlled zones. Hyperscale data centers deploy multi-hour systems that defer costly feeder upgrades while satisfying zero-carbon mandates from municipalities like Dublin and Loudoun County. Universities and hospitals trail, hampered by budget cycles and complex procurement, yet targeted grants are beginning to unlock pilot projects linked to resilience goals. Telecom towers still rely on lead-acid but are transitioning toward lithium-ion as space and maintenance constraints intensify. Public infrastructure, airports, and metros represent a small but strategic niche, where reliability standards are stringent, and willingness to pay is rising. Ongoing electrification of transport and heating deepens interdependence between end-user segments, reinforcing secular adoption of batteries across the commercial and industrial energy storage market.
Geography Analysis
North America captured 36.5% of global installations in 2025, with the United States accounting for the lion’s share after the standalone-storage Investment Tax Credit removed co-location requirements. California leads, exceeding 3 GW of commercial deployments by the end of 2025 under the Self-Generation Incentive Program that rebates up to USD 200 per kWh. Texas follows as ERCOT’s energy-only market swings more than USD 0.20 per kWh during summer peaks, ideal for wholesale arbitrage. Canada’s growth centers on Ontario and Alberta, where provincial incentives and microgrid needs intersect. Mexico remains nascent; lower tariffs and scarce financing limit adoption, though pilot projects are underway in Monterrey manufacturing zones. Asia-Pacific is the fastest-growing region, projected at a 23.3% CAGR through 2031. China’s vertically integrated giants supply more than half of worldwide commercial shipments, keeping average system costs 20-30% below Western equivalents. India mandates two-hour storage for commercial solar above 500 kW, igniting activity in Gujarat and Maharashtra. Japan and South Korea prioritize resilience against natural disasters and supply-chain shocks, prompting corporate buyers like Toyota to install on-site batteries. ASEAN states advance unevenly, Thailand and Vietnam attract FDI-backed factories that embrace storage, but diesel subsidies in Indonesia slow progress.(2)International Energy Agency, “Executive Summary – Southeast Asia Energy Outlook 2024,” iea.org Australia and New Zealand deploy aggressively because high retail tariffs and prolific rooftop solar heighten self-consumption benefits.
Germany’s industrial hubs deploy batteries to dodge curtailment fees when renewables drive spot prices negative more than 200 days each year. The United Kingdom’s capacity-market auctions reward multi-hour assets, spurring supermarket chains and parcel depots to contract storage under twelve-year agreements. France, Spain, and Italy scale installations to integrate growing solar pipelines and comply with Fit-for-55 decarbonization targets. The Nordics pair wind with hydropower balancing, yet still adopt batteries for frequency support and grid congestion relief. Russia lags due to low tariffs and limited incentives; deployments are confined to remote mines and oil-and-gas outposts. In South America, the Middle East & Africa, Brazil, the UAE, and South Africa exhibit pilot activity in malls and telecom sites. Regional disparities notwithstanding, every continent now records commercial projects, underscoring the broad geographic spread of the commercial and industrial energy storage market.

Competitive Landscape
The commercial and industrial energy storage market is moderately consolidated. Scale furnishes cost leadership, yet software acumen and financing creativity increasingly tilt purchasing decisions. Tesla’s Megapack exceeded a 40 GWh annual run rate in late 2025, leveraging vertical control from cell to cloud analytics. Fluence’s Mosaic platform orchestrates energy-market participation across more than 12 GW of assets, becoming a de facto standard for demand-charge and arbitrage optimization. CATL and BYD integrate cell production, power electronics, and construction services to undercut landed costs in Asia-Pacific by up to 25%.
M&A activity is reshaping the field. Hitachi Energy’s purchase of Eks Energy in August 2025 added 2 GWh of project capacity and strengthened its European footprint. ABB’s December 2025 acquisition of Gamesa Electric’s inverter division trimmed balance-of-system costs by double digits, broadening turnkey offerings for commercial users. Eaton and Schneider Electric are bolting energy-management software onto switchgear portfolios, seeking cross-sales into existing customer bases. Start-ups such as ESS Inc. exploit white space with iron-flow batteries free from lithium and cobalt exposure, attracting industrial customers wary of mineral volatility.
Second-life battery integrators, Connected Energy in the United Kingdom, B2U Storage Solutions in California, are carving out a circular-economy niche, though warranty complexity still hampers scale. Compliance with UL 9540 and NFPA 855 fire codes has become a baseline requirement for insurers and municipalities, raising entry barriers for smaller vendors. Intellectual-property disputes in battery-management-system algorithms highlight the rising importance of software. In sum, while oligopoly pressures grow at the top, ample specialization avenues remain, keeping competitive intensity moderate and dynamic across the commercial and industrial energy storage market.
Commercial and Industrial Energy Storage Industry Leaders
Tesla Inc.
Fluence Energy
LG Energy Solution
BYD Co. Ltd.
CATL
- *Disclaimer: Major Players sorted in no particular order

Recent Industry Developments
- February 2026: LG Energy Solution announced a 90 GWh energy storage system order target for 2026, representing a 35% increase over 2025 volumes, driven by demand from hyperscale data centers and commercial solar installations in North America and Europe. The company's USD 4.3 billion LFP supply agreement with Tesla, signed in January 2025, positions it to capture a larger share of the cost-sensitive commercial and industrial segment.
- January 2026: Tesla deployed a 500 MW/1 GWh Megapack system in the United Kingdom, the largest commercial and industrial battery installation in Europe, designed to provide grid-balancing services and defer transmission upgrades in the London metropolitan area. The project is expected to generate over USD 40 million in annual revenue from capacity-market auctions and wholesale energy arbitrage.
- October 2024: CATL unveiled a 175 Wh/kg sodium-ion battery aimed at stationary storage.
- September 2024: A 63 MWh second-life EV battery project entered commercial service on the Texas grid.


Global Commercial and Industrial Energy Storage Market Report Scope
Commercial and Industrial (C&I) Energy Storage refers to large-scale battery systems, often utilizing lithium-ion technology, designed for businesses, factories, and commercial buildings to store electricity for future use. These systems, typically ranging from 100 kW to MW-level capacities, facilitate peak shaving to lower energy costs, ensure uninterrupted backup power, and optimize the utilization of solar energy.
The Global Commercial and Industrial Energy Storage Market is segmented into technology, application, end-user, and geography. By technology, the market is segmented into lithium-ion, sodium-ion, lead-acid, flow batteries, hybrid supercapacitor systems, and other emerging chemistries. By application, the market is segmented into peak shaving, load shifting, backup power/UPS, renewable integration, ancillary services, demand-charge management, EV fast-charging support, and microgrid stabilisation. By end-user, the market is segmented into commercial buildings, industrial facilities, data centres, educational institutions, healthcare facilities, telecom BTS and edge sites, EV-fleet operators and charging hubs, and public infrastructure. The report also covers the market size and forecasts for the commercial and industrial energy storage market in 20 countries across major regions. For each segment, the market sizing and forecasts have been done on the basis of value (USD).
| Lithium-ion (LFP, NMC/NCA, LCO) |
| Sodium-ion |
| Lead-acid (VRLA, Flooded) |
| Flow Batteries (Vanadium-Redox, Zinc-Bromine) |
| Hybrid Super-capacitor Systems |
| Other Emerging Chemistries (Solid-state, Metal-air) |
| Peak Shaving |
| Load Shifting |
| Backup Power/UPS |
| Renewable Integration |
| Ancillary Services (Frequency Regulation) |
| Demand-charge Management |
| EV Fast-charging Support |
| Microgrid Stabilisation |
| Commercial Buildings (Retail, Offices) |
| Industrial Facilities (Manufacturing, Warehousing) |
| Data Centres |
| Educational Institutions |
| Healthcare Facilities |
| Telecom BTS and Edge Sites |
| EV-fleet Operators and Charging Hubs |
| Public Infrastructure (Airports, Rail) |
| North America | United States |
| Canada | |
| Mexico | |
| Europe | United Kingdom |
| Germany | |
| France | |
| Spain | |
| Nordic Countries | |
| Russia | |
| Rest of Europe | |
| Asia-Pacific | China |
| India | |
| Japan | |
| South Korea | |
| ASEAN Countries | |
| Australia and New Zealand | |
| Rest of Asia-Pacific | |
| South America | Brazil |
| Argentina | |
| Colombia | |
| Rest of South America | |
| Middle East and Africa | United Arab Emirates |
| Saudi Arabia | |
| South Africa | |
| Egypt | |
| Rest of Middle East and Africa |
| By Technology | Lithium-ion (LFP, NMC/NCA, LCO) | |
| Sodium-ion | ||
| Lead-acid (VRLA, Flooded) | ||
| Flow Batteries (Vanadium-Redox, Zinc-Bromine) | ||
| Hybrid Super-capacitor Systems | ||
| Other Emerging Chemistries (Solid-state, Metal-air) | ||
| By Application | Peak Shaving | |
| Load Shifting | ||
| Backup Power/UPS | ||
| Renewable Integration | ||
| Ancillary Services (Frequency Regulation) | ||
| Demand-charge Management | ||
| EV Fast-charging Support | ||
| Microgrid Stabilisation | ||
| By End-user | Commercial Buildings (Retail, Offices) | |
| Industrial Facilities (Manufacturing, Warehousing) | ||
| Data Centres | ||
| Educational Institutions | ||
| Healthcare Facilities | ||
| Telecom BTS and Edge Sites | ||
| EV-fleet Operators and Charging Hubs | ||
| Public Infrastructure (Airports, Rail) | ||
| By Geography | North America | United States |
| Canada | ||
| Mexico | ||
| Europe | United Kingdom | |
| Germany | ||
| France | ||
| Spain | ||
| Nordic Countries | ||
| Russia | ||
| Rest of Europe | ||
| Asia-Pacific | China | |
| India | ||
| Japan | ||
| South Korea | ||
| ASEAN Countries | ||
| Australia and New Zealand | ||
| Rest of Asia-Pacific | ||
| South America | Brazil | |
| Argentina | ||
| Colombia | ||
| Rest of South America | ||
| Middle East and Africa | United Arab Emirates | |
| Saudi Arabia | ||
| South Africa | ||
| Egypt | ||
| Rest of Middle East and Africa | ||


Key Questions Answered in the Report
How large will commercial and industrial energy storage spend be in 2031?
The commercial and industrial energy storage market is forecast to reach USD 183.99 billion by 2031.
What is the expected CAGR for commercial and industrial battery deployments between 2026-2031?
Deployments are projected to grow at an 11.99% CAGR over the 2026-2031 period.
Which battery technology holds the largest share today?
Lithium-ion, led by LFP chemistry, controlled 80.4% of installations in 2025.
Which application is growing fastest through 2031?
EV fast-charging support is advancing at a 28.2% CAGR as charging hubs avoid steep grid-upgrade fees.
Which region will add capacity most quickly?
Asia-Pacific is projected to expand at a 23.3% CAGR, fueled by Chinese cost leadership and Indian policy mandates.
Who are the top suppliers in the space?
Tesla, Fluence, LG Energy Solution, CATL, and BYD collectively shipped about 45% of global capacity in 2025.
Page last updated on:


