Market Overview
| Study Period | 2020 - 2031 |
|---|---|
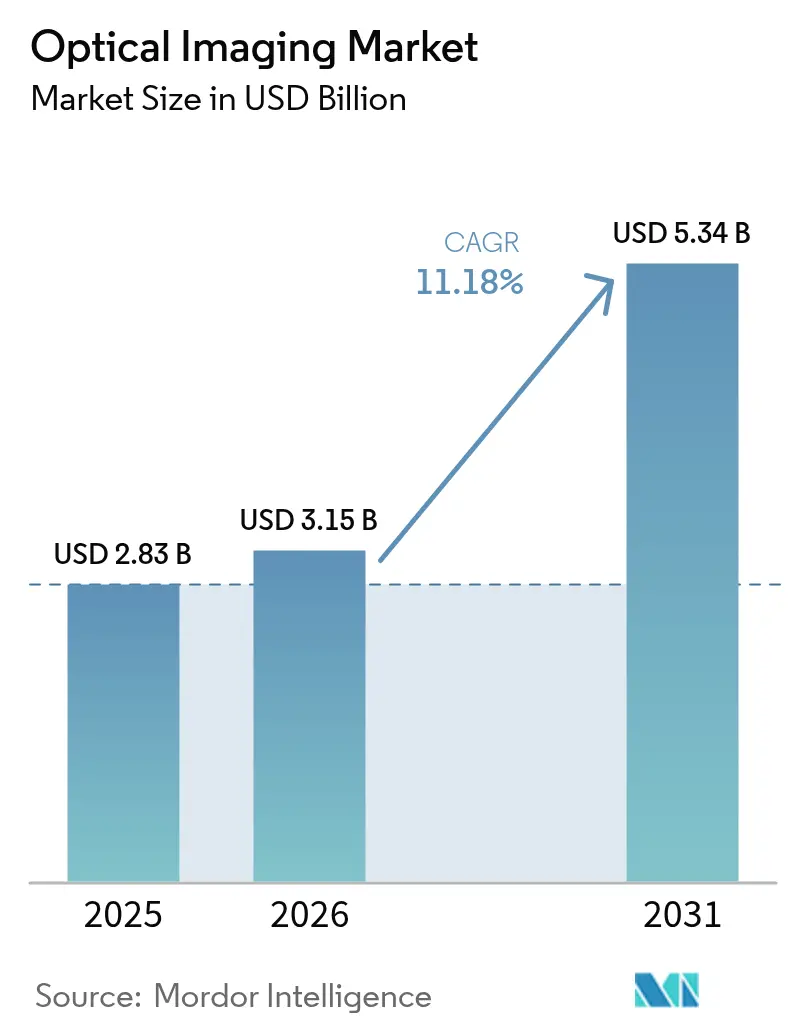
| Market Size (2026) | USD 3.15 Billion |
| Market Size (2031) | USD 5.34 Billion |
| Growth Rate (2026 - 2031) | 11.18% CAGR |
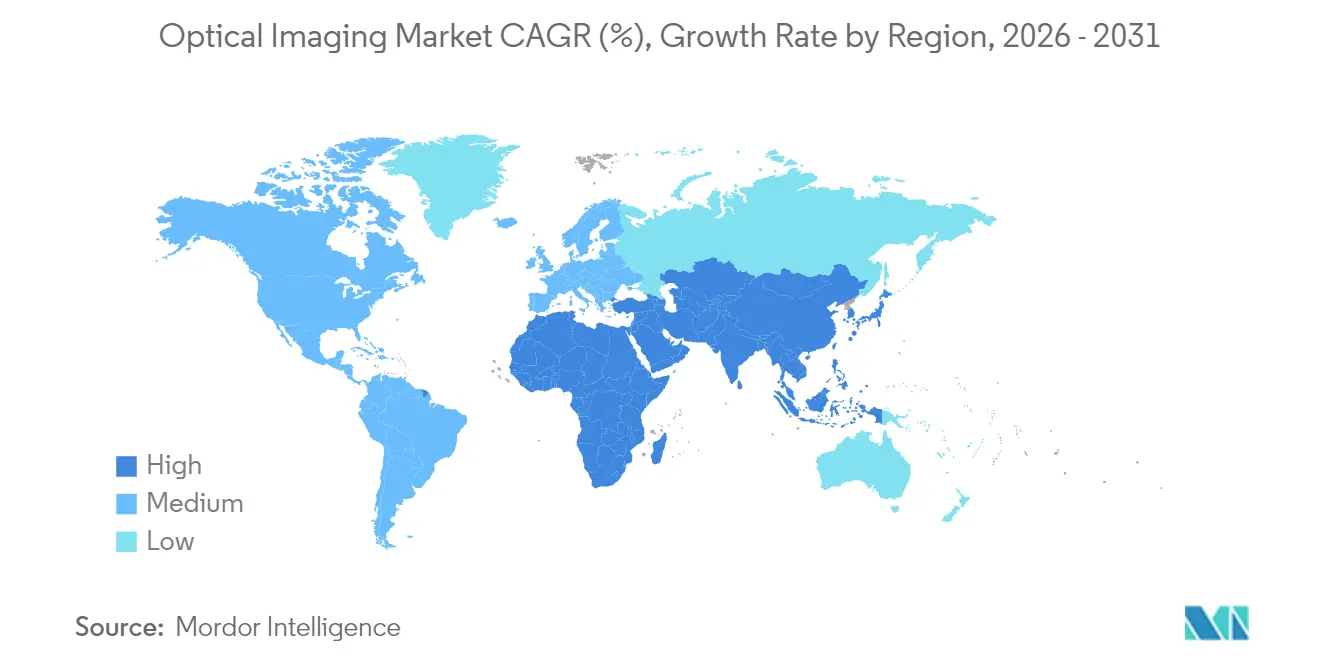
| Fastest Growing Market | Asia |
| Largest Market | North America |
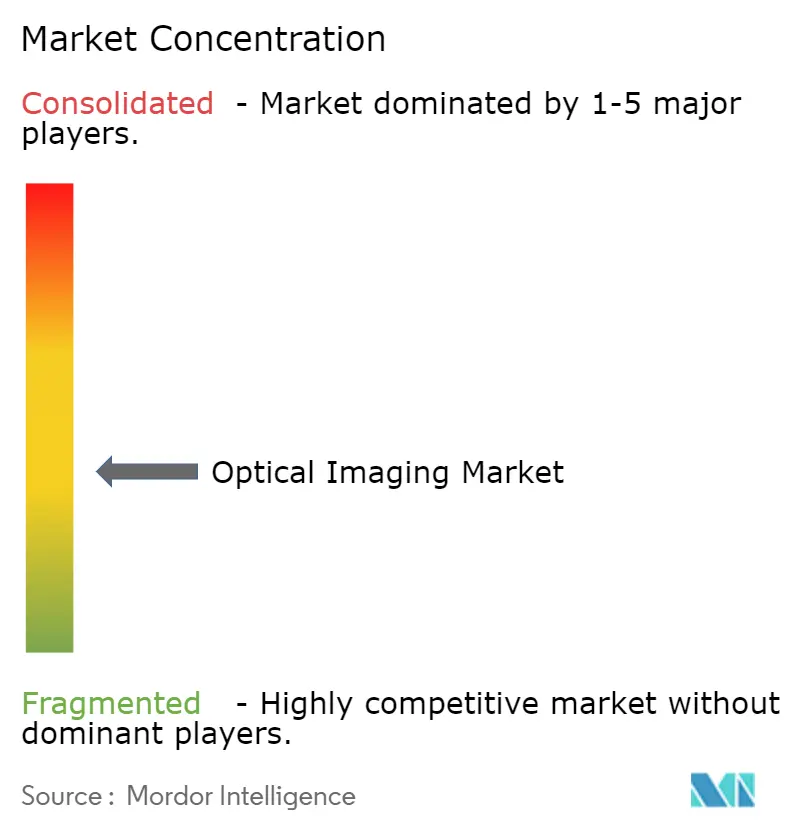
| Market Concentration | Medium |
Major Players *Disclaimer: Major Players sorted in no particular order Image © Mordor Intelligence. Reuse requires attribution under CC BY 4.0. | |
Optical Imaging Market Analysis by Mordor Intelligence
The optical imaging market size is expected to grow from USD 2.83 billion in 2025 to USD 3.15 billion in 2026 and is forecast to reach USD 5.34 billion by 2031 at 11.18% CAGR over 2026-2031. Growth is being propelled by steady breakthroughs in high-resolution imaging systems, the shift toward non-invasive diagnostics, and widening use in ophthalmology, cardiology, oncology, dermatology, and neurology. Integration with artificial intelligence is improving detection accuracy and workflow speed, while multi-modal platforms that merge optical coherence tomography (OCT) with photoacoustic or hyperspectral tools are expanding clinical value. Semiconductor shortages are nudging suppliers to redesign detectors and pursue vertical integration, yet the optical imaging market continues to benefit from resilient procurement budgets in hospitals, ambulatory surgery centers, and research labs. Asia-Pacific’s rapid uptake of handheld OCT for diabetic eye screening and North America’s favorable reimbursement for OCT-guided coronary interventions further reinforce the expansion path.
Key Report Takeaways
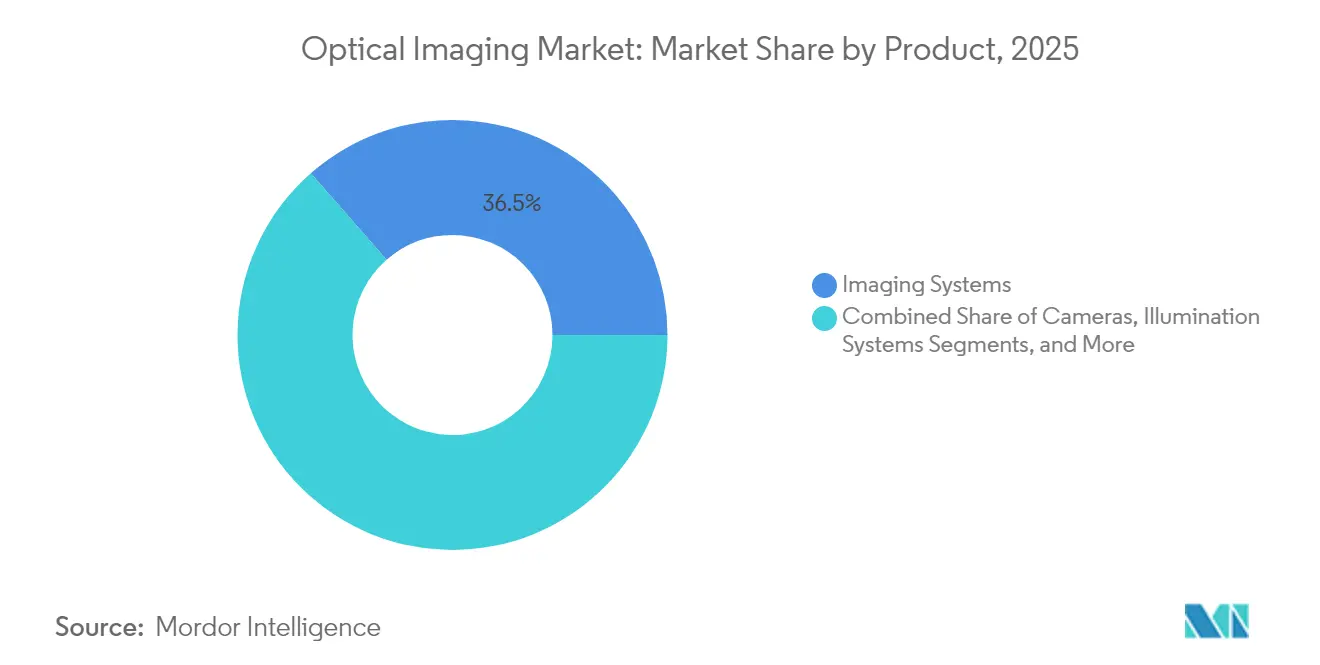
- By product, Imaging Systems led with 36.45% revenue share in 2025, whereas Cameras are forecast to post the fastest 12.1% CAGR through 2031.
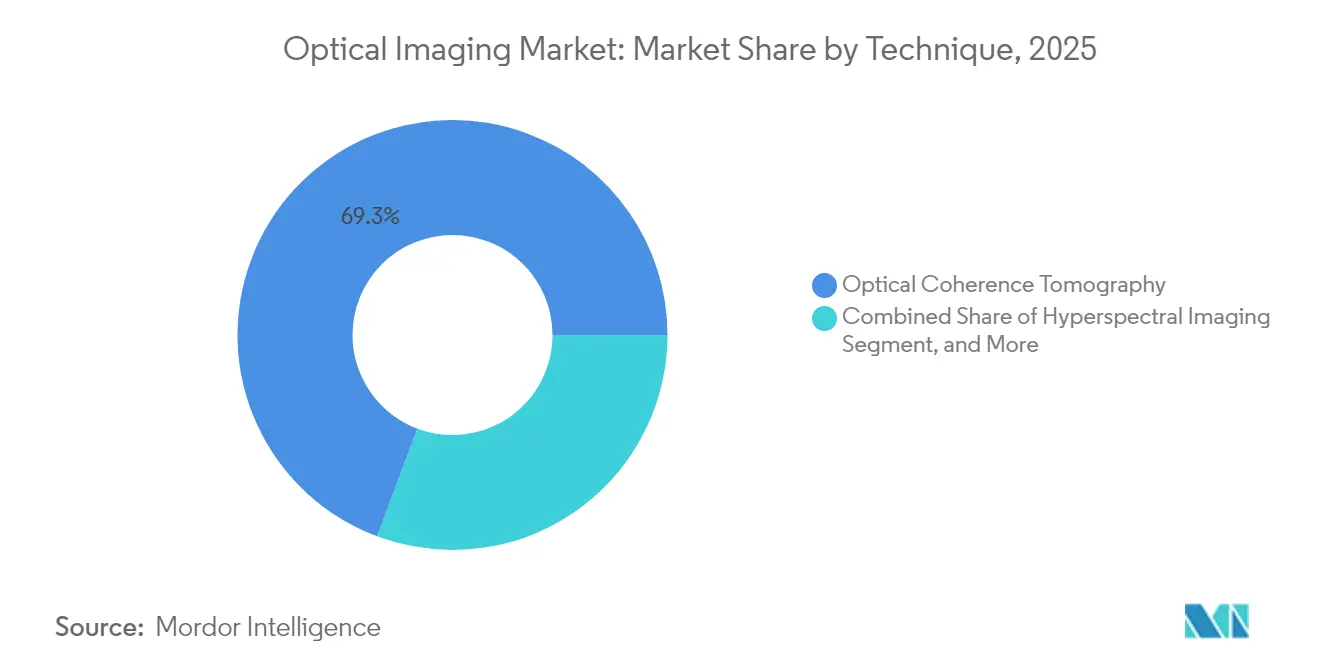
- By technique, Optical Coherence Tomography accounted for 69.30% of the optical imaging market share in 2025; Photoacoustic Tomography is projected to grow at 13.12% CAGR to 2031.
- By application, Ophthalmology held 34.10% of the optical imaging market size in 2025, while Oncology is advancing at a 14.58% CAGR to 2031.
- By end-user, Hospitals & Clinics retained a 44.25% share in 2025; Research & Diagnostic Laboratories are poised for a 12.36% CAGR over 2026-2031.
- By Region, North America commanded 39.40% of 2025 revenue, yet Asia-Pacific is expected to achieve a 12.02% CAGR, the highest among all regions.
Note: Market size and forecast figures in this report are generated using Mordor Intelligence’s proprietary estimation framework, updated with the latest available data and insights as of 2026.
Global Optical Imaging Market Trends and Insights
Drivers Impact Analysis*
| Driver | (~) % Impact on CAGR Forecast | Geographic Relevance | Impact Timeline |
|---|---|---|---|
| Accelerated deployment of intra-operative optical imaging systems in ambulatory surgery centers | +2.8% | North America & EU | Medium term (2-4 years) |
| Expanding reimbursement coverage for OCT-guided PCI in the United States & Japan | +2.3% | United States & Japan | Medium term (2-4 years) |
| Rapid adoption of handheld OCT for diabetic retinopathy screening in primary-care settings | +2.0% | Asia, spillover to North America | Short term (≤ 2 years) |
| Integration of AI-based spectral algorithms in dermatology diagnostic workflows | +1.7% | EU clinics, North America | Medium term (2-4 years) |
| Surge in pharma demand for label-free optical sectioning to accelerate oncology drug discovery | +1.4% | Global | Long term (≥ 4 years) |
| Military funding for photoacoustic tomography in trauma triage | +1.1% | Middle-East, spillover to North America | Long term (≥ 4 years) |
| Source: Mordor Intelligence | |||
Accelerated deployment of intra-operative optical imaging systems in ambulatory surgery centers
Ambulatory surgery centers (ASCs) performed more than 23 million procedures in the United States in 2024, a 15% year-on-year rise as payers reposition surgeries to outpatient settings. Compact intra-operative optical platforms, exemplified by UCLA Health’s Dynamic Optical Contrast Imaging device, are gaining traction because they delineate tumor margins in real time and trim procedure time by 20%, boosting ASC throughput. Capital spending on these systems is justified by 35-50% cost savings relative to hospital surgeries and by growing insurer support for outpatient pathways. Reimbursement shifts are expected to drive ASC share of all surgeries to 68% by 2030, feeding demand for portable, network-ready optical rigs and widening the optical imaging market base.[1]Kevin Hermosura, “Dynamic Optical Contrast Imaging Enhances Cancer Surgery,” UCLA Health, uclahealth.org
Expanding reimbursement coverage for OCT-guided PCI in the United States & Japan
The OCCUPI trial reported a 4.9% composite event rate for OCT-guided PCI at one year compared with 9.5% for angiography alone, sparking policy changes that lift reimbursement by 12% in the United States and broaden coverage in Japan. Providers gain a 22% drop in repeat procedures, offsetting higher per-procedure costs and spurring adoption across high-risk coronary lesions. Utilization of OCT in coronary interventions is forecast to climb from 15% in 2024 to about 35% by 2028, embedding optical imaging deeper into interventional cardiology workflows.[2]Michael O’Riordan, “OCCUPI Trial Shows Benefits of OCT-Guided PCI,” TCTMD, tctmd.com
Rapid adoption of handheld OCT for diabetic retinopathy screening in primary care settings
Lightweight OCT scanners priced roughly 60% below tabletop systems are entering Asia’s clinics and pharmacies, enabling same-visit exams for diabetic patients. The Lancet documented a 43% jump in screening compliance when AI-enhanced OCT was offered in primary care, compressing diagnosis time from weeks to minutes. National programs in India and China screened more than 3 million patients in 2024, validating the model and encouraging public health agencies elsewhere to follow suit. The American Diabetes Association’s call for annual OCT screening further cements handheld devices as a primary-care staple.[3]Rebecca Voelker, “Handheld OCT Boosts Diabetic Eye Screening Compliance,” The Lancet, thelancet.com
Integration of AI-based spectral algorithms in dermatology diagnostic workflows
Multispectral cameras coupled with deep-learning classifiers are achieving 95% sensitivity and 86% specificity for melanoma detection, outperforming average dermatologist accuracy. Clinics adopting these systems report a 30% reduction in unnecessary biopsies and a 25% rise in early malignant lesion detection. As regulatory clearances accelerate and cloud-based software lowers entry costs, penetration is projected to reach 40% of dermatology practices in developed markets by 2027, adding momentum to the optical imaging market.[4]Youn-Hee Nahm, “AI-Assisted Spectral Imaging in Melanoma Detection,” International Journal of Dermatology, onlinelibrary.wiley.com
Restraints Impact Analysis*
| Restraint | (~) % Impact on CAGR Forecast | Geographic Relevance | Impact Timeline |
|---|---|---|---|
| Capital-intensive shift from benchtop to integrated operating-room imaging suites | -1.7% | Global, with higher impact in emerging markets | Medium term (2-4 years) |
| Limited reimbursement for dental optical imaging procedures in Europe | -1.4% | Europe | Short term (≤ 2 years) |
| Scarcity of hyperspectral imaging experts slows clinical validation in emerging Asia | -1.1% | Asia-Pacific, particularly India and Southeast Asia | Medium term (2-4 years) |
| Phototoxicity concerns restricting repeat imaging in paediatric neurology | -0.9% | Global | Long term (≥ 4 years) |
| Source: Mordor Intelligence | |||
Capital-intensive shift from benchtop to integrated operating-room imaging suites
Fully integrated optical suites bundling OCT, fluorescence, and navigation cost USD 1.5-2.5 million per theater, triple to quadruple benchtop setups, and require extensive infrastructure rewiring. Hospitals also carry 15-20% extra ownership costs over five years for service contracts and specialist training. Consequently, only 23% of eligible hospitals had completed full integration in 2024, with many deferring upgrades or phasing modules over multiple budget cycles. Emerging economies face sharper constraints, slowing penetration despite clear clinical benefits.
Limited reimbursement for dental optical imaging procedures in Europe
Insurance frameworks across Germany, France, Italy, Spain, and the UK cover fewer than 15% of advanced dental OCT or photoacoustic scans, labeling them premium services. Adoption sits at 8% of European dental practices versus 27% in North America, producing a two-tier market divided between upscale clinics and standard practices that rely on radiography. Efforts by industry and professional associations to harmonize reimbursement codes are ongoing, yet until policy alignment occurs, uptake in mainstream dentistry will lag, tempering overall optical imaging market growth.
*Our forecasts treat driver/restraint impacts as directional, not additive. The impact forecasts reflect baseline growth, mix effects, and variable interactions.
Segment Analysis
By Product: Cameras Disrupt Traditional Imaging Systems
Imaging Systems held 36.45% of revenue in 2025 on the strength of turnkey consoles used across ophthalmology, cardiology, and research settings. The optical imaging market size for this segment is forecast to expand steadily as vendors augment consoles with AI software and multi-modal add-ons. Rising demand for real-time guidance in minimally invasive surgery maintains hospital investment, even as procurement teams grapple with semiconductor shortages that inflate detector costs. Meanwhile, high-speed Cameras are redefining performance thresholds. Phantom High-Speed’s S710 camera achieves 4,000 fps in holographic retinal blood-flow imaging, enabling precise Doppler calculations that enhance vascular diagnostics. This technical leap aligns with a projected 12.1% CAGR through 2031, the fastest within the product spectrum.
Next-generation illumination engines using narrow-band LEDs and super-continuum lasers sustain interest in the Illumination Systems segment as surgeons seek tissue-specific contrast. Software solutions, once peripheral, now anchor differentiation because AI algorithms deliver automated segmentation, vessel quantification, and anomaly flagging. Lenses remain indispensable: advances in aspheric and gradient-index optics boost depth penetration and reduce chromatic aberration, elevating image clarity. To mitigate chip shortages, TDK’s Spin Photo Detector leverages magnetic elements to detect light at ultra-high speeds, opening a path to sidestep conventional semiconductor bottlenecks and stabilize component supply chains.


By Application: Oncology Emerges as Growth Catalyst
Ophthalmology retained the largest slice at 34.10% in 2025 due to entrenched OCT use for retinal disease management. Adaptive optics technologies are now revealing photoreceptor mosaics and choriocapillaris flow, allowing pre-symptomatic detection of macular disorders. In parallel, Oncology is gaining momentum with a 14.58% CAGR because optical imaging guides margin assessment during tumor resection and tracks vascular response during therapy. Photoacoustic contrast agents targeting hypoxic zones are enabling centimeter-deep visualization of tumor microenvironments in real time. Consequently, the optical imaging market share for oncology applications is set to rise as tertiary hospitals standardize intraoperative optical guidance.
Cardiology follows closely: OCT-guided percutaneous coronary intervention is proving superior to angiography alone in complex lesion management. The optical imaging market size for cardiology is projected to accelerate as more payers authorize coverage. Dermatology benefits from AI-enabled spectral scanners that cut biopsies and improve triage of suspicious lesions. Neurology and Dentistry niches are smaller yet innovative: intraoperative brain OCT tracks tissue mechanics, while dental OCT aids early caries detection without ionizing radiation. Pharmaceutical research groups employ label-free sectioning to visualize drug-cell interactions, shortening oncology drug discovery cycles.
By Technique: Photoacoustic Tomography Gains Momentum
Optical Coherence Tomography dominated with 69.30% share in 2025 because it combines micrometer-scale resolution with rapid acquisition. Dynamic contrast OCT is breaking new ground by mapping live cell activity without exogenous labels, widening appeal in neurology and regenerative medicine. At the same time, Photoacoustic Tomography is surging on a 13.12% CAGR trajectory. By converting absorbed optical energy into ultrasonic waves, PAT provides optical contrast at ultrasonic resolution several centimeters deep, facilitating vascular imaging beyond the reach of pure optical methods. The International Photoacoustic Standardization Consortium’s protocols and the introduction of CPT codes are smoothing clinical entry, which should enlarge the optical imaging market size attributed to PAT procedures.
Near-Infrared Spectroscopy continues to assist in bedside tissue-oxygenation monitoring in oncology and neonatal care, while Hyperspectral Imaging addresses surgical guidance by differentiating perfused versus ischemic tissue. Hyperspectral datasets remain computationally intensive, but cloud-based analytics and lighter push-broom cameras are making operating-room deployment feasible. Collaborative research focuses on compressive sensing algorithms that shrink acquisition time, potentially lifting adoption where surgical schedules are tight.
By End-User: Research Labs Accelerate Innovation Adoption
Hospitals & Clinics captured 44.25% of spending in 2025, embedding multi-modal optical imaging towers in operating rooms and catheterization labs. Many centers bundle optical modalities with robotic systems, aiming to elevate surgical precision and shorten recovery times. The optical imaging market continues to benefit from hospitals’ shift toward value-based care that rewards diagnostics enabling early intervention. Research & Diagnostic Laboratories, however, are the fastest movers at 12.36% CAGR. Pharmaceutical firms rely on label-free optical sectioning to study cell mechanics and drug uptake in living tissues, compressing lead-optimization timelines and lowering attrition in oncology pipelines.
Diagnostic Imaging Centers expand service menus by adding ocular, coronary, and dermatologic optical scans, addressing outpatient demand and relieving hospital backlogs. Ambulatory surgery centers demand portable, network-enabled optical scanners that align with compact OR footprints and quick turnover. Specialized clinics in dermatology and dentistry are adopting handheld or cart-based devices, bridging the gap between point-of-care cost efficiency and advanced imaging quality.
Geography Analysis
North America held 39.40% share in 2025, anchored by strong reimbursement and an innovation ecosystem linking universities, startups, and large device makers. The FDA’s green light for AI-assisted skin-cancer optical readers in 2024 accelerated cross-specialty adoption, while Duke University’s handheld OCT prototypes advance point-of-care eye exams. The optical imaging market size in the region will keep growing as insurers widen coverage for AI-integrated diagnostics and as capital budgets target hybrid OR upgrades.
Asia-Pacific is the fastest-growing cluster, projected at a 12.02% CAGR. Governments in China, India, and Japan are funding domestic manufacturing, lowering import reliance, and subsidizing upgrades for rural clinics. Widespread use of handheld OCT in diabetic retinopathy screening is closing access gaps. Nevertheless, the lack of hyperspectral imaging specialists slows clinical trials, particularly in India and Southeast Asia. Cross-border training partnerships aim to build a talent pipeline that sustains longer-term adoption. Despite these hurdles, the optical imaging market in Asia-Pacific benefits from rising healthcare investment and high diabetes prevalence that drives retinal screening demand.
Europe maintains a sizeable base supported by robust research grants and academic hospital networks. German, French, and UK centers lead clinical validation in dermatology and neurology, yet dental applications suffer under fragmented reimbursement. Only 8% of dental practices use optical imaging because private pay models limit patient uptake. Eastern European health systems, meanwhile, seek lower-cost platforms to address unmet oncology imaging needs. The Middle East and Africa, while smaller, record steady uptake in specialist hospitals across the UAE and Saudi Arabia, buoyed by government-backed infrastructure spending and military interest in trauma imaging.

Competitive Landscape
The optical imaging market is moderately fragmented, with incumbents such as Carl Zeiss Meditec, Leica Microsystems, and Olympus competing alongside agile specialists like Optovue and Damae Medical. Strategic focus has shifted from hardware differentiation to integrated software ecosystems that leverage AI and cloud connectivity. Recurring revenue from consumables and analytics subscriptions accounted for 47% of leading vendors’ turnover in 2024, underscoring the transition to service-centric models.
Semiconductor shortages triggered by a 75% jump in germanium prices since January 2023 compelled companies to redesign detectors, qualify second-source suppliers, and in some cases acquire upstream component makers. TDK’s Spin Photo Detector illustrates how magnetic-based photonics could relieve pressure on traditional supply chains and unlock ultrafast light detection for next-gen systems. Meanwhile, Carl Zeiss Meditec reported EUR 2,066.1 million revenue in fiscal 2024, crediting premium intraocular lenses and advanced imaging for segment growth.
White-space opportunities arise in point-of-care scenarios. Portable OCT and photoacoustic units tailored for ASCs and field hospitals broaden reach beyond tertiary centers. AI-augmented dermatology cameras are penetrating outpatient clinics, driven by rising skin-cancer incidence and consumer demand for quick triage. Competitive intensity is poised to heighten as multinational imaging firms acquire niche AI startups to add proprietary algorithms and accelerate regulatory approvals.
Optical Imaging Industry Leaders
Carl Zeiss AG
Leica Microsystems (Danaher Corporation)
Topcon Corporation
Canon Medical Systems Corporation (Canon Inc.)
Koninklijke Philips NV (Philips)
- *Disclaimer: Major Players sorted in no particular order

Recent Industry Developments
- April 2025: TDK unveiled the Spin Photo Detector, which uses magnetic elements rather than semiconductors for ultra-high-speed light detection and photonic integrated circuit compatibility.
- March 2025: UCLA Health introduced the Dynamic Optical Contrast Imaging system, validated in more than 150 cancer surgeries for real-time margin delineation.
- January 2025: University of Washington researchers demonstrated 3D blood-flow imaging for eye care, enabling unprecedented visualization of retinal hemodynamics.
- January 2025: Carl Zeiss Meditec Group reported continued ophthalmology momentum as premium intraocular lenses are projected to reach 15% unit share by 2027, up from 12% in 2021.


Global Optical Imaging Market Report Scope
Optical imaging examines cellular and molecular activity in live tissue, including that of animals and plants. The information is ultimately taken from the biomolecular functions and tissue makeup. Photons of light with wavelengths ranging from ultraviolet to near-infrared are used to create images.
The optical imaging market is segmented by product (imaging systems [optical imaging systems, spectral imaging systems], illumination systems, lenses, and software), application (ophthalmology, dentistry, dermatology, cardiology, neurology, oncology, biotechnology and research, and other applications), technique (optical coherence tomography, near-infrared spectroscopy, hyperspectral imaging, photo-acoustic tomography), end user (diagnostic imaging center, hospitals and clinics, research laboratories, and other end users), geography (North America [United States, Canada], Europe [Germany, United Kingdom, France, Rest of Europe], Asia-Pacific [China, Japan, India, Rest of Asia-Pacific], Latin America, and Middle East and Africa). The report offers market forecasts and size in value (USD) for all the above segments.
By Product
| Imaging Systems | Optical Imaging Systems |
| Spectral Imaging Systems | |
| Cameras | |
| Illumination Systems | |
| Lenses | |
| Software |
By Application
| Ophthalmology |
| Dentistry |
| Dermatology |
| Cardiology |
| Neurology |
| Oncology |
| Biotechnology and Research |
| Other Applications |
By Technique
| Optical Coherence Tomography |
| Near-Infrared Spectroscopy |
| Hyperspectral Imaging |
| Photoacoustic Tomography |
By End-User
| Hospitals and Clinics |
| Diagnostic Imaging Centres |
| Research and Diagnostic Laboratories |
| Other End-Users |
By Geography
| North America | United States |
| Canada | |
| Mexico | |
| South America | Brazil |
| Argentina | |
| Chile | |
| Peru | |
| Rest of South America | |
| Europe | Germany |
| United Kingdom | |
| France | |
| Italy | |
| Spain | |
| Rest of Europe | |
| Asia-Pacific | China |
| Japan | |
| South Korea | |
| India | |
| Australia | |
| New Zealand | |
| Rest of Asia-Pacific | |
| Middle East | United Arab Emirates |
| Saudi Arabia | |
| Turkey | |
| Rest of Middle East | |
| Africa | South Africa |
| Rest of Africa |
| By Product | Imaging Systems | Optical Imaging Systems |
| Spectral Imaging Systems | ||
| Cameras | ||
| Illumination Systems | ||
| Lenses | ||
| Software | ||
| By Application | Ophthalmology | |
| Dentistry | ||
| Dermatology | ||
| Cardiology | ||
| Neurology | ||
| Oncology | ||
| Biotechnology and Research | ||
| Other Applications | ||
| By Technique | Optical Coherence Tomography | |
| Near-Infrared Spectroscopy | ||
| Hyperspectral Imaging | ||
| Photoacoustic Tomography | ||
| By End-User | Hospitals and Clinics | |
| Diagnostic Imaging Centres | ||
| Research and Diagnostic Laboratories | ||
| Other End-Users | ||
| By Geography | North America | United States |
| Canada | ||
| Mexico | ||
| South America | Brazil | |
| Argentina | ||
| Chile | ||
| Peru | ||
| Rest of South America | ||
| Europe | Germany | |
| United Kingdom | ||
| France | ||
| Italy | ||
| Spain | ||
| Rest of Europe | ||
| Asia-Pacific | China | |
| Japan | ||
| South Korea | ||
| India | ||
| Australia | ||
| New Zealand | ||
| Rest of Asia-Pacific | ||
| Middle East | United Arab Emirates | |
| Saudi Arabia | ||
| Turkey | ||
| Rest of Middle East | ||
| Africa | South Africa | |
| Rest of Africa | ||


Key Questions Answered in the Report
What is the current value of the optical imaging market?
The optical imaging market is valued at USD 3.15 billion in 2026.
How fast is the optical imaging market expected to grow?
It is forecast to expand at an 11.18% CAGR, reaching USD 5.34 billion by 2031.
Which technique holds the largest optical imaging market share?
Optical Coherence Tomography commands 69.30% of revenue, making it the dominant technique.
Why is Asia-Pacific the fastest-growing region for optical imaging?
Rapid adoption of handheld OCT for diabetic eye screening and expanding healthcare investment drive a projected 12.02% CAGR.
What factor is most boosting oncology applications in optical imaging?
Surge in intra-operative optical imaging for real-time tumor margin assessment is propelling oncology applications at a 14.58% CAGR.
How are semiconductor shortages influencing optical imaging device design?
Firms are investing in alternative detector technologies like magnetic-based Spin Photo Detectors to reduce reliance on scarce materials and stabilize supply.
Page last updated on:


