
Technology, Media and Telecom
5th MayPricing Strategy for Semiconductor Components
3 Min Read
The Unified Communication As-A-Service in Energy Market Report Segments the Industry Into by Component (Telephony, Collaboration Tools, Unified Messaging, Conferencing, and More), Deployment Model (Private, Public, and Hybrid), Enterprise Size (Large Enterprise, and Small and Medium Enterprise), Energy Subsector (Oil and Gas, Power Generation, and More), and Geography.
Market Overview
| Study Period | 2020 - 2031 |
|---|---|
| Market Size (2026) | USD 2.24 Billion |
| Market Size (2031) | USD 3.93 Billion |
| Growth Rate (2026 - 2031) | 11.88 % CAGR |
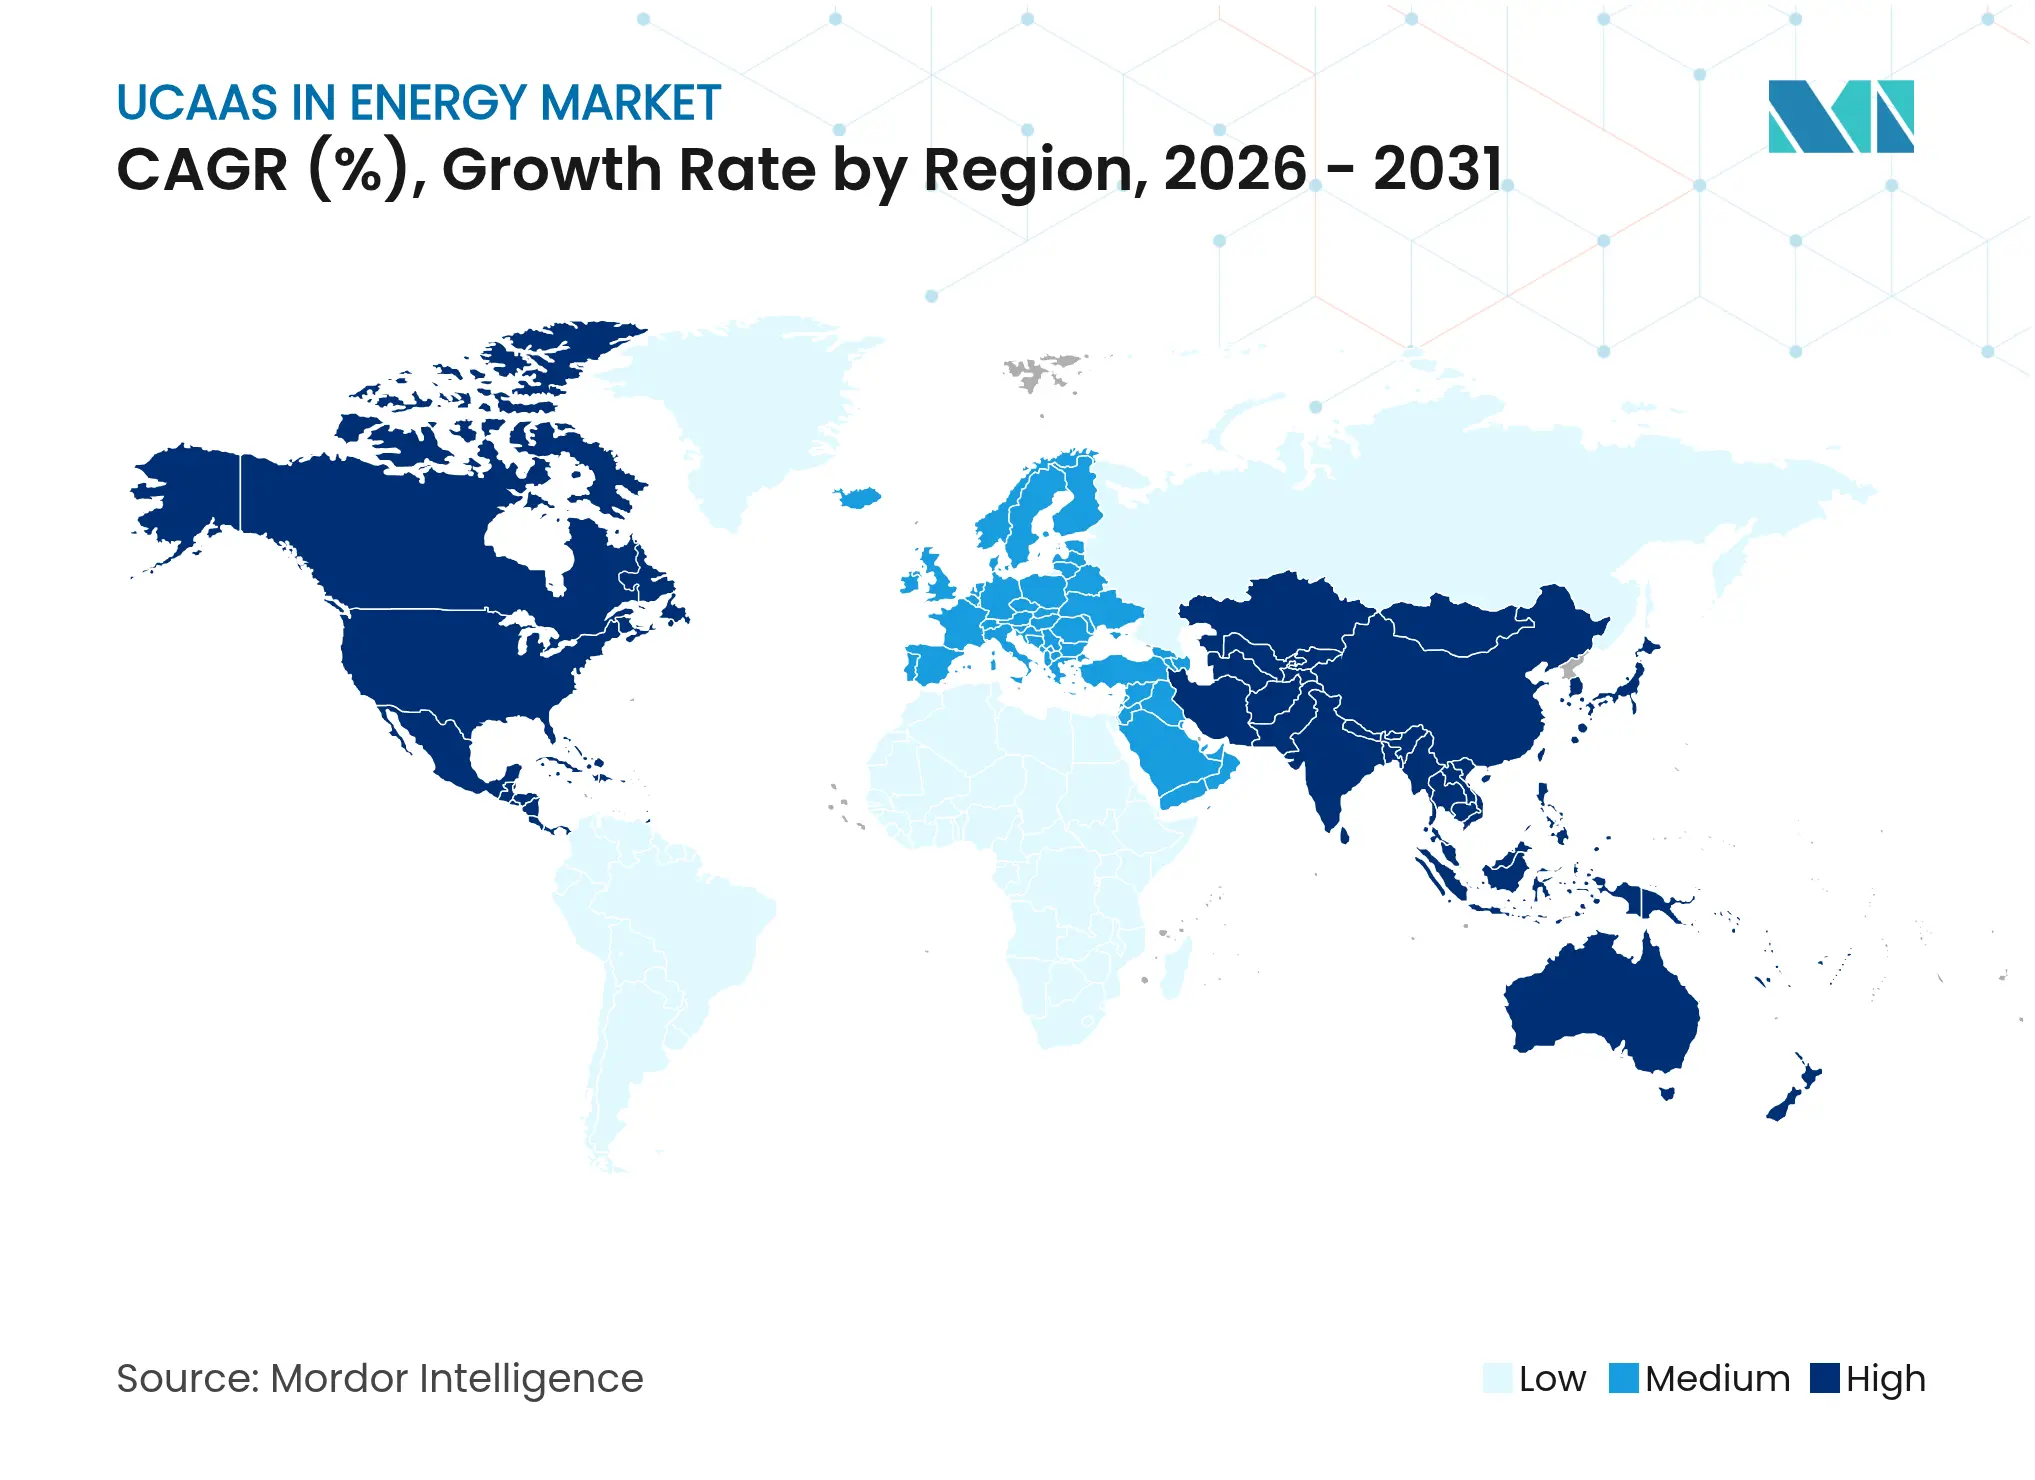
| Fastest Growing Market | Asia Pacific |
| Largest Market | North America |
| Market Concentration | Medium |
Major Players *Disclaimer: Major Players sorted in no particular order. Image © Mordor Intelligence. Reuse requires attribution under CC BY 4.0. |
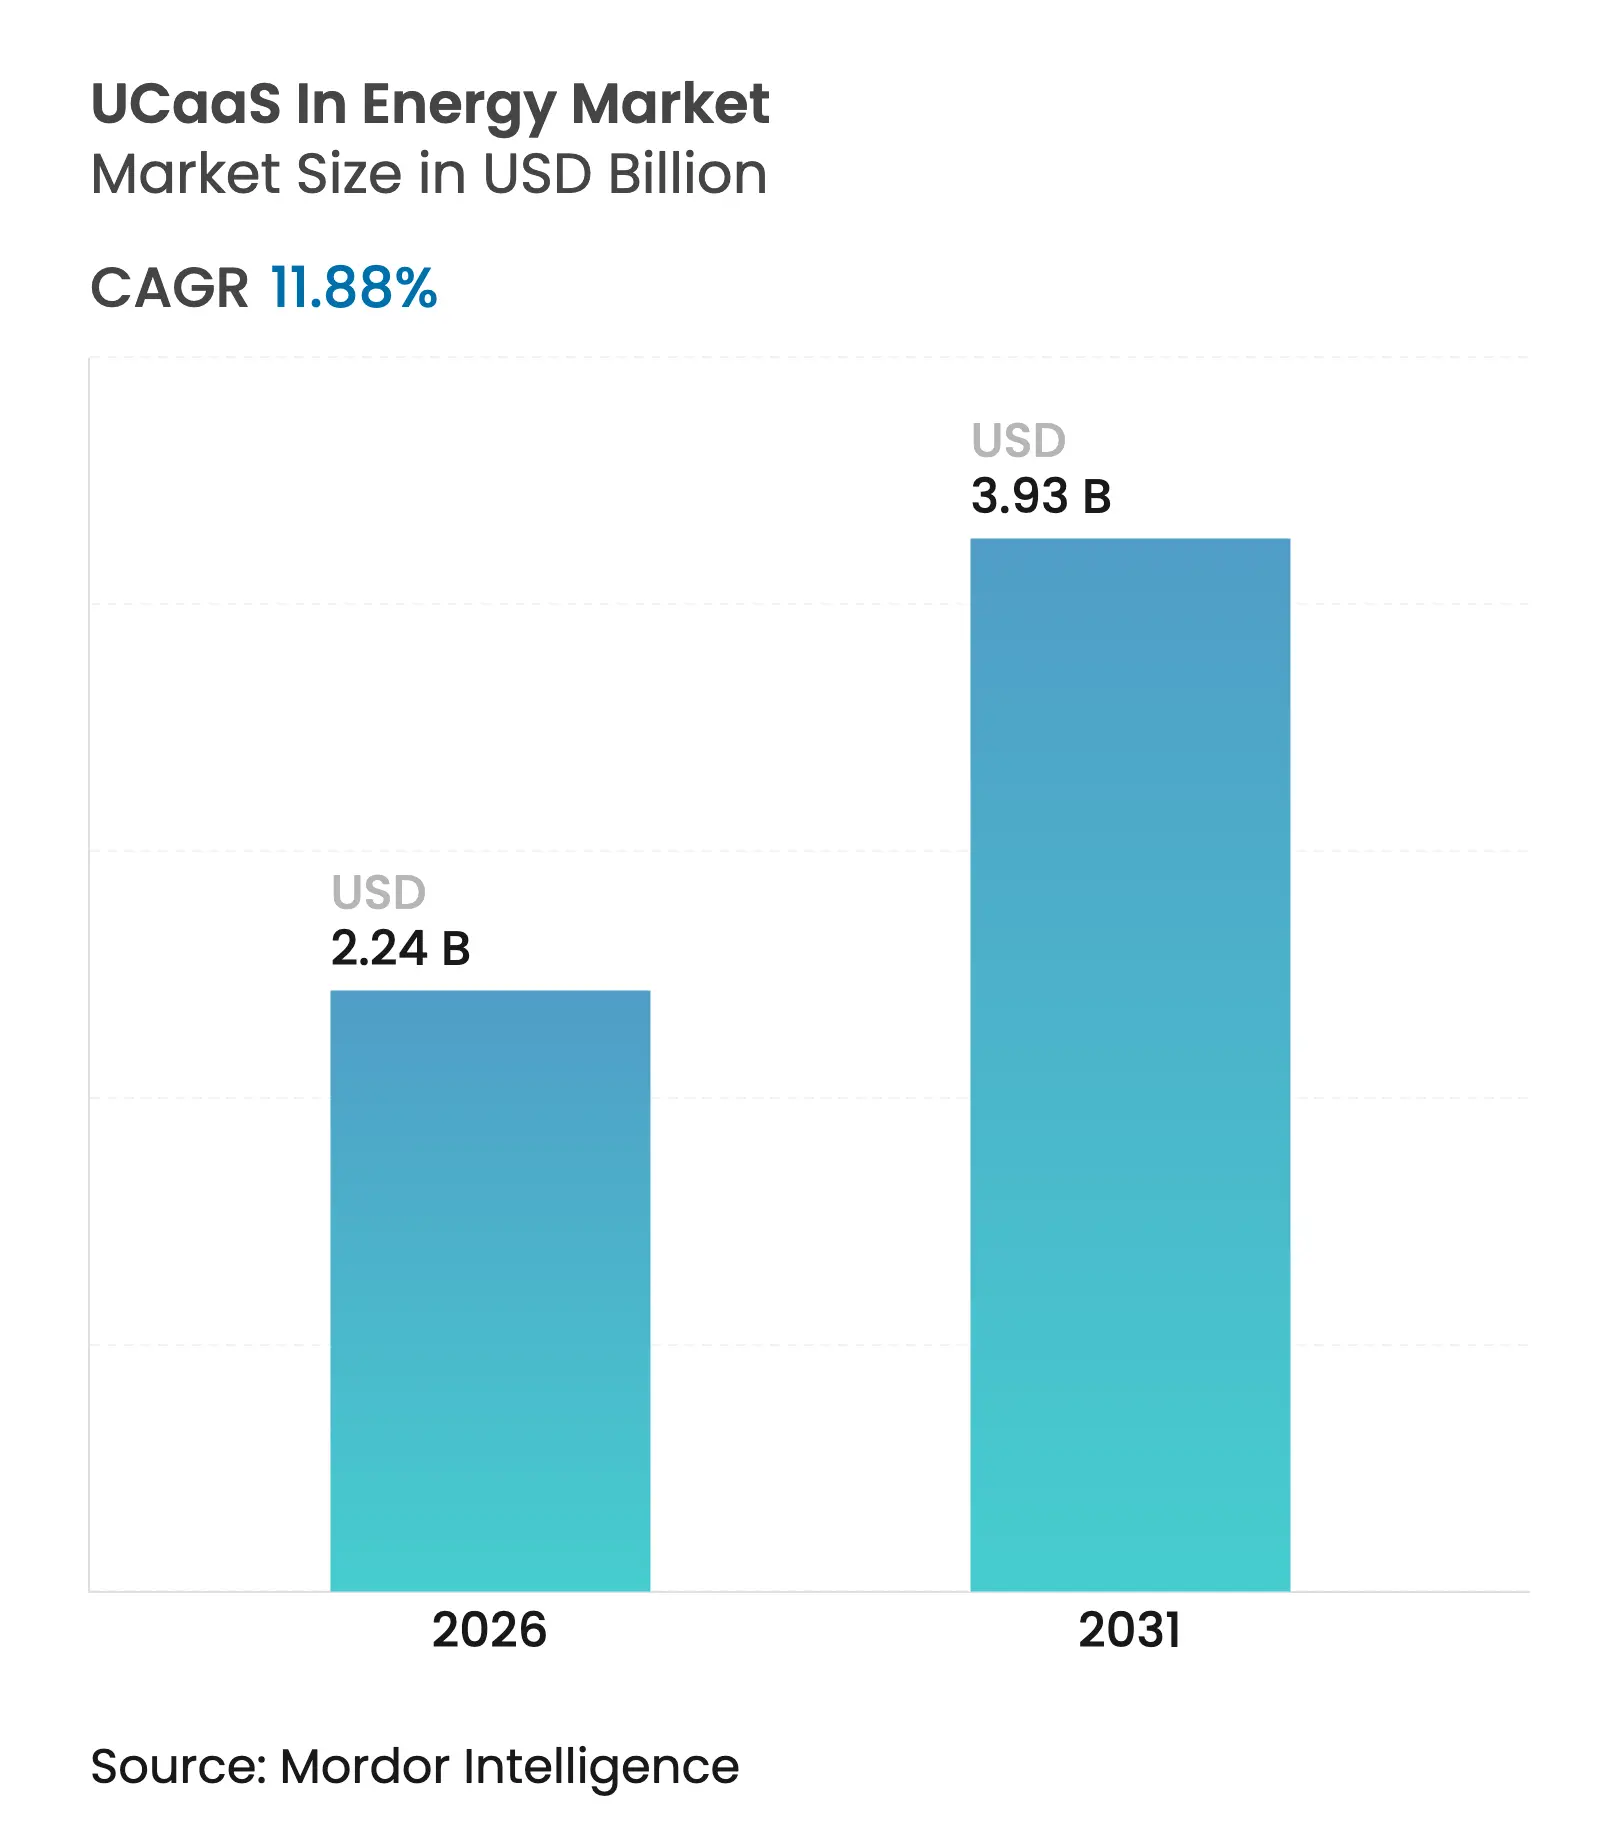
The UCaaS in energy market size was valued at USD 2 billion in 2025 and estimated to grow from USD 2.24 billion in 2026 to reach USD 3.93 billion by 2031, at a CAGR of 11.88% during the forecast period (2026-2031). Rapid digitalization, rising field-worker collaboration needs and the fusion of operational technology with information technology are accelerating adoption. Utilities are modernizing grids, oil and gas operators are digitizing wells, and renewable asset owners are deploying cloud-native tools, all of which demand unified communications that operate reliably across harsh, distributed environments. Edge architectures, private-5G connectivity and consumption-based pricing lower total cost of ownership, while cyber-resilience mandates push firms to standardize on secure, unified voice and video platforms. Competitive intensity is moderate; large telecom groups, cloud vendors and energy-focused specialists seek share through hybrid deployments and domain-specific features. Although integration complexity and data-sovereignty rules slow some projects, regulatory support for modern, AI-enabled communications continues to unlock opportunities across segments and regions.
Key Report Takeaways
Note: Market size and forecast figures in this report are generated using Mordor Intelligence's proprietary estimation framework, updated with the latest available data and insights as of 2026.
Drivers Impact Analysis
| Driver | (~) % Impact on CAGR Forecast | Geographic Relevance | Impact Timeline | |||
|---|---|---|---|---|---|---|
Proliferation of cloud-native energy IT ecosystems
Proliferation of cloud-native energy IT ecosystems
| +2.8% | Global, with early adoption in North America and Europe | Medium term (2-4 years) |
(~) % Impact on CAGR Forecast
:+2.8% |
Geographic Relevance
:
Global, with early adoption in North America and
Europe
|
Impact Timeline
:
Medium term (2-4 years)
|
Edge-enabled remote asset collaboration
Edge-enabled remote asset collaboration
| +2.1% | Asia-Pacific core, spill-over to North America | Short term (≤ 2 years) | |||
5G private networks in oilfields and plants
5G private networks in oilfields and plants
| +1.9% | North America and Middle East, expanding to Asia-Pacific | Medium term (2-4 years) | |||
Vendor shift to consumption-based pricing
Vendor shift to consumption-based pricing
| +1.6% | Global, with faster uptake in developed markets | Short term (≤ 2 years) | |||
O-RAN integration with UCaaS for field comms
O-RAN integration with UCaaS for field comms
| +1.4% | Asia-Pacific leading, followed by Europe | Long term (≥ 4 years) | |||
Cyber-resilient voice/video mandates by regulators
Cyber-resilient voice/video mandates by regulators
| +1.2% | North America and Europe, expanding globally | Medium term (2-4 years) | |||
| Source: Mordor Intelligence | ||||||
Proliferation of Cloud-Native Energy IT Ecosystems
Major operators such as Aramco are rolling out industrial distributed clouds that bring compute and storage closer to assets, enabling real-time analytics that demand equally agile communications [1]Taylor Robinette, “Aramco, Armada, and Microsoft Collaborate to Deploy World’s First Industrial Distributed Cloud,” Armada, armada.ai. Cloud-native UCaaS platforms integrate via open APIs, streamline provisioning and allow energy firms to spin up new voice, video and messaging services alongside edge workloads. Shifting from on-premises PBXs to scalable, cloud-centric systems also helps reduce lifecycle costs while satisfying regulatory patch-management requirements. As more operational applications become container-based, unified communications embedded within those micro-services enable seamless data flow between control rooms and field teams, driving a tangible uplift in productivity and safety.
Edge-Enabled Remote Asset Collaboration
Chevron and Shell deploy edge gateways that monitor wellhead sensors and instantly trigger voice or video calls when anomalies surface, lowering downtime and travel costs. Augmented-reality headsets let technicians overlay schematics while receiving expert guidance through UCaaS video streams that stay local when connectivity falters. Low-latency processing at the edge ensures critical alerts route through redundant channels, preserving safety compliance even in offshore or desert sites. Edge-enabled workflows therefore upgrade collaboration quality without overloading backhaul links, strengthening the business case for unified communications embedded at site level.
5G Private Networks in Oilfields and Plants
Vodafone’s dedicated 5G network for Centrica’s gas terminal shows how ultra-reliable, low-latency connectivity underpins autonomous robots, HD video inspections and massive sensor arrays—all of which require tightly integrated voice and video channels. Private spectrum gives operators full control over QoS and security, letting them pipe UCaaS traffic alongside operational data with deterministic performance. As deployment costs fall and industrial modules mature, more North American and Middle-Eastern producers are earmarking 5G budgets to modernize communications, cementing the network’s role as a growth driver for the UCaaS in energy market.
Vendor Shift to Consumption-Based Pricing
Leading platforms now bill by minutes, messages or agents, aligning spend with fluctuating rig counts or seasonal grid-maintenance peaks. For cash-constrained utilities and renewable developers, this model eliminates hefty upfront licenses, accelerates ROI and reduces stranded-asset risk as technologies evolve. By freeing OPEX for innovation, usage-based billing broadens the addressable base, particularly among SMEs and emerging-market independents. Vendors that package AI analytics and regulatory features into modular add-ons further entice buyers to scale services organically.
Restraint Impact Analysis
| Restraint | (~) % Impact on CAGR Forecast | Geographic Relevance | Impact Timeline | |||
|---|---|---|---|---|---|---|
OT-IT integration complexity in legacy assets
OT-IT integration complexity in legacy assets
| -2.4% | Global, particularly acute in North America and Europe | Long term (≥ 4 years) |
(~) % Impact on CAGR Forecast
:
-2.4%
|
Geographic Relevance
:
Global, particularly acute in North America and
Europe
|
Impact Timeline
:
Long term (≥ 4 years)
|
Persistent data-sovereignty hurdles
Persistent data-sovereignty hurdles
| -1.8% | Europe leading, expanding to Asia-Pacific | Medium term (2-4 years) | |||
Volatile energy prices delaying IT cap-ex
Volatile energy prices delaying IT cap-ex
| -1.2% | Global, with regional variations | Short term (≤ 2 years) | |||
Limited last-mile connectivity in remote sites
Limited last-mile connectivity in remote sites
| -0.9% | Rural areas globally, particularly in developing markets | Long term (≥ 4 years) | |||
| Source: Mordor Intelligence | ||||||
OT-IT Integration Complexity in Legacy Assets
Refineries still depend on decades-old SCADA and DCS platforms that run proprietary protocols and isolate themselves from corporate networks for safety reasons. Introducing cloud-based UCaaS requires secure gateways, protocol converters and rigorous change-management, all of which extend roll-out timelines. Resistance also stems from plant engineers who prioritize uptime over new features, forcing phased deployments that blend on-premises voice with modern cloud functions. High consulting and cybersecurity costs therefore curb short-term uptake, particularly among mid-sized asset owners.
Persistent Data-Sovereignty Hurdles
GDPR, China’s CSL and similar rules restrict where call recordings or user metadata may reside, compelling multinationals to build regional instances or hybrid architectures. These fragmented topologies raise complexity and can dilute UCaaS economies of scale. Some operators delay cross-border roll-outs until clear guidance emerges, while others pick providers that guarantee in-country hosting—even if that narrowsa feature sets. The compliance maze therefore remains a material drag on the UCaaS in energy market during the forecast window.
By Component: Contact Centers Drive Service Transformation
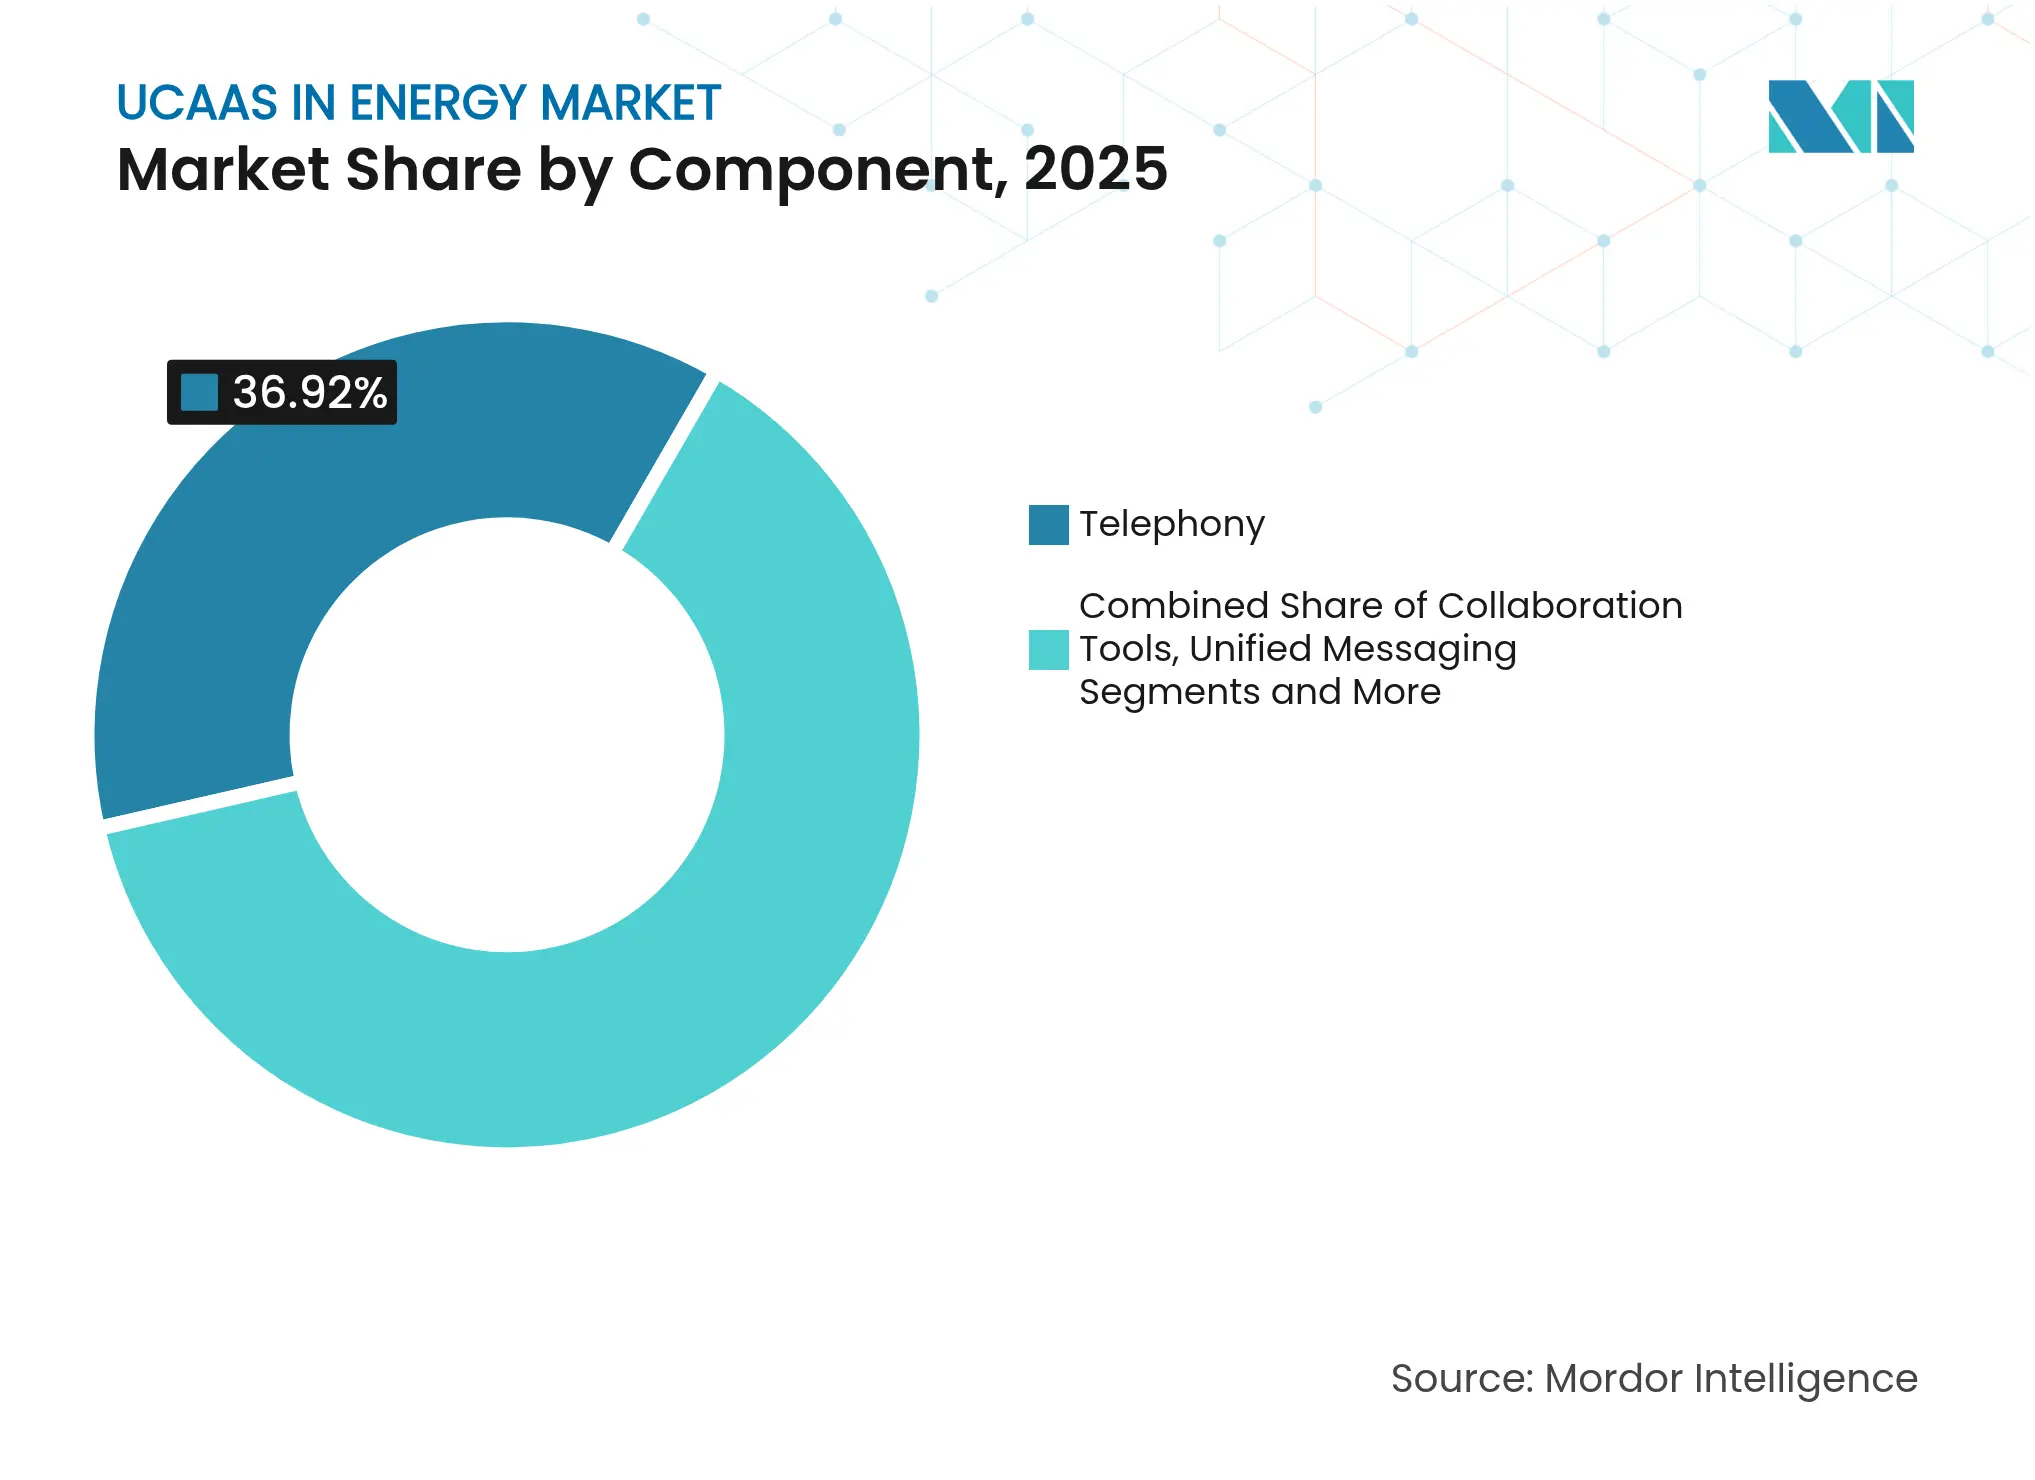
Telephony retained the biggest slice of the UCaaS in energy market share at 36.92% in 2025, supported by voice-centric safety protocols across plants and pipelines . Yet Contact-Center-as-a-Service (CCaaS) is projected to post a 17.10% CAGR through 2031 as utilities deploy AI chatbots and omnichannel interfaces to handle outage reports and billing queries. This pivot improves satisfaction scores while trimming call-handling costs.
Beyond front-office gains, CCaaS also integrates with outage-management systems and smart-meter data, letting agents proactively alert customers during grid events. Collaboration suites, unified messaging and conferencing tools meanwhile serve internal teams by unifying desktop, mobile and field devices. Across the forecast, the UCaaS in energy market size attributable to “other services” such as API integrations will expand steadily as operators embed communications within IoT and maintenance workflows.
Note: Segment shares of all individual segments available upon report purchase
By Deployment Model: Hybrid Solutions Gain Momentum
Public cloud instances commanded 59.55% of the UCaaS in energy market size in 2025 due to rapid spin-up times and minimal hardware needs. However enterprises seeking local data residency for SCADA conversations or incident recordings are driving hybrid models toward a 20.35% CAGR. Hybrid designs route low-risk traffic via hyperscale regions while anchoring sensitive streams in on-premises or edge nodes.
This architecture balances agility with compliance and has become popular among European utilities navigating strict privacy statutes. Private deployments remain vital for nuclear plants and offshore rigs where full isolation is mandatory, yet rising maintenance costs encourage gradual migration of non-critical workloads to cloud touchpoints, underscoring hybrid’s long-term appeal.
By Enterprise Size: SMEs Embrace Cloud Communications
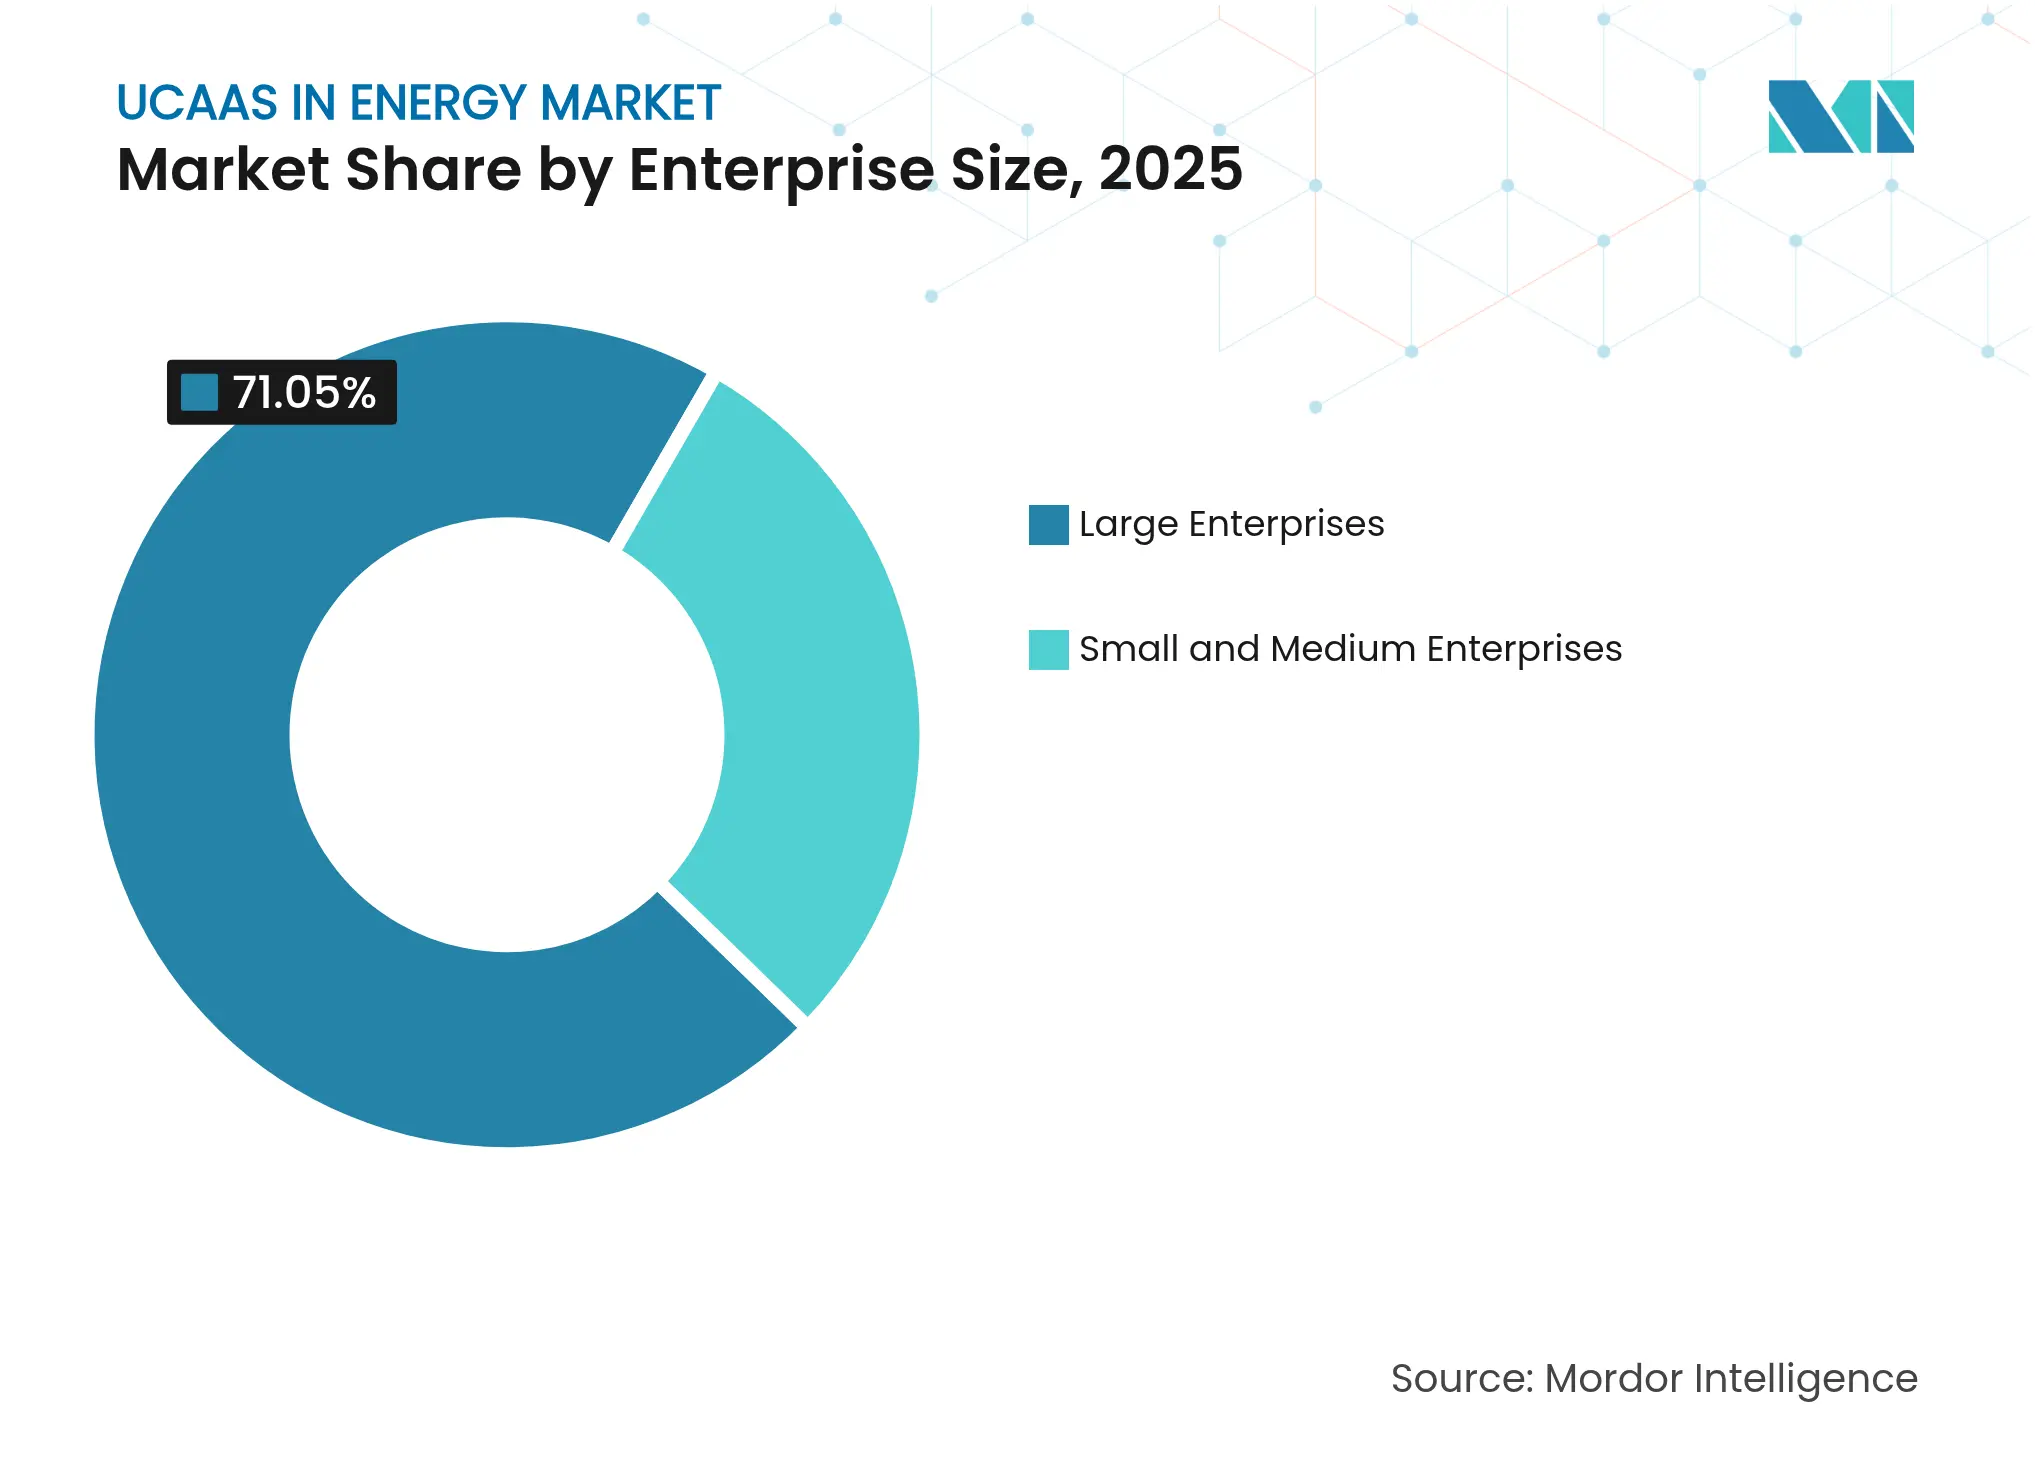
Large firms still held 71.05% revenue in 2025 as multibillion-dollar asset bases require complex, multi-site communication backbones. SMEs nonetheless are forecast to expand at an 17.55% CAGR because consumption-based pricing removes cap-ex hurdles. Local solar installers, regional oilfield services and municipal co-ops now access the same enterprise-grade calling, video and messaging as supermajors without heavy IT staff.
Regulators encouraging energy-efficiency audits further boost adoption; SMEs deploy UCaaS analytics to monitor field crews and remote inspections, cutting travel emissions. As a result, the UCaaS in energy market share attributable to smaller companies will rise steadily, although absolute revenue still skews toward majors that invest in custom integrations and global licenses.
Note: Segment shares of all individual segments available upon report purchase
By Energy Sub-Sector: Renewables Lead Digital Transformation
Utilities transmission and distribution captured 33.58% of 2025 turnover because grid-modernization mandates prioritize resilient dispatch and customer contact. Conversely, renewable energy assets are forecast to log a 22.30% CAGR, the fastest within the UCaaS in energy market, as wind and solar farms require constant telemetry and technician coordination. Remote substations, inverter skids and battery sites rely on cloud-hosted video rooms and push-to-talk apps that operate across low-bandwidth links. Oil and gas remains sizeable thanks to digital oilfield investments, while mining leans on ruggedized devices and underground leaky-feeder networks that now integrate with cloud dashboards. Each sub-sector’s roadmap therefore influences feature prioritization—from latency-tolerant back-office chat to millisecond-critical voice paths.
North America’s 43.85% 2025 revenue share reflects a large installed base of digital oilfields, smart-grid pilots and mature cloud infrastructure. Federal stimulus for grid resilience coupled with private-5G pilots in shale basins underpin continued demand. The UCaaS in energy market size attributable to utilities alone is set to climb as investor-owned firms upgrade contact centers to manage electrification queries.
Asia-Pacific will expand at a 18.95% CAGR through 2031 as China accelerates AI-based power-sector reforms and India opens renewable corridors that require cloud-integrated communications . Regional governments endorse domestic data hosting, spurring hybrid models and local edge nodes. Japanese gas distributors and Australian LNG exporters likewise integrate UCaaS to oversee remote assets and meet workforce-safety mandates. Europe maintains steady momentum driven by Fit-for-55 regulations demanding cyber-secure, interoperable grids. Cross-border energy exchanges and offshore wind clusters necessitate real-time coordination among TSOs and service vessels. Eastern European grids, seeking to reduce Russian gas dependency, invest in cloud-native dispatch tools. Meanwhile, Middle East and Africa embrace private-LTE and 5G for mega-projects, yet connectivity gaps in rural production sites restrain full-scale adoption. Across all regions, regulatory clarity and reliable broadband remain key determinants of rollout pace.
Market Concentration
Incumbent UCaaS giants—Microsoft, Cisco and Zoom—leverage global data-center footprints and robust partner ecosystems to serve multi-national energy majors. They tailor compliance modules for NERC-CIP, GDPR and local content rules while integrating with digital-oilfield and SCADA vendors. Cisco’s partnership with utilities on grid-edge routers exemplifies vertical focus. Microsoft deepens ties through Azure-based industrial apps, as seen in its multiyear pact with Baker Hughes that embeds UCaaS hooks into predictive-maintenance workflows.
Specialists such as Tata Communications and Orange offer end-to-end managed services combining satellite backhaul, cyber-SOC and UCaaS, appealing to operators with limited IT headcount. Armada’s edge-cloud stack showcases innovation, fusing local compute with low-latency communications for remote fields. Open RAN pioneers bundle flexible radios that interwork with UCaaS, promising unified communications over energy-owned spectrum.
Competition now centers on hybrid orchestration, AI-driven contact-center analytics and consumption-based licensing. Vendors that prove ROI via reduced downtime or faster outage response win mindshare. Market-entry barriers remain moderate; however, rigorous certification for safety-critical voice and long sales cycles favor vendors with deep domain references. Overall, differentiated energy-specific capabilities, secure hybrid hosting and transparent pricing emerge as the decisive levers in this moderately concentrated field.

*Disclaimer: Major Players sorted in no particular order
1. INTRODUCTION
2. RESEARCH METHODOLOGY
3. EXECUTIVE SUMMARY
4. MARKET LANDSCAPE
5. MARKET SEGMENTATION
6. COMPETITIVE LANDSCAPE
7. MARKET OPPORTUNITIES AND FUTURE OUTLOOK
Unified communications as as-a-service delivers synchronized business communications technologies on a single cloud-based platform. Service providers utilize VOIP and IP telephony technology to equip traditional business phone systems with instant messaging, video conferencing, and related web services. The enterprise communication advantages that UCaaS offers include improved collaboration across teams, quick deployment, scalability, and a reduced total cost of ownership.
Unified communication-as-a-service in the energy market is segmented by component (telephony, collaboration, unified messaging, conferencing, and other services), deployment model (private, public, and hybrid model), enterprise size (large enterprise and small & medium enterprise), and geography (North America, Europe, Asia Pacific, Latin America, and Middle East and Africa).
The market sizes and forecasts are provided in terms of value (USD) for all the above segments.
Pricing Strategy for Semiconductor Components
3 Min Read
Accelerating Additive Manufacturing Adoption in India
3 Min Read
Feasibility Analysis for FBO Services in East Africa
3 Min Read
When decisions matter, industry leaders turn to our analysts. Let’s talk.