
Turboexpander Market Size and Share
Market Overview
| Study Period | 2021 - 2031 |
|---|---|
| Market Size (2026) | USD 0.94 Billion |
| Market Size (2031) | USD 1.31 Billion |
| Growth Rate (2026 - 2031) | 6.88 % |
| Fastest Growing Market | Asia Pacific |
| Largest Market | Asia Pacific |
| Market Concentration | Medium |
Major Players *Disclaimer: Major Players sorted in no particular order Image © Mordor Intelligence. Reuse requires attribution under CC BY 4.0. | |
Turboexpander Market Analysis by Mordor Intelligence
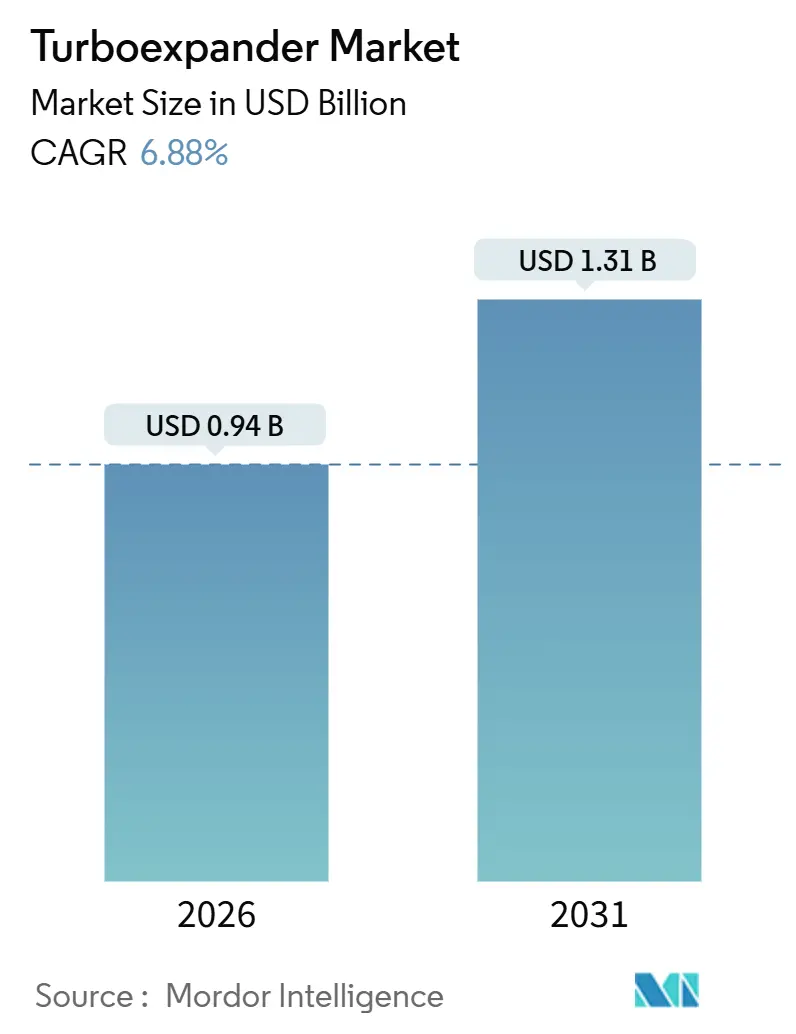
The Turboexpander Market size is estimated at USD 0.94 billion in 2026, and is expected to reach USD 1.31 billion by 2031, at a CAGR of 6.88% during the forecast period (2026-2031).
Expansion of liquefied natural gas (LNG) infrastructure, rising air-separation unit (ASU) builds, and pressure-letdown energy-recovery retrofits together reinforce the long-run demand outlook. LNG projects scheduled between 2026 and 2030 alone will add nearly 300 billion m³ per year of export capacity, anchoring long-term equipment orders. Downstream, pipeline operators in North America and Europe are monetizing unused pressure differentials, pairing turboexpanders with generators to cut purchased power and carbon intensity. Strategic consolidation is accelerating, as seen in Baker Hughes’ USD 13.6 billion purchase of Chart Industries, because customers increasingly prefer integrated compressor-expander packages that shorten commissioning cycles.
Key Report Takeaways
- By product type, radial designs held 63.1% of the Turboexpander market share in 2025; hybrid configurations are forecast to expand at a 7.9% CAGR to 2031.
- By loading device, the compressor-coupled segment led with 56.5% of the Turboexpander market share in 2025, while generator-coupled units are predicted to post the highest 7.6% CAGR through 2031.
- By power capacity, units rated above 40 MW accounted for the fastest-growing slice of the Turboexpander market size at an 8.4% CAGR between 2026 and 2031.
- By application, hydrogen liquefaction is expected to rise at an 8.1% CAGR, outpacing legacy natural-gas processing demand.
- By end-user industry, oil and gas led with 43.7% share in 2025, while clean energy developers are expected to rise at a 9.5% CAGR.
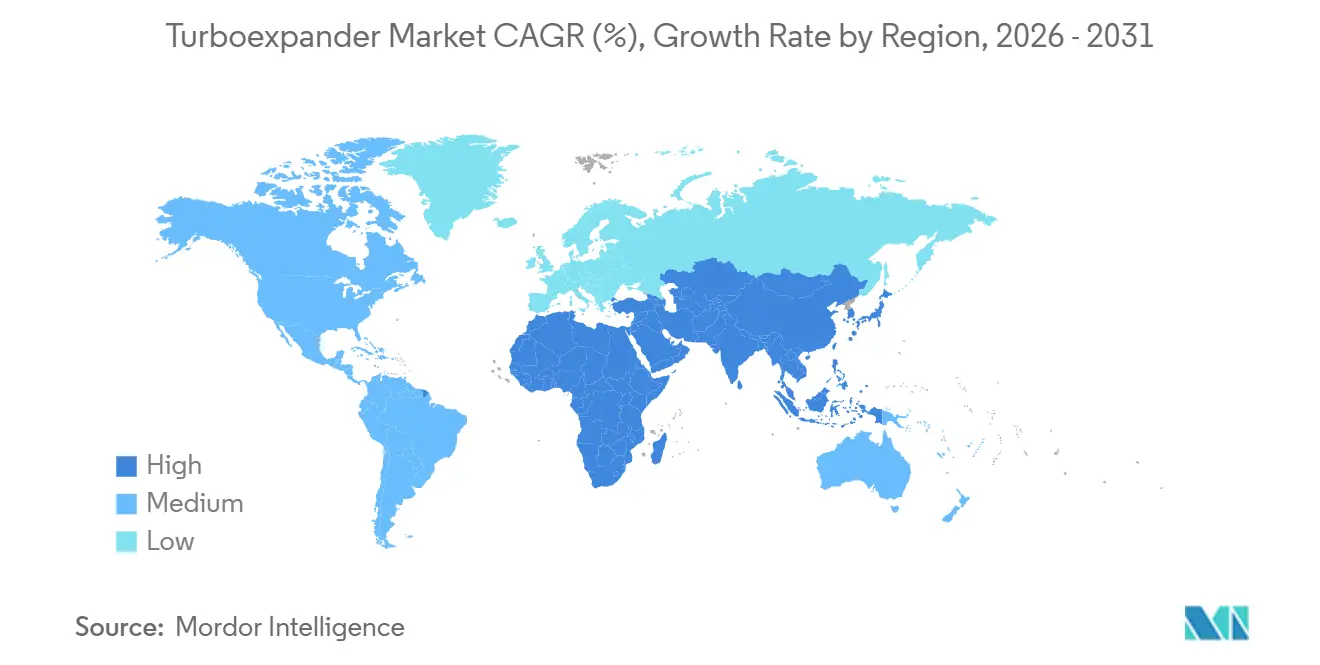
- By geography, Asia-Pacific commanded 36.6% of the Turboexpander market share in 2025 and is set to register a 7.3% CAGR to 2031.
Note: Market size and forecast figures in this report are generated using Mordor Intelligence’s proprietary estimation framework, updated with the latest available data and insights as of January 2026.
Global Turboexpander Market Trends and Insights
Drivers Impact Analysis*
| Driver | (~) % Impact on CAGR Forecast | Geographic Relevance | Impact Timeline |
|---|---|---|---|
| LNG capacity build-out drives cryogenic turboexpander demand | +1.8% | Global, concentrated in Middle East, Asia-Pacific, North America | Medium term (2-4 years) |
| Pipeline pressure-letdown energy-recovery projects | +1.2% | North America & Europe | Short term (≤ 2 years) |
| APAC air-separation plant construction boom | +1.5% | Asia-Pacific core, spillover to Middle East | Medium term (2-4 years) |
| Hydrogen liquefaction needs ultra-cold oil-free expanders | +0.9% | Europe, Japan, South Korea, early adoption in India | Long term (≥ 4 years) |
| Wellhead micro-turboexpanders electrify pad equipment | +0.6% | North America shale basins, select Middle East fields | Short term (≤ 2 years) |
| Geothermal & ORC waste-heat projects adopt expander-generators | +0.5% | Europe, select Asia-Pacific geothermal zones | Medium term (2-4 years) |
| Source: Mordor Intelligence | |||
LNG Capacity Build-Out Drives Cryogenic Turboexpander Demand
Qatar’s North Field East expansion, targeting mid-2026 start-up, will install 16 cryogenic turboexpander trains rated 30–40 MW each to handle mixed-refrigerant cycles.[1]QatarEnergy, “North Field East Expansion Update,” qatarenergy.qa Abu Dhabi LNG capacity is slated to reach 25 mtpa by 2035, implying orders for roughly 40 additional units. Suppliers capture 8–10% of total liquefaction equipment budgets, translating into a multi-billion-dollar addressable spend. Baker Hughes’ USD 1 billion Rio Grande LNG package validates turboexpanders’ indispensability in next-generation layouts. Tight delivery windows in 2026–2027 are already stretching advanced magnetic-bearing (AMB) supply chains.
Pipeline Pressure-Letdown Energy-Recovery Projects
The United States added 17.8 bcf/d of takeaway capacity in 2024; pressure differentials exceeding 600 psi allow 2–5 MW generator-coupled expanders to monetize wasted energy. Energy Transfer reports each retrofit displaces 15,000 tCO₂e per site and yields payback in under three years at prevailing power and carbon prices.[2]Energy Transfer LP, “2024 Annual Report,” energytransfer.com The EU’s Energy Efficiency Directive is pushing similar conversions at German and Dutch gate stations.
APAC Air-Separation Plant Construction Boom
Air Liquide commissioned three large ASUs in China between 2024 and 2025, each drawing 80 MW and using cryogenic turboexpanders to boost plant efficiency by up to eight percentage points.[3]Air Liquide, “China ASU Commissioning Press Release,” airliquide.com China’s industrial-gas demand is rising 7% annually, prompting dozens of additional ASU projects. India forecasts 12–15 new ASUs by 2030 to serve refinery expansions, translating to 25–30 turboexpander units.
Hydrogen Liquefaction Needs Ultra-Cold Oil-Free Expanders
Hydrogen liquefaction at −253 °C requires AMB technology to avoid oil contamination. India’s USD 2.3 billion green-hydrogen subsidy program underpins four 10–15 MW oil-free turboexpanders at Reliance’s Jamnagar project. Japan’s roadmap to produce 12 Mt H₂ by 2040 specifies AMB-equipped expanders to ensure reliability. Europe’s hydrogen backbone likewise demands distributed liquefaction hubs, each using multiple turboexpanders.
Restraints Impact Analysis*
| Restraint | (~) % Impact on CAGR Forecast | Geographic Relevance | Impact Timeline |
|---|---|---|---|
| Volatile oil-and-gas CAPEX cycles | -1.1% | Global, acute in North America shale, offshore developments | Short term (≤ 2 years) |
| High upfront cost vs J-T valves | -0.7% | Price-sensitive markets in South America, Africa, Southeast Asia | Medium term (2-4 years) |
| AMB component supply bottlenecks | -0.5% | Global, concentrated impact on hydrogen & helium applications | Short term (≤ 2 years) |
| Unproven reliability in >20% H₂ service | -0.4% | Europe, Japan, South Korea, India hydrogen projects | Long term (≥ 4 years) |
| Source: Mordor Intelligence | |||
Volatile Oil-and-Gas CAPEX Cycles
U.S. upstream cash flow in 2024 was 15% below 2022 peaks, delaying gas-processing expansions that employ turboexpanders.[4]U.S. Energy Information Administration, “Upstream Financial Review 2024,” eia.gov FIDs on offshore gas projects declined 20% in 2024, elongating order books. Recovery depends on LNG offtake contracts expected to firm by late 2026.
High Upfront Cost versus J-T Valves
Installed costs of USD 1.5–4 million per MW dwarf sub-USD 100,000 J-T valves, lengthening payback in low-tariff regions. Southeast Asian processors facing discounted power rates default to simpler valves despite energy penalties. Suppliers are introducing modular skids to narrow the capex delta, but the hurdle remains.
*Our forecasts treat driver/restraint impacts as directional, not additive. The impact forecasts reflect baseline growth, mix effects, and variable interactions.
Segment Analysis
By Product Type: Radial Designs Dominate Mid-Range Power
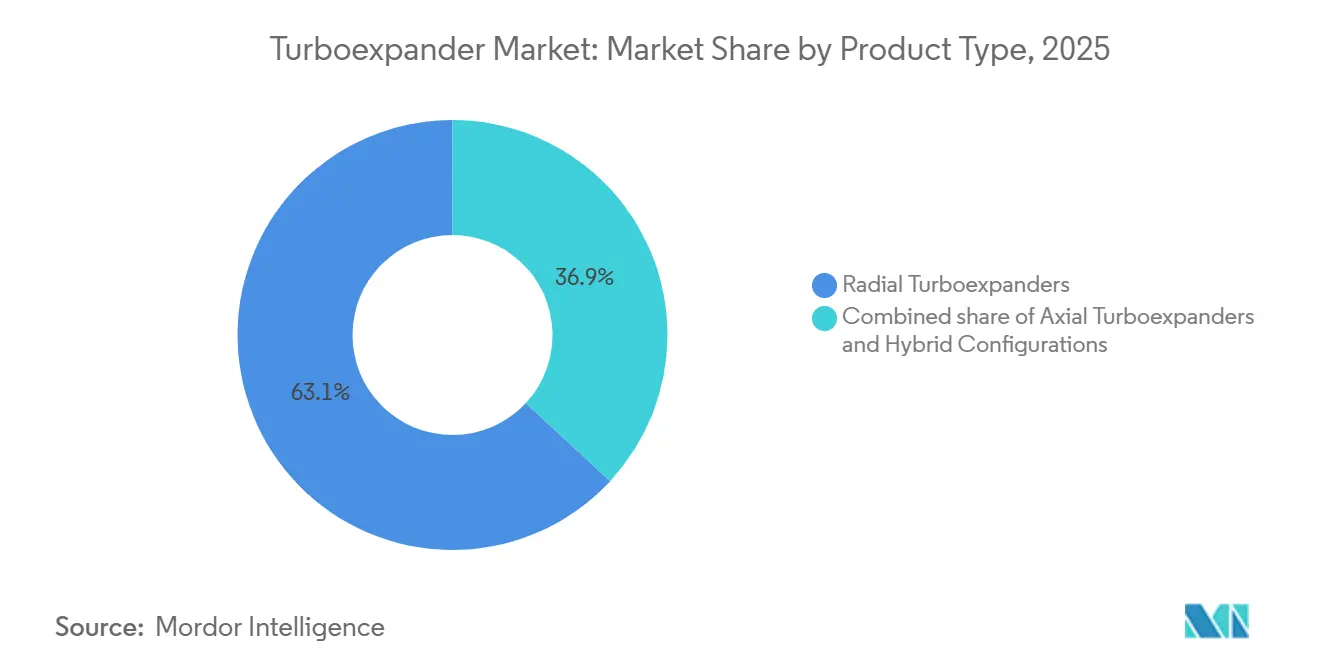
Radial units captured 63.1% of the 2025 Turboexpander market share, driven by 10–40 MW LNG and ASU duty points. Hybrid radial-axial designs will grow 7.9% annually by 2031, preserving efficiency under part-load conditions. Baker Hughes’ Chart acquisition blends L.A. Turbine AMB radials with Baker Hughes compressors, enabling turnkey trains that shorten site integration. Axial models remain indispensable above 50 MW for Qatar and Australia mega-trains.
Smaller, skid-mounted radials below 10 MW are rising in distributed LNG and hydrogen hubs, where factory-tested packages minimize site work. Geothermal ORC developers adopt hybrid architectures to maintain performance across 30–70% load swings, reinforcing sustained demand in the sub-25 MW bracket.



By Loading Device: Generator Coupling Gains in Energy Recovery
Compressor-coupled expanders held 56.5% of 2025 shipments, reflecting their dominance in LNG and ASU flowsheets. Generator-coupled units, however, will post a 7.6% CAGR to 2031 as pipeline and industrial-gas operators monetize pressure losses and export power. A single Texas pressure-letdown retrofit saved USD 30 million in 2024 power costs.
European and Japanese hydrogen roadmaps call for grid-synchronized generators to reduce parasitic loads. Turnkey skids integrating power electronics now ship in under 40 weeks, lowering engineering overheads for owners without in-house electrical expertise.
By Power Capacity: Mega-Projects Drive High-Power Demand
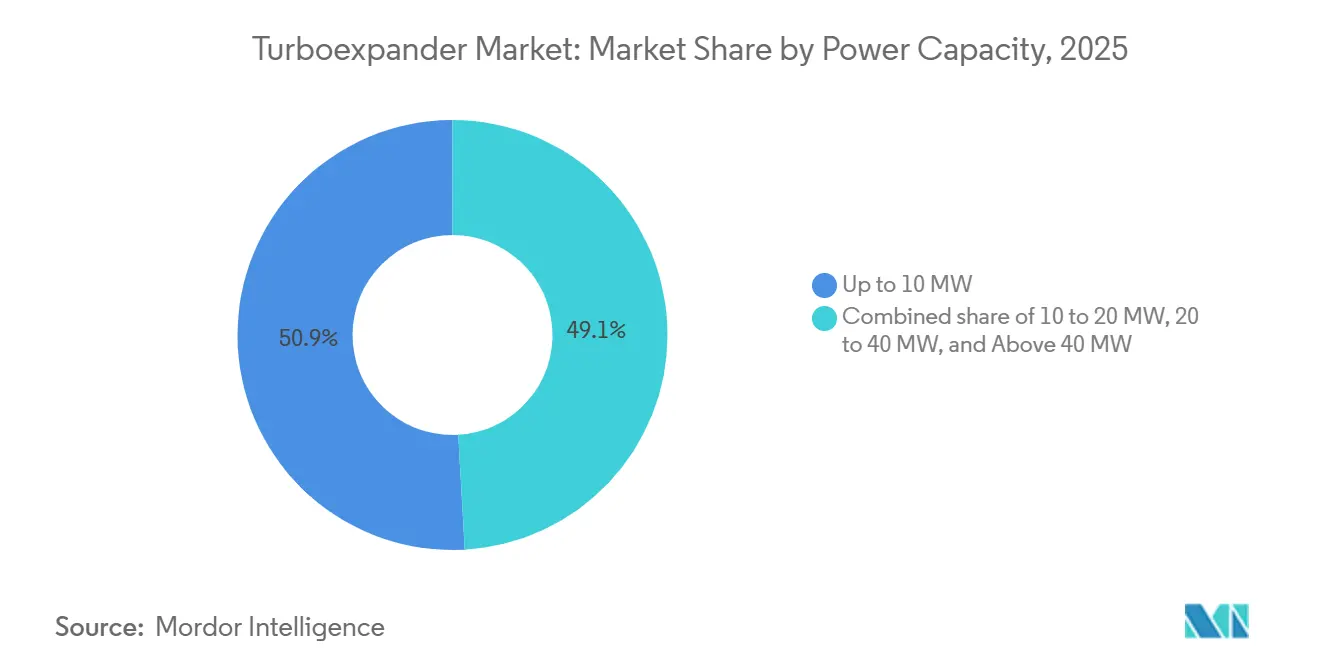
Units up to 10 MW accounted for 50.9% of 2025 volumes, aligned with wellhead, small-scale LNG, and city-gate pressure recovery. Turboexpanders above 40 MW represent the fastest-growing slice of the Turboexpander market size, expanding 8.4% through 2031 on the back of Middle Eastern mega-LNG trains. ADNOC’s Ruwais LNG alone specified 12 units at 35–45 MW each.
Mid-range 20–40 MW demand emanates from Chinese ASUs and offshore gas platforms, while geothermal binary plants in Indonesia deploy 15–25 MW generators to maximize net output. Technological investment aims to push single-stage radial envelopes past 50 MW, challenging axial incumbency.
By Application: Hydrogen Liquefaction Emerges as Growth Vector
Natural-gas processing retained 41.4% of 2025 revenues, but hydrogen and helium liquefaction will grow 8.1% per year as global green-hydrogen spending intensifies. LNG liquefaction, roughly 30% of 2025 sales, continues to absorb high-power radial and axial equipment across the United States, Qatar, and Mozambique.
ASU and industrial gases hold about 20% of shipments, buoyed by Chinese and Indian steel and chemicals build-outs. Pipeline pressure-letdown retrofits and geothermal ORC plants, though smaller in volume, provide diversified demand streams and help smooth cyclical energy-sector swings.
By End-User Industry: Clean Energy Developers Accelerate Adoption
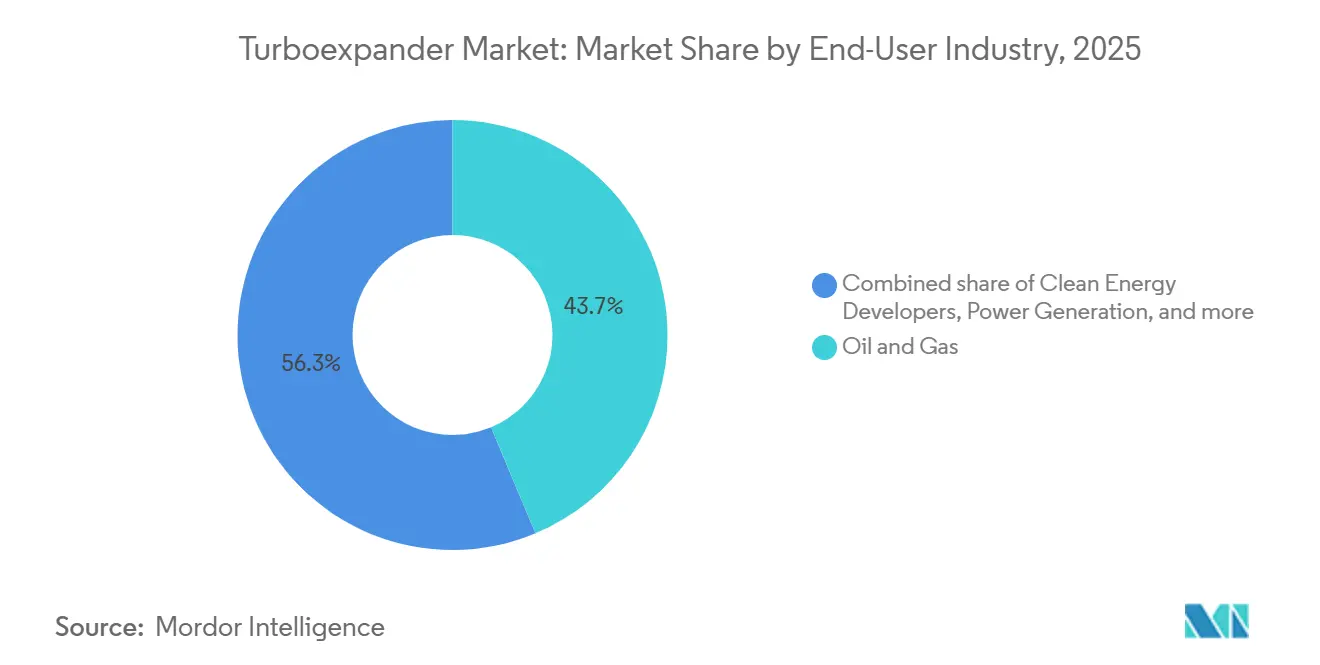
Oil-and-gas companies represented 43.7% of 2025 turnover, but clean-energy developers are expected to log a 9.5% CAGR through 2031 on the strength of hydrogen, geothermal, and waste-heat projects. Japan’s 12 Mt H₂ roadmap alone will require dozens of 10–20 MW AMB expanders.
Chemical and petrochemical firms account for roughly one-fifth of uptake, using turboexpanders to recover energy from ethylene, ammonia, and methanol loops. Industrial manufacturing, notably steel and electronics, drives ASU installations relying on cryogenic expanders for oxygen and nitrogen production.
Geography Analysis
Asia-Pacific, holding 36.6% of 2025 sales, will maintain a 7.3% CAGR as China commissions new ASUs, India subsidizes green hydrogen, and Japan scales liquefaction hubs. Indonesia and the Philippines add geothermal ORC capacity using 15–25 MW expanders.
North America delivered roughly 30% of 2025 demand, anchored by shale-gas processing, LNG export terminals, and pressure-letdown energy recovery. Baker Hughes’ USD 1 billion Rio Grande LNG order and Energy Transfer’s 50 MW of generator-coupled retrofits highlight enduring momentum.
Europe and the Middle East together contribute about 30% of the total. ADNOC and QatarEnergy mega-trains dominate high-power procurements, while EU operators retrofit pipelines under energy-efficiency mandates. South America and Africa register selective uptake in offshore gas and geothermal, but remain constrained by financing costs.

Regulatory Landscape
Turboexpanders supplied into oil and gas, petrochemical, LNG, and industrial gas projects are typically qualified through rotating equipment standards and hazardous-area conformity. API Standard 617 (Ninth Edition, 2022) is a common procurement anchor for axial and centrifugal compressors and expander-compressors, while the ISO 10439 series (including ISO 10439-1:2015 and ISO 10439-4:2015) provides internationally referenced requirements for expander-compressor design, manufacturing, and testing. These standards feed into EPC-driven LNG and gas-processing trains for bid specifications, factory acceptance testing, and lifecycle documentation.
Regional compliance overlays add constraints on electrical classification, materials, and package integration. In Europe, ATEX conformity for equipment used in explosive atmospheres commonly applies to turboexpander packages installed in gas plants and LNG terminals, while Canada often references CSA-related hazardous location requirements alongside project specifications. China also uses national standards such as GB/T 29542-2013 for industrial off-gas energy recovery turbine expanders, which influences localization of design verification and acceptance criteria for energy-recovery applications.
Competitive Landscape
The Turboexpander market shows moderate concentration: the top five players command nearly 60% of global turnover. Baker Hughes’ 2025 takeover of Chart Industries unites AMB expertise with an extensive LNG compressor base, enabling full-train solutions that reduce interface risk for EPC contractors. Honeywell’s 2024 purchase of Air Products’ LNG equipment arm positions it for packaged cryogenic offerings.
Advanced magnetic bearings and modular skids are key differentiators. Barber-Nichols and Cryostar exploit niches in helium liquefaction and small-scale LNG, while Siemens Energy and MAN Energy Solutions push aerodynamic redesigns to surpass 50 MW single-stage thresholds. Over 100 prospective pipeline pressure-recovery sites in North America and Europe provide fertile ground for agile, generator-coupled specialists.
Turboexpander Industry Leaders
Atlas Copco AB
Baker Hughes Company
Chart Industries
Cryostar SAS
Elliott Group
- *Disclaimer: Major Players sorted in no particular order


Market Opportunities and Future Outlook
Near-term whitespace is most visible where end users can translate pressure reduction and cryogenic processes into measurable efficiency gains using packaged, generator-coupled or compressor-coupled expanders. Pipeline pressure-letdown retrofits in North America and parts of Europe create a repeatable project template (skid packages, grid synchronization, and controls integration), aligning with operator initiatives to cut purchased power and emissions at gate stations. In industrial gases, continued ASU build cycles in Asia-Pacific keep demand centered on cryogenic expanders that lift plant efficiency, while hydrogen liquefaction projects increase the need for oil-free designs and active magnetic bearing (AMB) capability.
Execution capacity is increasingly shaping supplier differentiation as orders cluster around LNG and large industrial projects. Atlas Copco Gas and Process completed a high-bay facility expansion in Voorheesville, New York (February 2026) to increase manufacturing capacity for large integrally geared compressors and turboexpanders, aimed at supporting shorter lead times for complex packages. On the demand side, Baker Hughes reported LNG-related equipment awards tied to Cheniere and Bechtel for Sabine Pass LNG Train 7 (July 2026), reinforcing how integrated turbomachinery trains specify turboexpander-relevant technology alongside compressors and power systems, favoring suppliers that can deliver standardized modules with performance and service coverage.
Recent Industry Developments
- July 2026: The European Commission approved Baker Hughes' acquisition of Chart Industries. The clearance advances consolidation across cryogenic and turbomachinery supply, aligning expander technology, packaging, and aftermarket capabilities under a larger integrated-equipment portfolio.
- September 2025: Sapphire Technologies closed a Series C financing round with Mitsubishi Heavy Industries and existing investors participating. The funding supports scaling of turboexpander-based energy-recovery systems, expanding the addressable base of pipeline and industrial pressure-reduction applications.
- March 2024: Anax Power commissioned its first 500 kW Anax Turboexpander (ATE-500) at Pin Oak Energy's Johnsonburg Regulating Station in Pennsylvania. The project validated a small-scale, generator-coupled deployment model at a live regulating station, strengthening the commercial pathway for distributed pressure-letdown power generation.


Research Methodology Framework and Report Scope
Market Definition and Coverage
For this methodology, the turbo expander market covers revenue earned from manufacturing and selling turbo expanders and closely coupled expander-based units used to recover energy from gas pressure drops in industrial processes.
Scope exclusions: We exclude general-purpose gas turbines, standalone cryogenic pumps, and non-expander pressure reduction valves that do not perform expansion work.
Segmentation Overview
- By Product Type
- Radial Turboexpanders
- Axial Turboexpanders
- Hybrid Configurations
- By Loading Device
- Compressor-Coupled Expanders
- Generator-Coupled Expanders
- Hydraulic/Oil-Brake (Dyno) Units
- By Power Capacity
- Up to 10 MW
- 10 to 20 MW
- 20 to 40 MW
- Above 40 MW
- By Application
- Natural Gas Processing and NGL Recovery
- LNG Liquefaction and Pretreatment
- Air Separation and Industrial Gases
- Pressure-Letdown Energy Recovery
- Geothermal and Waste-Heat ORC
- Hydrogen and Helium Liquefaction
- By End-User Industry
- Oil and Gas
- Chemical and Petrochemicals
- Power Generation
- Industrial Manufacturing
- Clean Energy Developers
- By Geography
- North America
- United States
- Canada
- Mexico
- Europe
- Germany
- France
- United Kingdom
- Italy
- Spain
- NORDIC Countries
- Russia
- Rest of Europe
- Asia-Pacific
- China
- India
- Japan
- South Korea
- ASEAN Countries
- Australia and New Zealand
- Rest of Asia-Pacific
- South America
- Brazil
- Argentina
- Chile
- Rest of South America
- Middle East and Africa
- Saudi Arabia
- United Arab Emirates
- South Africa
- Egypt
- Rest of Middle East and Africa
- North America
Data Sources, Market Sizing, and Validation
Desk Research
Our desk work starts with public references that help ground the demand pool and operating context, such as EIA natural gas and LNG statistics, the US FERC pipeline filings, IEA energy outlook tables, and Eurostat energy balances. To keep the applications logic realistic, we also review materials from bodies such as ISO and ASME, plus peer-reviewed cryogenics and turbomachinery journals that discuss expander efficiency ranges and typical operating conditions.
On the supply side, company annual reports, investor presentations, and project announcements are screened to understand order timing and end-use exposure. We also use paid subscriptions for company financials and structured news coverage, and a patent database view to track technology focus areas that can shift ASP assumptions. The source list above is illustrative only, and additional public documents and datasets were used for data collection, cross-checks, and clarification.
Primary Interviews and Surveys
Primary work is used to pressure-test desk assumptions on where turbo expanders are specified, how packages are priced, and which applications are moving from design to approvals. We speak with equipment suppliers, EPC and integrator teams, and end users across major regions so gaps like typical power-capacity mix and replacement cycles can be addressed before finalizing the model.
Distribution of primary research fieldwork respondents
| Company type | Respondent position | Region |
|---|---|---|
| Top tier: 31% | CXOs: 12% | APAC: 43% |
| Mid tier: 55% | Functional/Unit leaders: 33% | EMEA: 37% |
| Smaller Players: 14% | Managers: 55% | Americas: 20% |
Market-Sizing & Forecasting
Sizing is built using a top-down approach where energy and gas-processing activity is reconstructed into an addressable expander demand pool, and then filtered by where pressure let-down and cryogenic expansion are technically required. The totals are corroborated with selective bottom-up approximations, including sampled ASP-by-capacity checks and supplier shipment and order pattern sanity checks, to adjust for gaps that a single data stream can miss.
Key inputs that shape the model include LNG liquefaction and regasification project activity, gas processing and NGL recovery expansions, air separation unit additions, the typical MW band used per application, and observed pricing differences between compressor-loaded and generator-loaded packages. For the forecast, scenario analysis is used with a base case informed by interview-led expectations on project timing, lead times, and expected efficiency upgrades. Where direct volume proxies are thin in smaller end uses, we apply conservative penetration and replacement assumptions and then revisit them during validation rounds.
Data Validation & Update Cycle
Outputs are checked against independent signals, including project pipelines, commissioning timelines, and the implied equipment intensity per facility type. Any sharp year-to-year jumps are flagged, reviewed by a second analyst, and then traced back to a specific driver such as a step change in LNG trains or a shift in pricing inputs. If a variance remains hard to explain, respondents are re-contacted to confirm whether the change reflects a real market move or a modeling assumption.
Reports are refreshed annually, and interim updates are made when material events occur that can change demand or pricing. Before delivery, a final pass is completed to ensure the latest public data and interview learnings are reflected in the numbers and narrative.
Mordor Intelligence's Turbo Expander Market Estimate Compared With Other Published Estimates
Published market sizes for turbo expanders can differ even when they appear to measure the same thing, because scope boundaries and timing assumptions are not always aligned. The year chosen, what counts as a complete expander package, and how pricing is treated across capacity bands are usually the biggest reasons the numbers spread.
Project pipeline checks for LNG trains, gas processing expansions, and air separation capacity additions are the evidence that ties Mordor Intelligence's estimate to a repeatable demand pool, instead of letting broad industrial equipment spend dilute the total. In addition, differences show up when one estimate counts wider turbomachinery packages, uses aggressive price escalation without capacity-mix checks, or applies a currency conversion point that does not match the market year being reported.
Benchmark comparison
| Source | Market Size | Gaps in Research Methodology |
|---|---|---|
| Mordor Intelligence | USD 0.94 B (2026) | |
| Industry Media A | USD 1.20 B (2024) | Uses a press-style headline number tied to a different year and often reflects broader application language, which can pull in adjacent energy recovery equipment and shift the scope beyond expander packages. |
| Global Consultancy B | USD 1.16 B (2025) | Reports on an earlier year and may apply faster ASP growth across the forecast period, without clearly separating capacity mix changes between cryogenic, pipeline, and industrial use cases. |
Looking at the three figures together, the spread is mainly explained by year selection and what is included as a complete turbo expander package, followed by how pricing is moved forward over time. By keeping the demand pool anchored to identifiable project and capacity signals and then checking pricing against application-specific capacity ranges, we end up with a number that can be traced and repeated with clear steps.


Key Questions Answered in the Report
How large is the Turboexpander market in 2026?
The Turboexpander market size stood at USD 0.94 billion in 2026 and is forecast to reach USD 1.31 billion by 2031.
Which Turboexpander product type leads global demand?
Radial designs dominate, holding 63.1% of 2025 global Turboexpander market share.
What CAGR is expected for generator-coupled turboexpanders?
Generator-coupled units are projected to grow at a 7.6% CAGR between 2026 and 2031.
Why are turboexpanders critical to hydrogen liquefaction?
Ultra-low temperatures of −253 °C require oil-free, magnetic-bearing turboexpanders to avoid contamination and ensure reliability.
Which region is the fastest-growing Turboexpander market?
Asia-Pacific leads with a forecast 7.3% CAGR through 2031, driven by ASU and hydrogen investments.
Page last updated on:





