
Tunable Laser Market Size and Share
Market Overview
| Study Period | 2020 - 2031 |
|---|---|
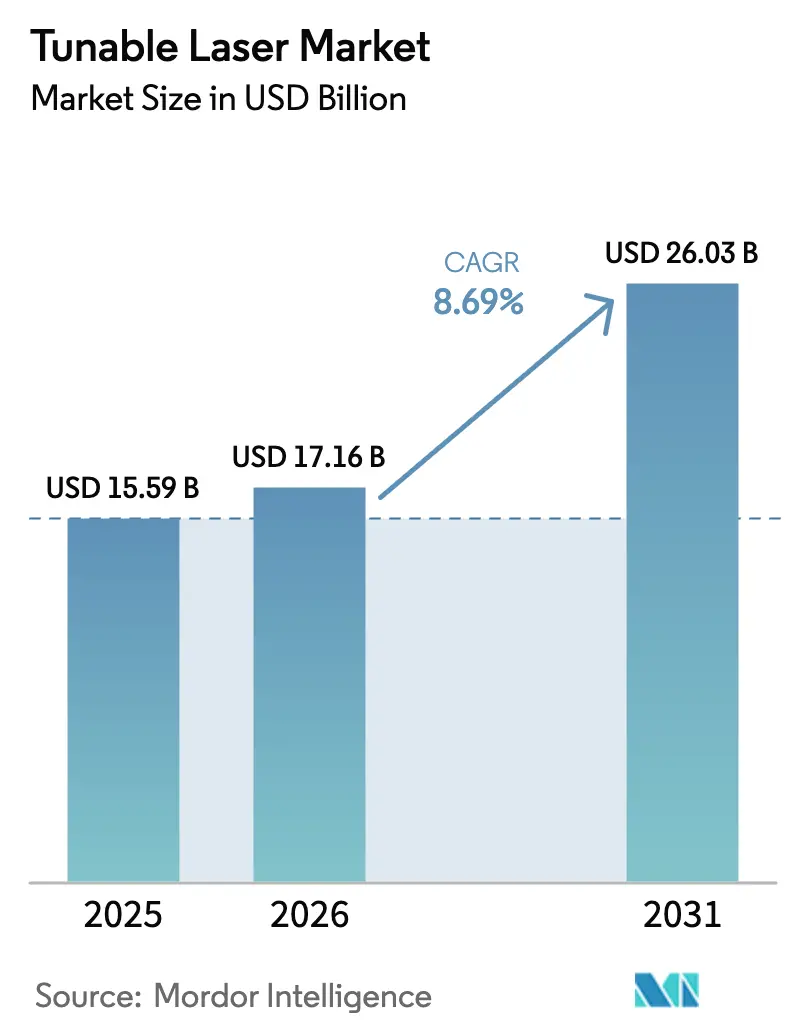
| Market Size (2026) | USD 17.16 Billion |
| Market Size (2031) | USD 26.03 Billion |
| Growth Rate (2026 - 2031) | 8.69 % |
| Fastest Growing Market | Middle East |
| Largest Market | Asia Pacific |
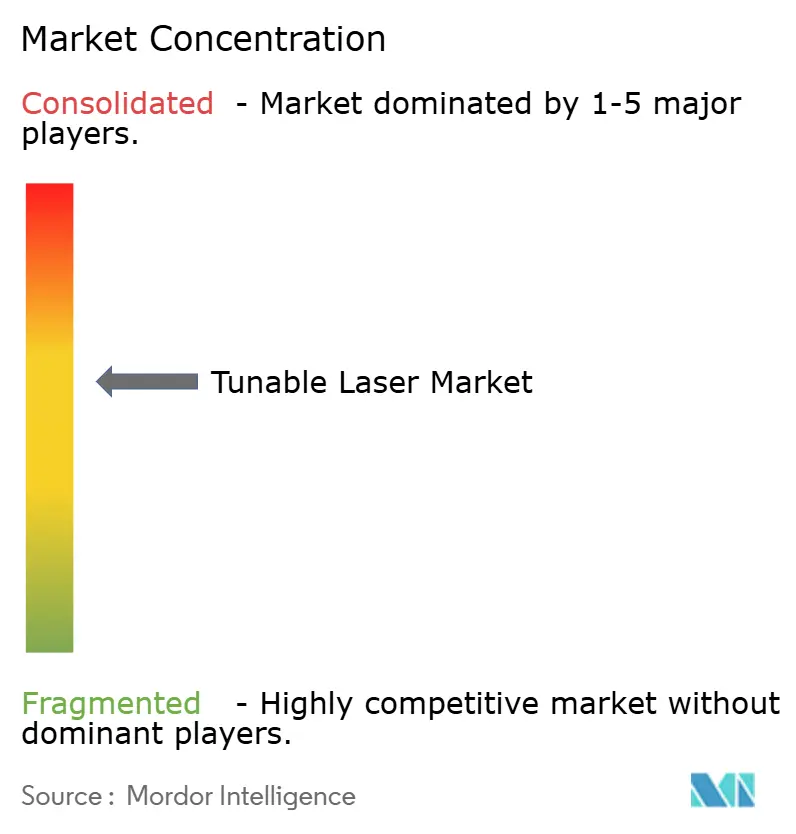
| Market Concentration | Medium |
Major Players *Disclaimer: Major Players sorted in no particular order Image © Mordor Intelligence. Reuse requires attribution under CC BY 4.0. | |
Tunable Laser Market Analysis by Mordor Intelligence
The tunable laser market size is projected to expand from USD 15.59 billion in 2025 and USD 17.16 billion in 2026 to USD 26.03 billion by 2031, registering a CAGR of 8.69% between 2026 to 2031. This expansion rides on rapid upgrades in coherent optical transport, emissions monitoring, and miniaturized imaging that demand precise wavelength agility. Incumbent suppliers are pushing narrow-linewidth external-cavity designs into 400 G and 800 G pluggable modules, while mid-infrared quantum-cascade technologies open new lanes in process analytics. Capital spending on 5G fronthaul fiber and cloud data-center interconnects keeps the tunable laser market firmly tied to network infrastructure cycles. Simultaneously, the shift from mechanical to MEMS actuation reduces sweep times in optical coherence tomography, enhancing diagnostics in cardiology and ophthalmology. Venture-backed entrants target chip-scale LiDAR and quantum computing niches, intensifying competition but also widening the application footprint.
Key Report Takeaways
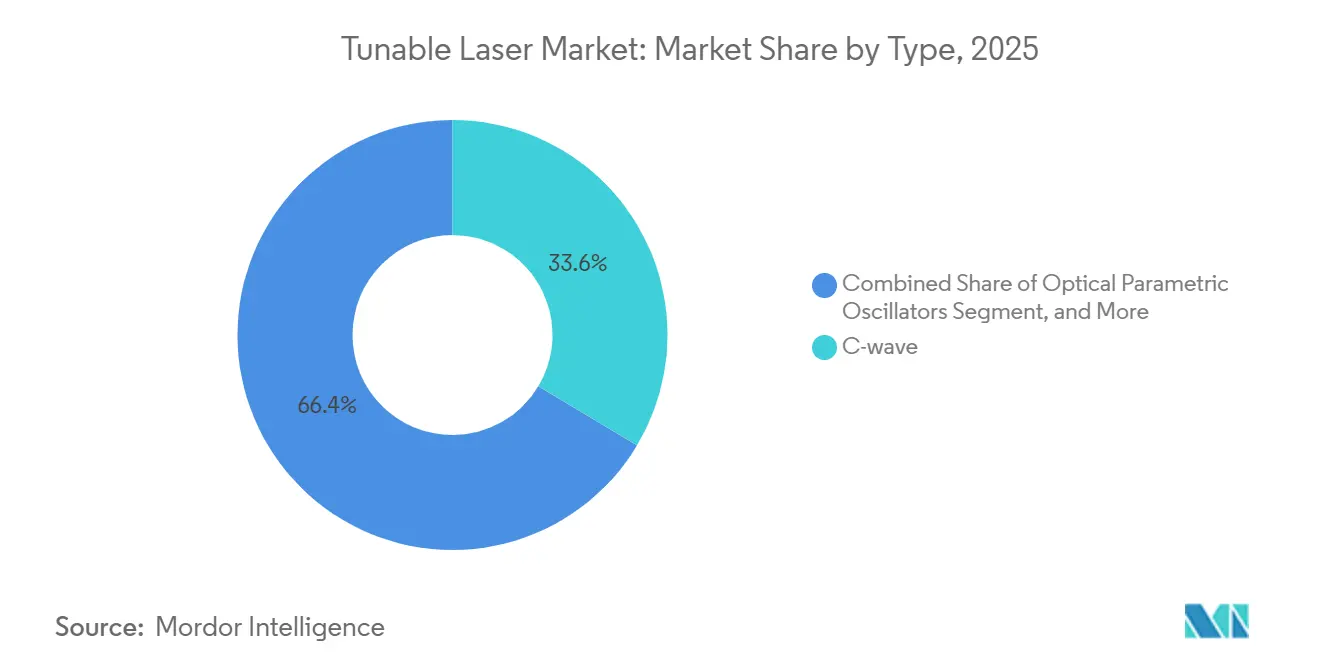
- By type, C-wave devices led with 33.57% of the tunable laser market share in 2025, whereas optical parametric oscillators are forecast to grow at a 9.21% CAGR through 2031.
- By tuning mechanism, temperature-tuned lasers accounted for 39.74% of the tunable laser market size in 2025, while MEMS-tuned variants are advancing at a 9.32% CAGR to 2031.
- By end-user industry, manufacturing and industrial accounted for 42.89% of revenue share in 2025; aerospace and defense is projected to record the highest 9.47% CAGR through 2031.
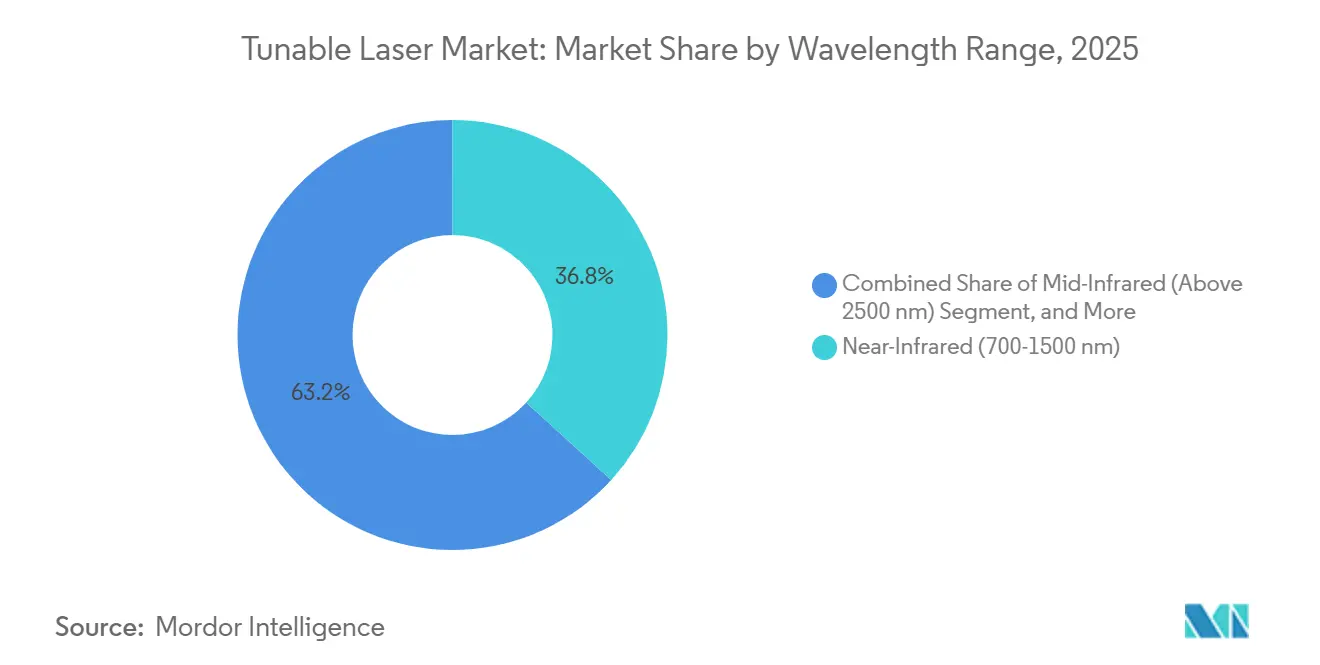
- By wavelength range, near-infrared sources captured 36.78% of the market in 2025, with mid-infrared lasers poised for a 9.29% CAGR through 2031.
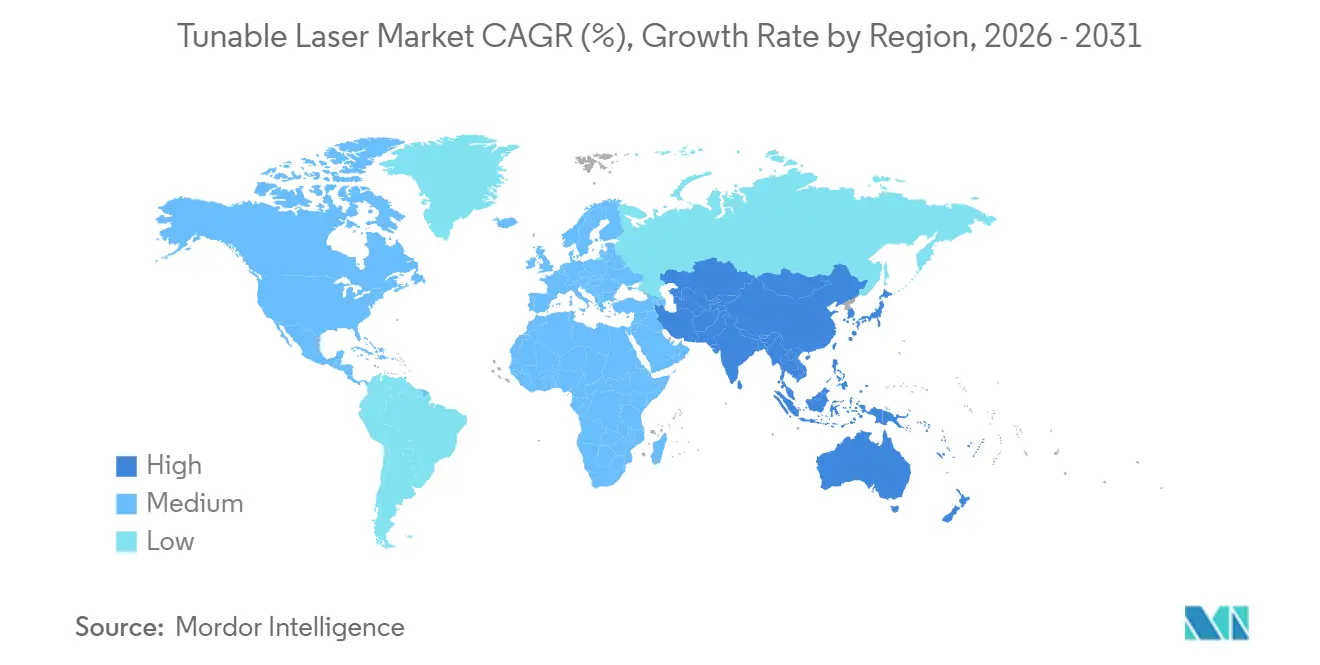
- By geography, Asia-Pacific accounted for 47.92% of 2025 revenue, whereas the Middle East is expected to expand at a 9.44% CAGR through 2031.
Note: Market size and forecast figures in this report are generated using Mordor Intelligence’s proprietary estimation framework, updated with the latest available data and insights as of January 2026.
Market Trends and Insights
Drivers Impact Analysis of Tunable Laser Market*
| Driver | (~) % Impact on CAGR Forecast | Geographic Relevance | Impact Timeline |
|---|---|---|---|
| Increased adoption of tunable diode laser gas analyzers | +1.4% | North America and Europe industrial corridors | Medium term (2-4 years) |
| Growing demand for spectroscopy in life sciences | +1.6% | North America and Europe pharma hubs, rising Asia-Pacific CROs | Medium term (2-4 years) |
| Expansion of fiber-optic communication networks | +2.1% | Global, led by Asia-Pacific metro and long-haul projects | Short term (≤ 2 years) |
| Rising deployment in 5G and data-center coherent optics | +1.8% | North America and Asia-Pacific hyperscale campuses, Europe 5G RANs | Short term (≤ 2 years) |
| Emergence of tunable lasers for quantum computing | +0.7% | North America and Europe quantum research clusters | Long term (≥ 4 years) |
| Adoption in chip-scale LiDAR modules for ADAS | +1.2% | Germany, Japan, United States automotive corridors | Medium term (2-4 years) |
| Source: Mordor Intelligence | |||
Increased Adoption of Tunable Diode Laser Gas Analyzers
Industrial emitters are upgrading to in-situ spectroscopy to comply with tighter methane and VOC limits. Tunable diode laser absorption spectroscopy measures trace gases directly in hot, corrosive stacks, eliminating sample conditioning that hampers legacy probes. The U.S. Environmental Protection Agency’s 2024 methane rule triggered a replacement cycle across refineries and LNG terminals.[1]Federal Register Editors, “EPA Methane Rule,” Federal Register, federalregister.gov Yokogawa recorded a 35% year-over-year jump in 2024 TDLAS orders as Middle Eastern operators aligned with ISO 14001 requirements. Semiconductor fabs now use the same technique to control oxygen at sub-ppm levels in atomic-layer deposition tools, underlining cross-industry pull.
Growing Demand for Spectroscopy in Life Sciences
Continuous manufacturing in pharmaceuticals depends on real-time analytics that non-destructively verify active ingredient concentration. FDA’s 2025 guidance accelerated the deployment of inline Raman and mid-IR sensors linked to tunable lasers.[2]U.S. Food and Drug Administration Staff, “Guidance on Continuous Manufacturing,” Food and Drug Administration, fda.gov Quantum-cascade devices scanning the 3-8 µm region enable label-free imaging of lipid metabolism in oncology screening, cutting assay times from days to hours. Swept-source optical coherence tomography, powered by 100 kHz vertical-cavity tunables, is moving beyond ophthalmology into cardiology suites, broadening the clinical installed base.
Expansion of Fiber-Optic Communication Networks
Global bandwidth growth from AI workloads and 8K video is driving carriers to overlay coherent 400G wavelengths on existing fiber. Software-defined provisioning relies on tunable C-band lasers that can lock to any of 96 DWDM channels. NTT’s 2025 metro rollout cut the power per transported terabit by 30% compared with fixed-wavelength architectures.[3]NTT Researchers, “400 G Coherent Optical Networks,” NTT Technical Review, ntt-review.jp Subsea operators adopt the same approach to counter fiber aging, dynamically shuffling channels away from Raman-induced loss. Updated ITU-T G.698.2 specifications that mandate ±1.8 GHz stability further standardize tunable performance.
Rising Deployment in 5 G and Data-Center Coherent Optics
Mobile fronthaul links and campus backbones now purchase small-form-factor pluggables that embed narrow-linewidth tunable lasers plus DSPs. Hyperscalers adopted 800G ZR modules in 2025 to extend connectivity beyond 80 km without dark fiber builds. Lumentum booked more than USD 200 million in coherent DCI revenue in the same period, underscoring demand for plug-and-play tunability. Transport engineers benefit from inventory savings because one module self-configures across the C-band, replacing dozens of fixed-wavelength SKUs.
Restraints Impact Analysis of Tunable Laser Market*
| Restraint | (~) % Impact on CAGR Forecast | Geographic Relevance | Impact Timeline |
|---|---|---|---|
| Complexity in system design and function | -0.9% | Global SMEs in emerging markets | Short term (≤ 2 years) |
| High capital cost of narrow-linewidth tunable lasers | -1.1% | Cost-sensitive Asia-Pacific and South America segments | Medium term (2-4 years) |
| Supply-chain constraints for specialty semiconductor materials | -0.8% | North America and Europe module makers | Short term (≤ 2 years) |
| Thermal drift and wavelength stability challenges in harsh sites | -0.7% | Industrial and automotive installs worldwide | Medium term (2-4 years) |
| Source: Mordor Intelligence | |||
Complexity in System Design and Function
Coherent 400 G modules require wavelength accuracy within ±1.8 GHz over a 40 °C temperature swing, requiring closed-loop piezo or MEMS cavity control. Start-ups lacking advanced simulation and environmental test assets struggle to pass IEC 61300-3-35 reliability trials. A 2024 field return at a top transceiver vendor traced to control-loop overshoot that induced mode hops during temperature cycling. Such missteps prolong qualification and lock smaller players out of volume contracts.
High Capital Cost of Narrow-Linewidth Tunable Lasers
External-cavity or quantum-cascade units can list at USD 15,000 in low volumes, three to five times the price of a comparable fixed-wavelength part. Emerging carriers in Southeast Asia perceive limited ROI despite lifecycle savings. The 2024 CHIPS and Science Act prioritized logic and memory, leaving photonics fabs without scale subsidies. Rental and pay-per-use schemes launched in 2025 lower barriers for some mid-tier operators, yet uptake remains modest outside North America.
*Our forecasts treat driver/restraint impacts as directional, not additive. The impact forecasts reflect baseline growth, mix effects, and variable interactions.
Tunable Laser Market Segment Analysis
By Type:
C-Wave Dominance Anchors Telecom BuildoutsC-wave devices held the leading 33.57% share of the tunable laser market in 2025, reflecting entrenched use in dense wavelength-division multiplexing systems that ride the 1530-1565 nm gain plateau of erbium amplifiers. Telecom operators favor these parts because upgrades preserve existing amplifier chains, shrinking capex cycles. External-cavity lasers enable long-haul coherent transport with ≤100 kHz linewidth, supporting 64-QAM formats over oceanic spans. Optical parametric oscillators, while niche in shipment volume, are set for a 9.21% CAGR driven by mid-IR defense countermeasure and pharma analytics pull, revealing white space away from C-band incumbency. Other variants, such as distributed Bragg reflector and vertical-cavity sources, address short-reach data-center links where footprint and BOM cost outweigh the tuning range.
Hybrid III-V-on-silicon prototypes recorded in 2025 aim to reduce costs by co-packaging indium phosphide gain chips with silicon photonics passive waveguides. Once yields mature, the approach could shift type preferences toward integrated external cavities that dovetail with CMOS foundries, boosting overall efficiency in the tunable laser market. Defense funding for terahertz photomixing using dual-wavelength tunables foreshadows a longer-horizon “other types” disruption, yet pump-laser power and crystal temperature stability remain engineering bottlenecks.



By End-User Industry:
Defense Accelerates Frequency-Agile SystemsManufacturing and industrial retained 42.89% of 2025 revenue thanks to continuous-emissions monitoring and combustion control deployments. Tunable diode laser spectroscopy is now standard on new gas turbines, cementing a steady equipment-replacement cadence. Aerospace and defense, however, is projected to compound at 9.47% through 2031, powered by frequency-hopping rangefinders, space-based optical links, and early directed-energy demonstrators. Lockheed Martin’s 2024 contract for 1550 nm ultra-narrow lasers on satellite terminals underscores this shift.
Telecommunication and networking devices absorb the bulk of C-band output, yet margin pressure mounts as pluggable coherent modules commoditize. Healthcare relies on vertical-cavity swept-source designs that deliver 100 kHz scans for ophthalmic angiography, a procedure newly reimbursed by the U.S. CMS since 2024. Research institutes continue to pioneer quantum-dot and microcomb approaches that later migrate into volume segments, preserving academia’s role as an innovation testbed.
By Wavelength Range:
Mid-Infrared Gains From Molecular SpecificityNear-infrared units spanning 700-1500 nm accounted for 36.78% of 2025 revenue, owing to telecom’s lock-in to low-loss fiber windows and mature indium phosphide epitaxy. Mid-infrared devices above 2500 nm are on track for a 9.29% CAGR as EU industrial-emissions rules demand inline NOx and SOx tracking where absorption cross-sections peak. Quantum-cascade lasers at 4.3 µm achieve ≤1 ppm CO₂ detection, bolstering carbon-capture tax-credit compliance under U.S. IRS guidance.
Visible-band tunables remain essential in flow cytometry and optogenetics despite LED encroachment, thanks to sub-nm spectral purity that minimizes photobleaching. Short-wave infrared (1500-2500 nm) bridges telecom and sensing, supporting moisture analysis in food lines and polymer QA in battery casings. The wavelength mix thus mirrors application pull rather than pure technology push, reinforcing a diversified tunable laser market.
By Tuning Mechanism:
MEMS Disrupts Mechanical IncumbentsTemperature tuning still led the tunable laser market with 39.74% of the market share in 2025, as low-cost coarse selection suffices for passive optical networks. Yet MEMS actuation, expanding at a 9.32% CAGR, delivers sub-10 µs wavelength hops and 100 kHz sweep rates demanded by catheter-based OCT imaging. Thorlabs’ 2024 release of a MEMS-tuned external cavity with 50 kHz linewidth validated commercial readiness.
Current-tuned devices cater to burst-mode data-center ports but encounter mode-hop limitations beyond a few nanometers. While mechanical grating tuners are favored in laboratories for their ultra-wide tuning capabilities, their moving parts pose challenges due to shock-and-vibration concerns, especially in automotive LiDAR applications. The introduction of a new linearity metric in ISO 16331-1:2025 is steering future Optical Coherence Tomography (OCT) designs towards Micro-Electro-Mechanical Systems (MEMS) implementations, hinting at a slow but steady market share transition.
Geography Analysis
APAC Tunable Laser Market
Asia-Pacific accounted for 47.92% of 2025 revenue, as China vertically integrated indium phosphide epitaxy and lowered coherent module pricing by 25% versus 2023 levels. Domestic suppliers met Huawei’s 400 G coherent launch in 2024, though reported narrow-linewidth yields trail global averages by 10-15 points. Japan leverages precision MEMS and optics know-how yet cedes volume shipments to lower-cost mainland fabs, focusing instead on subsystem exports.
North America Tunable Laser Market
North America benefits from hyperscale cloud builds and defense space programs. Lumentum’s California wafer expansion slated for 2026 adds 40% capacity against chronic indium-phosphide shortages. The CHIPS Act funds packaging R&D but remains thin on photonic front-end subsidies, thereby preserving reliance on imports for raw wafers. Canada and Mexico absorb spillover demand for distributed acoustic sensing in energy corridors, anchoring regional diversification.
EMEA and South America Tunable Laser Market
Europe’s growth centers on automotive LiDAR adoption. Germany’s tier-1 suppliers locked multi-year commitments with Coherent for MEMS-tuned 1550 nm sources that will ship into 2027 electric platforms. Horizon Europe’s EUR 1.2 billion photonics budget backs hybrid integration pilots that could equalize cost with Asia-Pacific post-2028. The Middle East, while starting from a smaller base, is set for a 9.44% CAGR thanks to Saudi Arabia’s NEOM fiber plan and the UAE’s 10 G-PON tender, which specifies software-defined WDM enabled by tunable lasers. South America and Africa remain cost-constrained, yet pilot rural DWDM backbones in Brazil and South Africa preview latent upside once fiber penetration matures.

Regulatory Landscape
Safety and market-access requirements for tunable-laser-enabled systems are being shaped by updates to international and regional standards across telecom, medical, and workplace safety. In Europe, the CENELEC publication of EN IEC 60601-2-22:2020/A11:2026 (January 2026) aligns laser medical equipment safety with EU Medical Device Regulation (MDR) 2017/745 expectations, which affects qualification paths for swept-source OCT and other clinical systems that integrate tunable sources. For optical communications beyond fiber, EN IEC 60825-12:2026 (May 2026) sets safety requirements for laser-based free space optical communication systems (FSOCS), reinforcing design, labeling, and installation controls for information transmission deployments.
Trade and security controls also influence sourcing and cross-border shipment of laser equipment and embedded software. In the United States, export compliance is governed by the Export Administration Regulations (EAR), including 15 CFR Part 774 (Commerce Control List), which frames classification and licensing obligations for laser-related hardware and related technology. Separately, telecom-facing performance interoperability continues to be constrained by standards such as ITU-T recommendations used in optical networks, where tight wavelength stability requirements in coherent DWDM ecosystems translate into compliance-driven design targets for tunable C-band lasers.
Value Chain Analysis
The tunable laser value chain starts with specialty raw materials (notably gallium and indium), moves through substrate and epitaxy steps (including indium phosphide wafers and III-V gain structures), and then proceeds to core device fabrication, including external-cavity, DBR, VCSEL-based, and quantum-cascade variants. Downstream, packaging and assembly (hermetic sealing, fiber coupling, and increasingly silicon photonics and co-packaged optics integration) are key value-add steps. Module and subsystem integration then brings tunable lasers into coherent pluggables, spectroscopy analyzers, OCT engines, and emerging space and defense optical terminals. The market remains sensitive to InP materials availability and high-yield packaging capacity, as qualification and reliability testing often becomes a gating step for volume ramps.
In 2026, value creation and bargaining power are shifting toward integration-ready suppliers and manufacturing scale that serve AI infrastructure and high-density interconnects. NVIDIA and Lumentum signed a multiyear strategic agreement in March 2026 that includes a USD 2 billion NVIDIA investment to expand Lumentum manufacturing capacity for advanced optics and laser components, pointing to a premium on secure domestic supply and manufacturable laser building blocks. At the device-to-system interface, partnerships such as Pilot Photonics with Finchetto (March 2026) and design selections such as MBRYONICS choosing Pilot Photonics tunable lasers for terabit-per-second space optical communication transceivers (June 2026) show how system architects are pulling tunable sources upstream into tightly coupled photonic platforms, increasing the importance of standardized packaging, automated test, and PIC-compatible laser architectures.
Competitive Landscape
Competition is moderate, with the five largest vendors, Lumentum, Coherent, NeoPhotonics, MACOM, and Santec holding roughly 45-50% combined 2025 share. Scale advantages in indium phosphide epitaxy and hermetic packaging let incumbents price aggressively while funding multi-year roadmaps for 1.6T pluggable optics. Lumentum’s 2025 capacity uplift answers hyperscaler backlogs, whereas Coherent secured a USD 75 million LiDAR laser contract that diversifies revenue beyond telecom.
Smaller firms exploit white space in mid-IR quantum-cascade and chip-scale FMCW architectures. Insight Photonic and Freedom Photonics pursue automotive design-ins, banking on Level-3 autonomy volumes outpacing fiber optics by decade-end. Patent filings for hybrid III-V-on-silicon lasers rose above 200 in 2024-2025, underscoring a pivot to CMOS-aligned production that could compress cost curves. Standards bodies such as IEEE P802.3dj tighten frequency-stability specs, marginalizing distributed-feedback incumbents and favoring external-cavity innovation.
Packaging integration now dictates differentiation. Co-packaging lasers with DSPs and TIAs inside a single pluggable cuts parasitics and 2 W of module power, a critical advantage as thermal envelopes cap at 15 W for 800 G optics. Quantum-dot suppliers like QD Laser demonstrated room-temperature tunables that eliminate thermoelectric coolers, potentially saving 25% module power and widening margins in edge-compute nodes.
Tunable Laser Industry Leaders
Lumentum Operations LLC
Coherent Inc.
Keysight Technologies Inc.
Newport Corporation
Santec Corporation
- *Disclaimer: Major Players sorted in no particular order
Tunable Laser Market Companies Covered in this Report
- Lumentum Operations LLC
- Coherent Inc.
- EKSPLA UAB
- EXFO Inc.
- Keysight Technologies Inc.
- HÜBNER GmbH and Co. KG
- Sacher Lasertechnik GmbH
- Newport Corporation
- Santec Corporation
- Thorlabs Inc.
- TOPTICA Photonics AG
- Finisar Corporation
- Luna Innovations Incorporated
- NeoPhotonics Corporation
- NKT Photonics A/S
- ID Photonics GmbH
- Jenoptik AG
- EMCORE Corporation
- TeraXion Inc.
- APE Angewandte Physik & Elektronik GmbH

Market Opportunities and Future Outlook
A key opportunity is in scaling tunable and narrow-linewidth laser integration within silicon photonics and co-packaged optics supply chains, which are being reshaped by AI data center architectures. In 2026, Tower Semiconductor and Scintil Photonics announced the availability of heterogeneously integrated DWDM laser sources on Tower’s silicon photonics platform (February 2026), and Lumentum announced a new 240,000-square-foot manufacturing facility in Greensboro, North Carolina to produce InP-based optical devices for AI data centers (March 2026). These moves highlight whitespace for suppliers that can deliver manufacturable, PIC-friendly tunable sources and qualified packaging flows that reduce lead times and ease multi-vendor module qualification.
Another opportunity is extending tunable sources beyond traditional C-band telecom into O-band and expanded-band coherent and sensing use cases, where compact integration and high power are differentiators. Chilas released and began shipping the ATLAS 1310 O-band wavelength-tunable laser in June 2026, highlighting demand for tunable sources tailored to data center interconnect architectures and AI infrastructure. On the technology side, recent demonstrations of monolithically integrated L-band laser modules with wide tuning and high output power (reported by researchers in April 2026) reinforce the pipeline for integrated tunable designs that can be translated into manufacturable components for C+L band networking, precision spectroscopy, and emerging photonic systems that prioritize footprint and stability.
Recent Industry Developments in Tunable Laser Market
- June 2026: Chilas confirmed the official release and shipping of the ATLAS 1310 O-band wavelength-tunable laser based on a hybrid photonic integration platform. The launch expands commercially available tunable options beyond the C-band focus of coherent transport into O-band architectures used in data center interconnects. It also reinforces the shift toward integrated, packageable tunable sources that fit PIC-centric system designs.
- March 2026: Pilot Photonics announced a partnership with Finchetto to integrate Pilot Photonics nanosecond tunable lasers into Finchetto fully optical passive network switches for AI data center applications. The collaboration connects tunable-laser performance with switching fabrics where wavelength agility and integration density matter. It signals deeper co-design between laser vendors and optical-compute interconnect platforms rather than standalone component selling.
- December 2025: Lumentum announced a USD 150 million expansion of its California indium-phosphide fab, targeting 40% more tunable-laser output by Q3 2026. The capacity addition addresses supply tightness for narrow-linewidth sources used in coherent pluggables and related high-volume optical modules. It also strengthens Lumentum ability to support hyperscaler and telecom procurement cycles that prioritize continuity of qualified sources.


Tunable Laser Market Report Scope and Research Methodology
Market Definition and Coverage
The tunable laser market is defined as revenues earned from lasers whose output wavelength can be adjusted across a defined range, sold for use in telecom and networking, industrial measurement, healthcare imaging, and research instruments, across global demand.
Scope exclusions: Fixed-wavelength laser sources, standalone passive optics, and general lab services that do not include a tunable laser product sale are excluded from coverage.
Segments Covered in This Report
- By Source Type
- C-wave
- External Cavity Lasers
- Optical Parametric Oscillators
- Other Source Types
- By End-User Industry
- Manufacturing and Industrial
- Telecommunication and Networking Devices
- Healthcare
- Aerospace and Defense
- Research and Academia
- By Wavelength Range
- Visible (400-700 nm)
- Near-Infrared (700-1500 nm)
- Short-Wave Infrared (1500-2500 nm)
- Mid-Infrared (Above 2500 nm)
- By Tuning Mechanism
- Temperature-Tuned
- Current-Tuned
- MEMS-Tuned
- Mechanical Grating-Tuned
- By Geography
- North America
- United States
- Canada
- Mexico
- Europe
- Germany
- United Kingdom
- France
- Russia
- Rest of Europe
- Asia-Pacific
- China
- Japan
- India
- South Korea
- Australia
- Rest of Asia-Pacific
- Middle East and Africa
- Middle East
- Saudi Arabia
- United Arab Emirates
- Rest of Middle East
- Africa
- South Africa
- Egypt
- Rest of Africa
- Middle East
- South America
- Brazil
- Argentina
- Rest of South America
- North America
Data Sources, Market Sizing, and Validation
Desk Research
Desk research sets the frame for what to count and how fast key end markets are moving. We refer to public sources such as the US Bureau of Labor Statistics and US Census trade statistics, World Bank macro indicators, the International Telecommunication Union for connectivity and traffic signals, and IEEE or Optica publications for technology adoption and performance trends.
Along with these, company annual reports, investor presentations, product datasheets, and credible press releases are used to understand product positioning and typical price bands for tunable wavelength ranges and tuning mechanisms. Patent databases and an import-export shipment-level dataset also help in checking innovation intensity and the direction of cross-border movement for key optical components and assemblies. The desk sources listed here are illustrative, and other public references were also used for data collection, validation, and clarification.
Primary Interviews and Surveys
Primary work was used to pressure-test assumptions that are hard to observe in public data, such as real-world adoption timing and how pricing changes with wavelength range and tuning mechanism. We spoke with a balanced mix of laser OEMs, component suppliers, system integrators, distributors, and end users across telecom, industrial, healthcare, and research, with coverage across APAC, EMEA, and the Americas to reflect where demand is actually placed.
Distribution of primary research fieldwork respondents
| Company type | Respondent position | Region |
|---|---|---|
| Top tier: 30% | CXOs: 12% | APAC: 47% |
| Mid tier: 51% | Functional/Unit leaders: 32% | EMEA: 35% |
| Smaller Players: 19% | Managers: 56% | Americas: 18% |
Market-Sizing & Forecasting
Market size is built using a top-down approach where optical networking, industrial instrumentation, and healthcare equipment demand indicators are translated into a tunable-laser demand pool, then filtered by typical penetration and replacement behavior. To keep the totals realistic, the outputs are cross-checked with selective bottom-up approximations, such as sampled average selling prices multiplied by estimated unit shipments for key use cases, and adjusted when the two views drift.
Key inputs in the model include coherent optical transport upgrade cycles, data center interconnect buildouts, emissions monitoring deployments, the shift toward MEMS-based tuning in certain systems, and observed pricing bands by wavelength range and tuning mechanism. Where bottom-up signals are incomplete, gaps are handled by using proxy ratios from adjacent photonics components, followed by expert confirmation on what is reasonable for the year.
For forecasting, scenario analysis is used because end-market spend and product mix can move differently across cycles. Scenarios are anchored to expert consensus on drivers like telecom capex timing, industrial measurement adoption, and healthcare equipment procurement patterns. Assumptions are kept simple, documented, and revisited if new signals indicate a change in demand timing or ASP progression.
Data Validation & Update Cycle
Before finalizing, we run multi-step checks so the outputs do not conflict with independent signals, including regional capex trends, telecom equipment shipment direction, and pricing movement seen in public disclosures. When a large variance appears, the drivers are traced back to the assumption level, and relevant experts are re-contacted to confirm whether a demand shift or a modeling input caused the change.
The draft model and narrative go through analyst reviews that focus on logic consistency across regions and end uses, followed by a final sign-off pass that checks the math, units, and year alignment. Reports are refreshed annually, and interim updates are made when material events occur, after which a final pre-delivery review is completed so clients receive the latest view.
Mordor Intelligence's Tunable Laser Market Sizing Compared With Other Published Estimates
Published numbers for this market often spread out because firms do not count the same thing, even when they use the same market name. The biggest differences usually come from what is included as a tunable laser, the end-use mix assumed, and how price changes are applied over the forecast window.
The main gap comes from scope creep into broader laser categories and adjacent photonics modules. Mordor Intelligence counts revenues only when the product sold is a tunable laser source rather than a bundled system value. Differences also show up when one estimate assumes faster ASP erosion for mature telecom use cases, while another assumes premium pricing persists due to tighter specs in spectroscopy and sensing. Currency timing and refresh cadence can further shift the current-year figure, especially when the model relies on different base-year alignment.
Benchmark comparison
| Source | Market Size | Gaps in Research Methodology |
|---|---|---|
| Mordor Intelligence | USD 15.59 B (2025) | |
| Industry Publisher A | USD 1.47 B (2024) | Uses a narrower product-value lens that appears closer to tunable laser products sold into selected applications, which can exclude higher-value telecom and industrial deployments captured in broader market accounting. |
| Industry Publisher B | USD 18.88 B (2023) | Likely applies a wider definition that may blend tunable lasers with broader laser system revenues and aggressive growth assumptions, which can inflate totals when end-system value is counted instead of source-level revenue. |
Looking across the table, the spread is largely explained by what is counted as the revenue unit, and how end-use weighting and ASP movement are handled across years. By tying the model to clear demand indicators and then sanity-checking with sampled ASP and volume logic, we keep the estimate traceable and easier to reproduce when assumptions are updated.


Key Questions Answered in the Report
What will be the value of the tunable laser market in 2031?
The market is forecast to reach USD 26.03 billion by 2031, growing at an 8.69% CAGR from 2026.
Which region currently generates the highest revenue?
Asia-Pacific led in 2025 with 47.92% of global revenue owing to integrated indium-phosphide supply chains and aggressive fiber buildouts.
Which segment is projected to grow fastest by tuning mechanism?
MEMS-tuned devices are expected to post a 9.32% CAGR through 2031 because their rapid sweep rates suit advanced medical imaging and automotive LiDAR.
How are tunable lasers used in 5 G networks?
How are tunable lasers used in 5G networks?
Why is mid-infrared witnessing accelerated adoption?
Stricter industrial-emissions regulations and chemical-agent detection needs favor mid-infrared quantum-cascade lasers that align with molecular absorption fingerprints.
What is driving growth in aerospace and defense applications?
Frequency-agile rangefinders, space optical links, and directed-energy prototypes require narrow-linewidth tunable lasers, pushing the segment toward a 9.47% CAGR to 2031.
Page last updated on:


 Your data is secure and never sold or shared.


