Switch Mode Power Supply Transformers Market Size and Share
Market Overview
| Study Period | 2020 - 2031 |
|---|---|
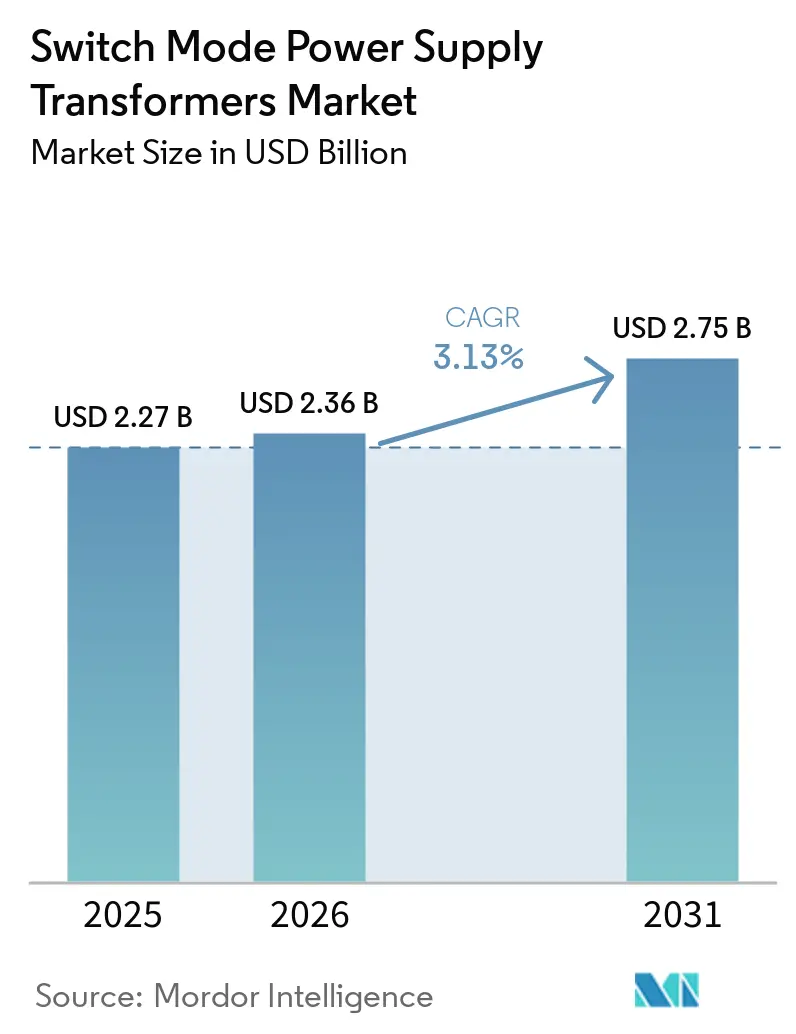
| Market Size (2026) | USD 2.36 Billion |
| Market Size (2031) | USD 2.75 Billion |
| Growth Rate (2026 - 2031) | 3.13% CAGR |
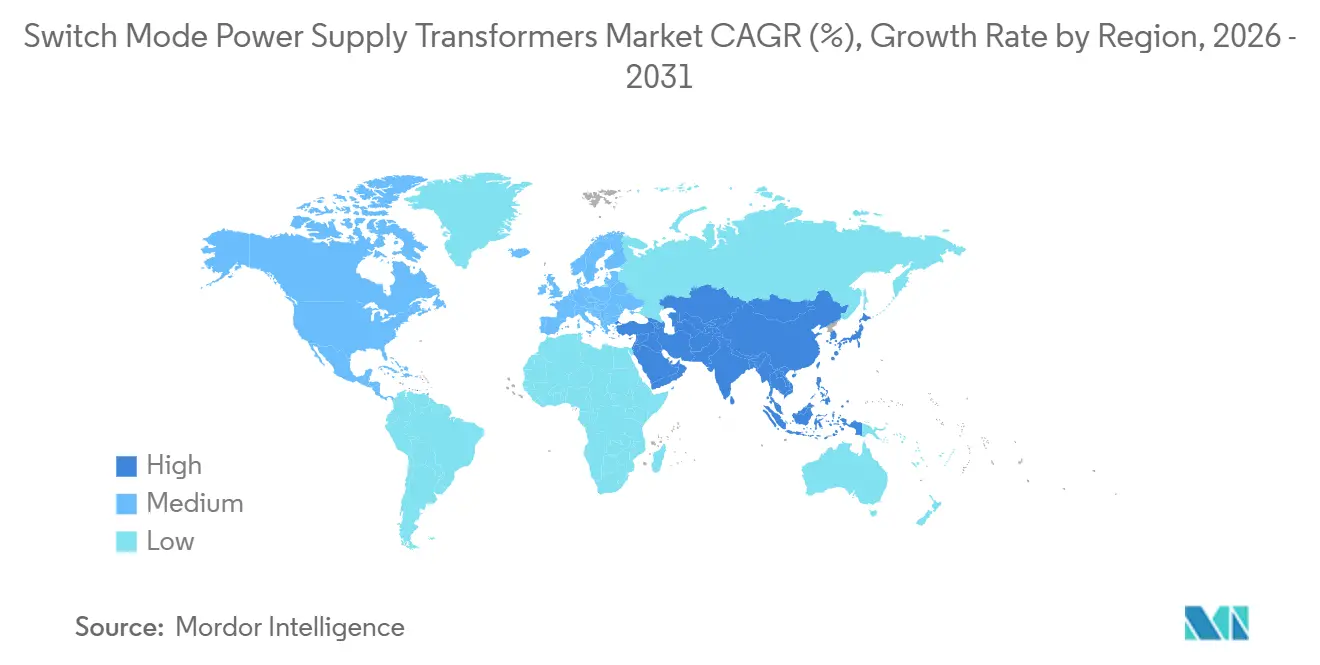
| Fastest Growing Market | Middle East and Africa |
| Largest Market | Asia Pacific |
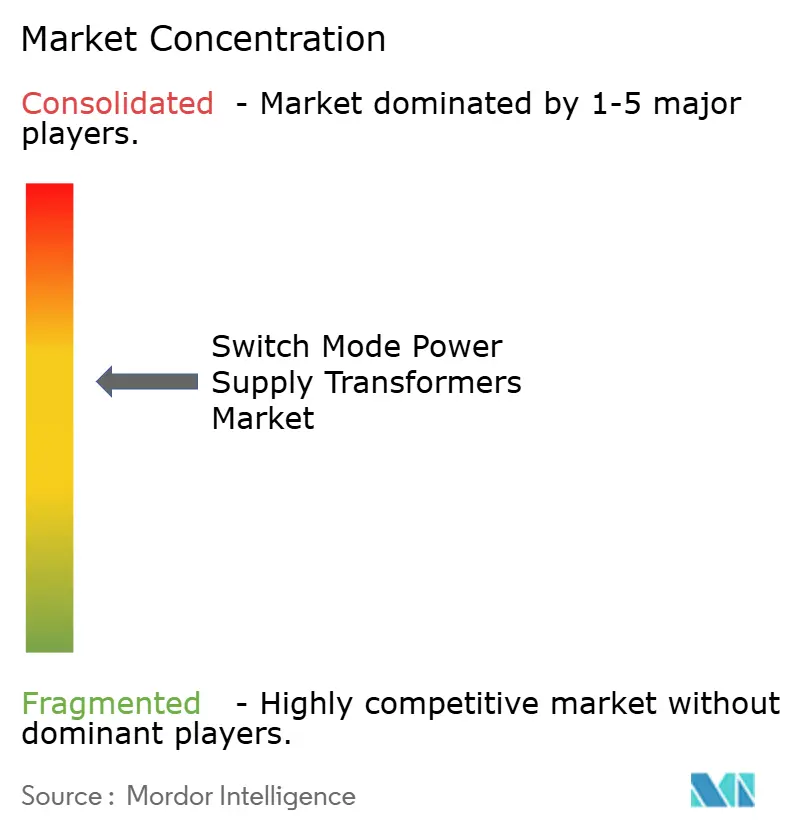
| Market Concentration | Medium |
Major Players *Disclaimer: Major Players sorted in no particular order Image © Mordor Intelligence. Reuse requires attribution under CC BY 4.0. | |
Switch Mode Power Supply Transformers Market Analysis by Mordor Intelligence
The switch-mode power supply transformers market size was valued at USD 2.27 billion in 2025 and estimated to grow from USD 2.36 billion in 2026 to reach USD 2.75 billion by 2031, at a CAGR of 3.13% during the forecast period (2026-2031). The switch-mode power supply transformers market is realigning around high-frequency gallium nitride and silicon carbide power stages that shrink magnetic footprints, raise efficiency above 95%, and reduce thermal loads in dense server racks. Consumer-device makers are embracing USB Power Delivery 3.1 profiles that demand 140-watt adapters no thicker than a smartphone, while data-center operators are shifting to 48-volt rack architectures that halve conduction losses. Automotive on-board chargers and renewable micro-inverters are adopting nanocrystalline cores to meet 500-kilohertz switching targets, and Asia-Pacific manufacturers continue to dominate production with labor-saving automation. Raw-material volatility and extended qualification cycles for medical-grade units temper headline growth, yet premium niches, such as radiation-hardened transformers for low-Earth-orbit satellites, command price premiums that sustain profitability.
Key Report Takeaways
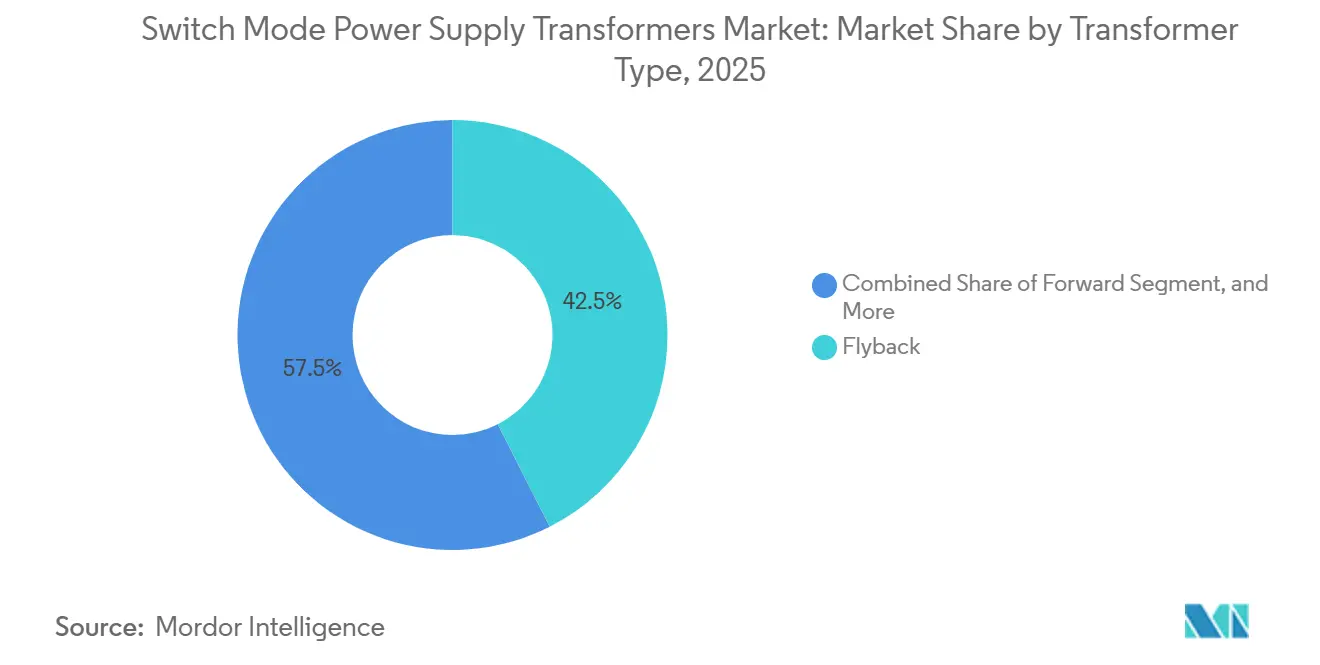
- By transformer type, flyback units led with 42.52% of the switch-mode power supply transformers market share in 2025, while resonant LLC converters are projected to expand at a 3.95% CAGR through 2031.
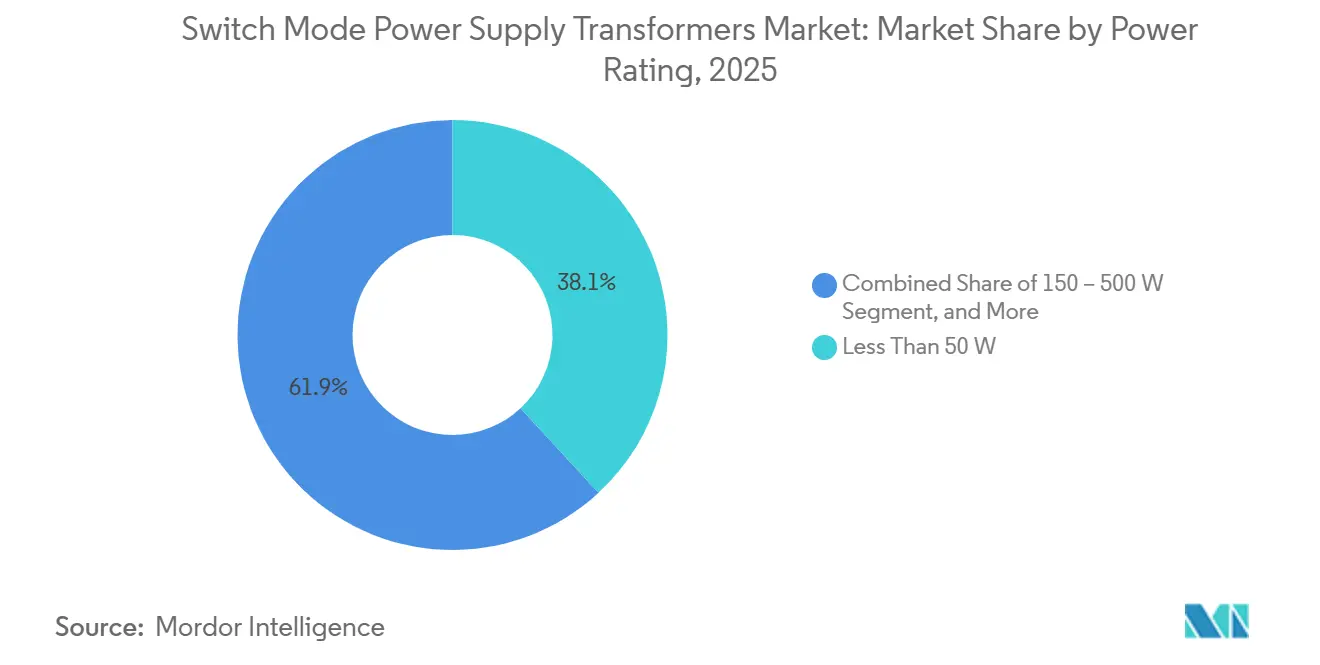
- By power rating, units below 50 watts accounted for 38.11% of the switch-mode power supply transformer market in 2025, whereas the 500-to-1,000-watt bracket is forecast to grow at a 3.78% CAGR through 2031.
- By core material, ferrite captured 54.18% of revenue in 2025, and nanocrystalline alloys represent the fastest-growing tier with a 3.73% CAGR over 2026-2031.
- By application, consumer electronics accounted for 36.43% of revenue in 2025, while renewable energy and EV charging are advancing at a 3.83% CAGR through 2031.
- By geography, Asia-Pacific accounted for 57.32% of revenue in 2025, and the Middle East is set to record the fastest regional expansion at a 4.01% CAGR through 2031.
Note: Market size and forecast figures in this report are generated using Mordor Intelligence’s proprietary estimation framework, updated with the latest available data and insights as of January 2026.
Market Trends and Insights
Drivers Impact Analysis of Switch Mode Power Supply Transformers Market*
| Driver | (~) % Impact on CAGR Forecast | Geographic Relevance | Impact Timeline |
|---|---|---|---|
| Growing Adoption of Energy-Efficient Power Electronics in Consumer Devices | +0.8% | Global, concentrated in Asia-Pacific and North America | Medium term (2-4 years) |
| Expansion of Industrial Automation and Control Systems | +0.7% | Global, led by Europe and Asia-Pacific manufacturing hubs | Long term (≥4 years) |
| Proliferation of Telecom 5G Infrastructure Roll-Outs | +0.6% | Asia-Pacific, North America, Middle East | Short term (≤2 years) |
| Electrification of Low-Power Renewable Micro-Inverters | +0.5% | North America, Europe, Middle East and Africa solar markets | Medium term (2-4 years) |
| Shift Toward Gallium-Nitride Based SMPS Topologies | +0.5% | Global, with early uptake in data centers and automotive | Medium term (2-4 years) |
| OEM Demand for Ultrathin Planar Transformers in Wearables and IoT Sensors | +0.3% | Asia-Pacific manufacturing, global end-use | Short term (≤2 years) |
| Source: Mordor Intelligence | |||
Growing Adoption of Energy-Efficient Power Electronics in Consumer Devices
Device makers must achieve standby power below 0.3 watts, a limit conventional flyback designs struggle to meet. Gallium-nitride switching above 500 kilohertz lowers losses by 40% and allows cores to shrink from EE-19 to EE-13 while still delivering 65-watt outputs.[1]Infineon Technologies, “Wide Band Gap Semiconductors – GaN HEMT,” Infineon, infineon.com European Ecodesign and California Title 20 standards are updated every 3 years, forcing rapid redesign cycles. Planar transformers reduce height to 3 millimeters, enabling integration in ultra-slim laptops. USB-IF Power Delivery 3.1 raises output to 140 watts, pushing magnetic designers to handle peak currents above 5 amperes within smartphone-sized adapters. Together, these forces accelerate the adoption of gallium nitride and underpin premium pricing in the switch-mode power supply transformer market.
Expansion of Industrial Automation and Control Systems
Programmable logic controllers migrating to 24-volt buses require isolated converters that survive 2-kilovolt surges and 100,000-hour operating lifetimes. Skin-effect losses at 200 kilohertz drive the adoption of litz-wire windings, while forward-converter topologies with active clamps cut heat by 20%. Collaborative robots impose intermittent peaks that complicate thermal design; triple-insulated wire meets IEC 61131-2 isolation rules. Variable-frequency drives are projected to hit 35% motor-control penetration by 2028, adding auxiliary supply demand. These factors raise mid-range unit volumes in the switch-mode power supply transformers market.
Proliferation of Telecom 5G Infrastructure Roll-Outs
5G base stations consume triple the power of 4G, necessitating -48-volt to 12-volt converters compliant with ITU L.1210. Lithium-ion backup systems rated for 99.9% availability require bidirectional transformers with symmetric leakage inductance. A 3-kilowatt rectifier launched in 2025 achieved 96% efficiency and freed 25% rack space using a planar transformer. Open-RAN architectures fragment power specs, and ETSI EN 300 132-2 electromagnetic limits drive shield-winding demand. These rollouts increase demand for high-current transformers in the switch-mode power supply market.
Electrification of Low-Power Renewable Micro-Inverters
Micro-inverters mitigate shading losses and need 25-year outdoor transformers. Nanocrystalline cores cut losses 30% at 100 kilohertz, yet raise manufacturing cost by 50% due to brittleness. Gallium nitride reference designs reduce transformer volume by 35% and fit within junction boxes. Vehicle-to-grid pilots demand 5-kilovolt isolation and 8-millimeter creepage to earn UL 1741 listing. These requirements drive premium-grade revenue in the switch-mode power supply transformer market.
Restraints Impact Analysis of Switch Mode Power Supply Transformers Market*
| Restraint | (~) % Impact on CAGR Forecast | Geographic Relevance | Impact Timeline |
|---|---|---|---|
| Volatility in Ferrite Core Raw-Material Prices | -0.4% | Global, acute in Asia-Pacific manufacturing | Short term (≤2 years) |
| Rising Design Complexity and Qualification Costs for Medical-Grade SMPS | -0.3% | North America and Europe, spillover to Asia-Pacific | Medium term (2-4 years) |
| Supply-Chain Disruptions for High-Permeability Nanocrystalline Alloys | -0.2% | Global, premium segments most affected | Medium term (2-4 years) |
| Thermal Management Challenges in High-Frequency Designs (>1 MHz) | -0.2% | Global, early adopters in data centers and automotive | Short term (≤2 years) |
| Source: Mordor Intelligence | |||
Volatility in Ferrite Core Raw-Material Prices
Manganese-zinc ferrite costs increased by 20% following production cuts in China late in 2024, and US tariffs imposed in 2025 added a 25% cost burden. These factors have created a challenging pricing environment for manufacturers. Additionally, nickel price volatility, driven by policy changes in Indonesia, has further complicated the production of high-frequency grades, adding to market uncertainty. Smaller suppliers are particularly impacted, as they are required to maintain 120-day inventory buffers to mitigate supply chain disruptions, which ultimately erode their profit margins. Meanwhile, despite their advantages, amorphous ribbons remain 30% more expensive and are prone to brittleness, making them less favorable for widespread adoption.[2] IEEE, “Supply Chain Challenges for Nanocrystalline Magnetic Materials,” IEEE, ieeexplore.ieee.org These combined dynamics are exerting pressure on the near-term profitability of the switch-mode power supply transformers market, creating a complex landscape for industry players to navigate.
Rising Design Complexity and Qualification Costs for Medical-Grade SMPS
IEC 60601-1 mandates two means of patient protection, requiring 4-kilovolt isolation and glow-wire testing that add nine months to programs. Certification fees reach USD 25,000 per model and favor incumbents with amortized labs. CISPR 11 emissions limits drive custom shield windings that increase material costs by 15%. Hospital procurement now includes cybersecurity evidence per FDA guidance, widening the scope and inflating budgets by 30%. These burdens dampen the entry of smaller players into the switch-mode power supply transformer industry.
*Our forecasts treat driver/restraint impacts as directional, not additive. The impact forecasts reflect baseline growth, mix effects, and variable interactions.
Switch Mode Power Supply Transformers Market Segment Analysis
By Transformer Type:
Resonant Designs Capture Efficiency PremiumResonant LLC converters are projected to post a 3.95% CAGR through 2031, outpacing the overall switch-mode power supply transformers market. Zero-voltage switching between transformer leakage inductance and external tank capacitors eliminates hard-switch losses, enabling 96-98% peak efficiency that trims cooling loads in hyperscale racks. In April 2026, Delta released a 1,000-watt 48-volt module, achieving 95% efficiency at 25% load, saving USD 45 per server per year in energy costs. Flyback units, while accounting for 42.52% of revenue in 2025, face an efficiency ceiling near 90% and tighter standby limits in premium chargers. Forward and push-pull topologies remain prevalent on industrial and aerospace platforms that value tight regulation and simple center-tap designs. The cumulative effect sustains high-mix demand, while resonant architectures set the upgrade trajectory for the switch-mode power supply transformer market.
Designers are integrating planar windings and litz conductors to curb AC resistance as frequency surpasses 500 kilohertz. Gate-drive transformers now share cores with main power stages, compressing board area. Half-bridge and full-bridge converters dominate kilowatt-class rectifiers, leveraging full flux swings to lower copper loss, though their four-switch count inflates cost. Push-pull units persist in legacy automotive electronics where symmetric drive and cost simplicity matter. As gallium-nitride devices drop in price, resonant LLC and active-clamp forward designs will proliferate, keeping competitive pressure high across the switch-mode power supply transformers market.


By Core Material:
Nanocrystalline Alloys Move into Automotive and Renewable SegmentsFerrite contributed 54.18% of revenue in 2025, anchoring the low-cost, mass-market segment of the switch-mode power supply transformer market. Nonetheless, nanocrystalline ribbons exhibit 30% lower loss at 100 kilohertz and permeability above 100,000, thereby reducing copper turns and winding resistance.[3]IEEE, “Nanocrystalline Soft Magnetic Alloys for High-Frequency Applications,” IEEE, ieeexplore.ieee.org Automotive on-board chargers and renewable micro-inverters justify the 40-50% material premium by meeting 500-kilohertz switching targets without overheating. Lead times of 6 to 8 months and brittleness limit adoption in consumer units. Amorphous metal cores, despite similar loss advantages, suffer from a low saturation flux density, which increases their physical size and limits their use to low-frequency industrial drives. Powdered iron, favored for flyback power-factor-correction circuits, provides distributed air gaps that avert saturation under DC bias but sustain higher magnetization losses above 200 kilohertz.
Material substitution dynamics will keep procurement teams vigilant as the switch-mode power supply transformer market gradually tilts toward nanocrystalline options for high-value applications. Production lines are adding laser-welded core stacks and vacuum impregnation to mitigate ribbon brittleness. Vertical integration among top suppliers secures ferrite powder quality and cushions price swings, whereas niche vendors differentiate through soft-magnetic composites that enable three-dimensional flux paths in planar designs. Over the forecast horizon, the cost-to-loss calculus will determine whether nanocrystalline volumes grow fast enough to dent ferrite’s dominant share of the switch-mode power supply transformer market.
By Power Rating:
Mid-Range Brackets Accelerate on EV and Telecom DemandUnits rated 500-1,000 watts are projected to expand at a 3.78% CAGR, driven by on-board chargers for electric vehicles, telecom rectifiers, and industrial servo drives. High-density rack power supplies leverage active-clamp or resonant stages paired with planar transformers whose z-height remains below 10 millimeters. Lower brackets below 50 watts, although holding 38.11% revenue in 2025, are moderating as phone shipments plateau and universal USB-C chargers reduce SKU counts. The 50-150 watt niche serves laptop and monitor markets, where planar cores and gallium nitride switches coexist to keep adapter thickness under 15 millimeters. Heavy-duty segments above 1,000 watts, covering welding and UPS systems, advance more slowly because legacy electromechanical relays and longer qualification timelines impede rapid redesign.
Current density trends indicate that the switch-mode power supply transformers market will remain polarized between commodity low-power adapters and premium mid-range modules that win on efficiency. Segment suppliers are extending copper-foil windings, adding thermal vias, and adopting immersion-cooling compatible varnishes. Bourns’ SRP1024HMCT and HRP3822X series underline this push, offering DC resistance as low as 0.11 milliohms. As 48-volt e-mobility converters target 22-kilowatt outputs in sub-3-liter packages, designers will increasingly favor resonant and interleaved topologies with nanocrystalline cores, solidifying the mid-range as the focal battleground in the switch-mode power supply transformer market.
By Application:
Renewables and EV Charging Surge AheadRenewable energy and EV charging are set to grow at a 3.83% CAGR, outpacing every other vertical in the switch-mode power supply transformers market. Distributed solar micro-inverters integrate outdoor-rated transformers with 25-year life targets, while bidirectional vehicle-to-grid pilots in California require 5-kilovolt isolation and reinforced insulation. Consumer electronics, at 36.43% revenue in 2025, remain the volume king but are migrating toward gallium-nitride fast-charge adapters that slim margins. Industrial automation needs 100,000-hour transformers and 2-kilovolt surge immunity, fostering long-term contracts with vertically integrated vendors. Telecom infrastructure adopting 5G focuses on 48-volt rectifiers with 20-millisecond hold-up times, driving demand for high-density planar magnetics.
Medical devices must comply with IEC 60601-1, third edition, rules, stretching design cycles, and pushing small firms toward contract labs. Aerospace and defense segments, though niche, pay 100% premiums for radiation-hardened cores and vacuum-impregnated windings that survive launch vibration. These varied requirements illustrate why the switch-mode power supply transformers market size balances commodity scale with specialty profits. Strategic sourcing hinges on regional compliance, lead-time certainty, and insulation system qualification. Vendors offering application-specific reference designs gain stickiness that pulls winding, core, and shielding content together, expanding their wallet share within customers’ bills of materials and reinforcing leadership positions across the switch-mode power supply transformer market.
Geography Analysis
APAC Switch Mode Power Supply Transformers Market
Asia-Pacific maintains its production stronghold, accounting for 57.32% of 2025 global revenue, as China, Japan, and South Korea leverage automation to offset wage inflation. Contract assemblers cluster near ferrite powder mills, enabling sub-four-week lead times that Western peers struggle to match. Government subsidies for wide-bandgap semiconductor fabs also pull magnetic supply chains closer to gallium-nitride device makers, reinforcing the regional grip on the switch-mode power supply transformers market.
GCC Switch Mode Power Supply Transformers Market
The Middle East is projected to log a 4.01% CAGR, the fastest worldwide, as Saudi Arabia and the United Arab Emirates commit 62 gigawatts of renewables and erect hyperscale data centers for sovereign AI programs. Utilities pre-order transformers three to four years ahead, rewarding suppliers with local inventory hubs and bilingual field-service teams. Transformer volumes in this region are increasingly specifying 55-degree-Celsius ambient ratings and sand-resistant varnishes, opening niche opportunities for ruggedized designs in the switch-mode power supply transformer market.
The Americas, Europe and Africa Switch Mode Power Supply Transformers Market
North America and Europe grow more slowly because installed bases are mature and qualification cycles run up to 18 months. Yet both regions purchase premium medical-grade, aerospace, and defense units that are priced 20-30% above commercial averages and require 4-kilovolt isolation. US tariffs on Chinese ferrite, imposed in 2025, push assemblers to diversify sources to Vietnam and India, elongating approval timelines but spurring localized winding capacity. South America and Africa represent smaller slices yet are adding telecom towers and off-grid solar kits that require wide-input-range converters, sustaining a modest tailwind for the switch-mode power supply transformer market share.

Competitive Landscape
The top-10 suppliers account for approximately 55-60% of revenue, indicating a moderately concentrated switch-mode power supply transformer market. Leading players such as Murata, TDK, and Würth Elektronik leverage their vertically integrated ferrite production capabilities and automated multilayer winding lines to maintain dominance in high-volume consumer applications. Meanwhile, Bourns and Coilcraft cater to industrial and automotive clients by offering custom planar designs with extended operating temperature ranges of -40 to +150 degrees, which command a 25% premium. Additionally, Delta and TDK introduced PMBus-enabled 1,000-watt and 1,500-watt modules in April 2026, which reduce cooling overhead by up to 15%, marking a shift toward digitally managed power solutions.[4]TDK Corporation, “Power Transformers for Switching Power Supplies,” TDK, product.tdk.com
Smaller players, such as Shilchar Technologies and Hang Tung Electronic, focus on niche markets by providing rapid prototypes and accommodating minimum order quantities of 1,000 units or fewer, making them attractive to robotics startups. Patent filings indicate a growing trend toward integrated magnetics, in which transformers and inductors share the same nanocrystalline core, a design innovation expected to reduce board area by 20%. Despite these advancements, significant opportunities remain in ultra-low-profile transformers for augmented-reality headsets, which are limited to a height of 3 millimeters, and in radiation-hardened variants for satellite buses. Both of these segments offer substantial premiums, highlighting untapped potential in the market.
Overall, the switch-mode power supply transformer market is driven by advancements in process automation, vertical material integration, and the development of reference-design ecosystems. These factors are critical for companies aiming to gain a competitive edge and expand their market share. As the industry evolves, the focus on innovation and customization will likely continue to shape the competitive landscape, enabling players to address emerging demands in various applications, including consumer electronics, industrial systems, and specialized technologies.
Switch Mode Power Supply Transformers Industry Leaders
Murata Manufacturing Co., Ltd.
TDK Corporation
Würth Elektronik eiSos GmbH & Co. KG
Sumida Corporation
Yageo Corporation
- *Disclaimer: Major Players sorted in no particular order
Switch Mode Power Supply Transformers Market Companies Covered in this Report
- Murata Manufacturing Co., Ltd.
- TDK Corporation
- Würth Elektronik eiSos GmbH & Co. KG
- Yageo Corporation
- Bourns, Inc.
- Sumida Corporation
- Tamura Corporation
- Vishay Intertechnology, Inc.
- Delta Electronics, Inc.
- MEAN WELL Enterprises Co., Ltd.
- Bel Fuse Inc.
- Triad Magnetics Holdings LLC
- Coilcraft, Inc.
- Premier Magnetics, Inc.
- Hammond Manufacturing Company Limited
- Shenzhen Zhongce Etron Electronic Co., Ltd.
- Hang Tung Electronic Technology Co., Ltd.
- Shilchar Technologies Limited
- Stontronics Ltd.
- Talema Group LLC

Recent Industry Developments in Switch Mode Power Supply Transformers Market
- April 2026: Delta Electronics unveiled the Chameleon Series 48-volt 1,000-watt power supply with 95% efficiency and PMBus telemetry, aimed at hyperscale data centers.
- April 2026: TDK Corporation released the PFE1500FB 1,500-watt AC-DC module, reaching 92% efficiency and digital monitoring for AI server clusters.
- September 2025: Bourns expanded its SRN5040TA-P automotive inductor family, which is rated AEC-Q200 for EV battery-management systems.
- July 2025: Bourns introduced the SRP1024HMCT series for data-center point-of-load converters, maintaining z-height below 5 millimeters.


Global Switch Mode Power Supply Transformers Market Report Scope
The switch-mode power supply (SMPS) transformers market refers to the global industry focused on the design, manufacturing, and commercialization of transformers specifically used in switch-mode power supplies to efficiently convert and regulate electrical power across a wide range of electronic systems. These transformers operate at high frequencies, enabling compact size, reduced energy losses, and improved power efficiency compared to traditional linear power supply transformers, making them essential components in modern electronic and electrical infrastructure.
The Switch Mode Power Supply Transformers Market Report is Segmented by Transformer Type (Flyback, Forward, Half-Bridge and Full-Bridge, Push-Pull, and Resonant LLC), Power Rating (Less Than 50 W, 50-150 W, 150-500 W, 500-1,000 W, and Greater Than 1,000 W), Core Material (Ferrite, Powdered Iron, Nanocrystalline, and Amorphous Metal), Application (Consumer Electronics, Industrial Automation and Control, Telecommunications, Medical Devices, Renewable Energy and EV Charging, Aerospace and Defense, and Data Centers), and Geography (North America, Europe, Asia-Pacific, Middle East, Africa, and South America). The Market Forecasts are Provided in Terms of Value (USD).
Segmentation Overview
| Flyback |
| Forward |
| Half-Bridge and Full-Bridge |
| Push-Pull |
| Resonant LLC |
| Less Than 50 W |
| 50 – 150 W |
| 150 – 500 W |
| 500 – 1000 W |
| Greater Than 1000 W |
| Ferrite |
| Powdered Iron |
| Nanocrystalline |
| Amorphous Metal |
| Consumer Electronics |
| Industrial Automation and Control |
| Telecommunications |
| Medical Devices |
| Renewable Energy and EV Charging |
| Aerospace and Defense |
| Data Centers |
| North America | United States |
| Canada | |
| Mexico | |
| Europe | Germany |
| United Kingdom | |
| France | |
| Russia | |
| Rest of Europe | |
| Asia-Pacific | China |
| Japan | |
| India | |
| South Korea | |
| Australia | |
| Rest of Asia-Pacific | |
| Middle East | Saudi Arabia |
| United Arab Emirates | |
| Rest of Middle East | |
| Africa | South Africa |
| Egypt | |
| Rest of Africa | |
| South America | Brazil |
| Argentina | |
| Rest of South America |
| By Transformer Type | Flyback | |
| Forward | ||
| Half-Bridge and Full-Bridge | ||
| Push-Pull | ||
| Resonant LLC | ||
| By Power Rating | Less Than 50 W | |
| 50 – 150 W | ||
| 150 – 500 W | ||
| 500 – 1000 W | ||
| Greater Than 1000 W | ||
| By Core Material | Ferrite | |
| Powdered Iron | ||
| Nanocrystalline | ||
| Amorphous Metal | ||
| By Application | Consumer Electronics | |
| Industrial Automation and Control | ||
| Telecommunications | ||
| Medical Devices | ||
| Renewable Energy and EV Charging | ||
| Aerospace and Defense | ||
| Data Centers | ||
| By Geography | North America | United States |
| Canada | ||
| Mexico | ||
| Europe | Germany | |
| United Kingdom | ||
| France | ||
| Russia | ||
| Rest of Europe | ||
| Asia-Pacific | China | |
| Japan | ||
| India | ||
| South Korea | ||
| Australia | ||
| Rest of Asia-Pacific | ||
| Middle East | Saudi Arabia | |
| United Arab Emirates | ||
| Rest of Middle East | ||
| Africa | South Africa | |
| Egypt | ||
| Rest of Africa | ||
| South America | Brazil | |
| Argentina | ||
| Rest of South America | ||


Key Questions Answered in the Report
What is the current value of the switch mode power supply transformers market?
The switch mode power supply transformers market size stands at USD 2.36 billion in 2026 and is on track to reach USD 2.75 billion by 2031, according to Mordor Intelligence.
How fast is the market expected to grow through 2031?
The market is projected to register a CAGR of 3.13% between 2026 and 2031, based on Mordor Intelligence data.
Which transformer topology is growing the quickest?
Resonant LLC converters are forecast to expand at a 3.95% CAGR, the fastest among all topologies in the switch mode power supply transformers market.
Which region shows the highest growth outlook?
The Middle East is expected to log the highest regional CAGR at 4.01% through 2031 due to large renewable and data-center investments.
What material trend is shaping premium applications?
Nanocrystalline cores, offering 30% lower loss at high frequencies, are the fastest-growing material segment with a 3.73% CAGR as reported by Mordor Intelligence.
How concentrated is supplier competition?
The top-10 players capture roughly 55-60% of global revenue, indicating moderate concentration with room for specialized regional firms.
Page last updated on:


