
Tire Material Market Size and Share
Market Overview
| Study Period | 2021 - 2031 |
|---|---|
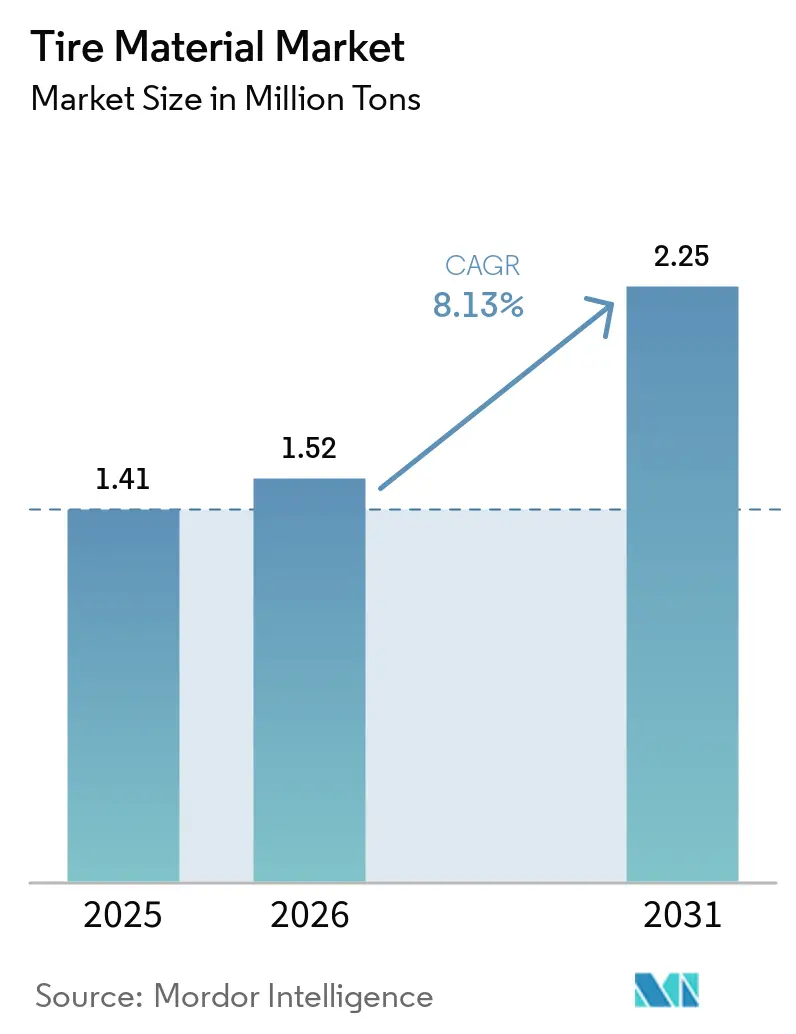
| Market Volume (2026) | 1.52 Million tons |
| Market Volume (2031) | 2.25 Million tons |
| Growth Rate (2026 - 2031) | 8.13 % |
| Fastest Growing Market | Middle East and Africa |
| Largest Market | Asia Pacific |
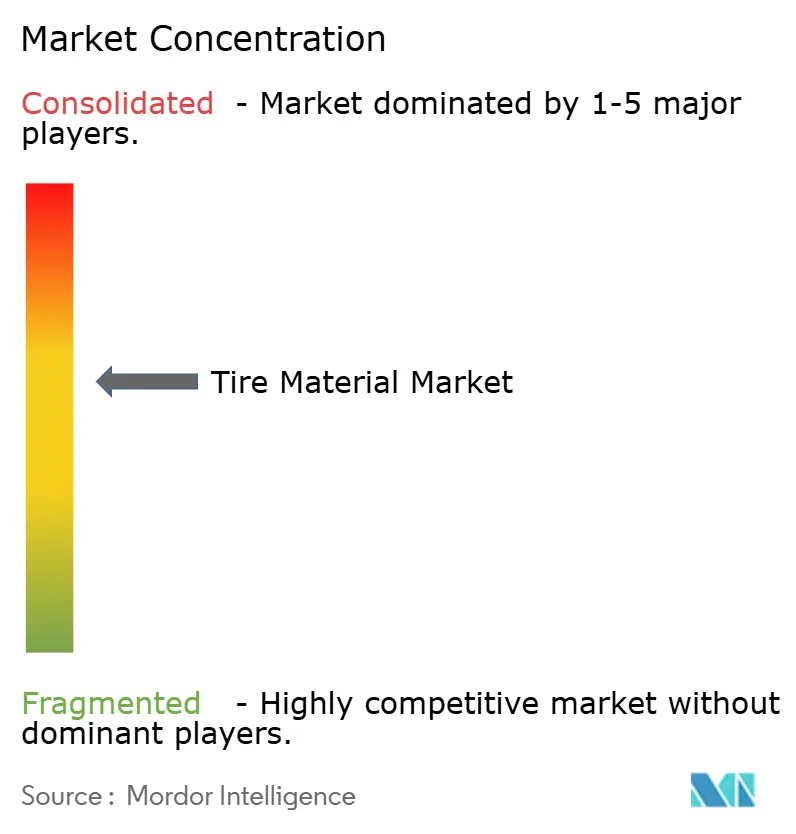
| Market Concentration | Medium |
Major Players *Disclaimer: Major Players sorted in no particular order Image © Mordor Intelligence. Reuse requires attribution under CC BY 4.0. | |
Tire Material Market Analysis by Mordor Intelligence
The Tire Material Market size is expected to grow from 1.41 million tons in 2025 to 1.52 million tons in 2026 and is forecast to reach 2.25 million tons by 2031 at 8.13% CAGR over 2026-2031. Demand is climbing as automakers lock in low-rolling-resistance tread formulas for fuel-economy compliance, e-commerce fleets shorten replacement cycles, and Southeast Asian governments court foreign direct investment that localizes compounding. Mix shifts rather than sheer tonnage now shape profitability: silica-rich compounds fetch premiums for electric-vehicle range gains, while bio-based plasticizers create a sustainable upsell for fleet buyers. Competitive strategies center on regional capacity additions close to tire plants, patented silane coupling agents that cement customer loyalty, and digital models that cut formulation time. Regulation is the wild card, with the prospective European PFAS ban and stricter PAH limits forcing reformulation budgets higher yet also opening niches for alternative chemistries.
Key Report Takeaways
- By material type, elastomers led with 42.94% of tire material market share in 2025, and are anticipated to grow with the fastest CAGR of 9.4% through 2031.
- By vehicle type, passenger cars held 32.88% of 2025 volume, and heavy trucks are slated to post the steepest rise at a 5.98% CAGR through 2031 on the back of long-haul electrification.
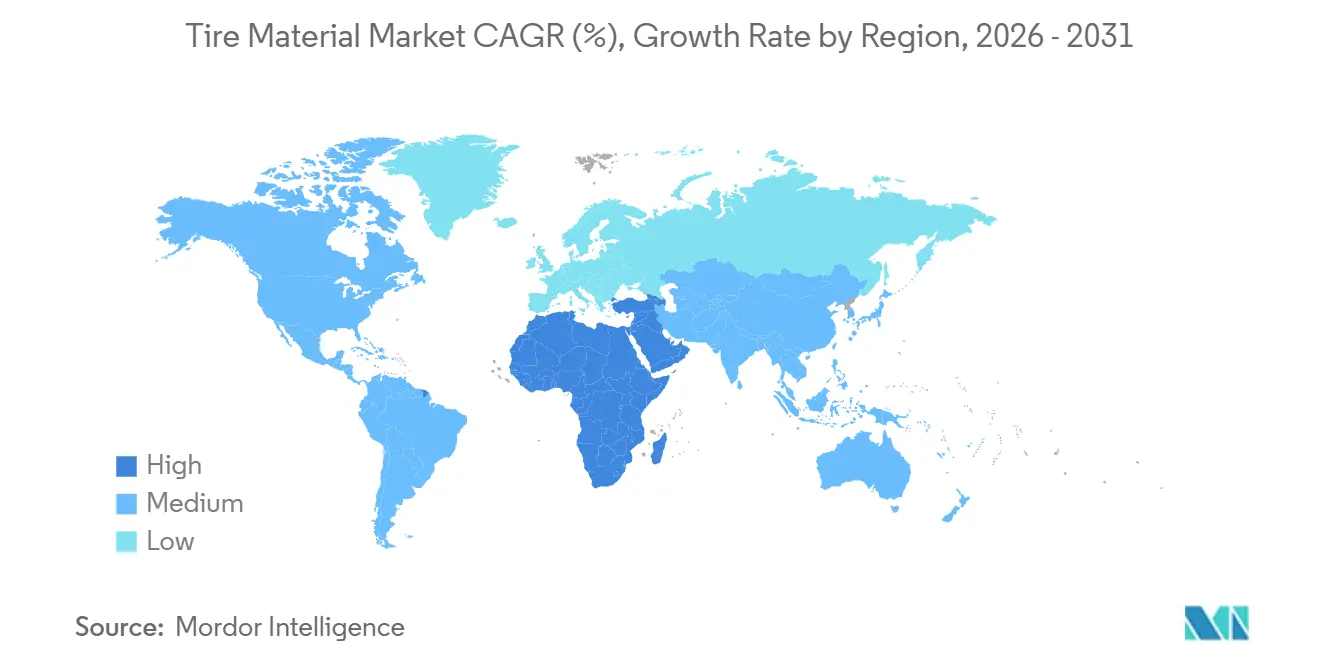
- By geography, Asia-Pacific captured 52.34% of 2025 demand; the Middle East and Africa record the quickest pace with a 5.88% CAGR through 2031 as Saudi and UAE infrastructure programs swell commercial-vehicle fleets.
Note: Market size and forecast figures in this report are generated using Mordor Intelligence’s proprietary estimation framework, updated with the latest available data and insights as of 2026.
Market Trends and Insights
Drivers Impact Analysis of Tire Material Market*
| Drivers | (~) % Impact on CAGR Forecast | Geographic Relevance | Impact Timeline |
|---|---|---|---|
| OEM shift toward low-rolling-resistance compounds | +2.1% | Global, led by EU and North America | Medium term (2-4 years) |
| Surge in e-commerce boosting replacement-tire mileage | +1.8% | North America, Europe, APAC urban corridors | Short term (≤ 2 years) |
| Re-industrialization of Southeast Asia creating new local tire plants | +1.5% | ASEAN core (Thailand, Vietnam, Indonesia) | Long term (≥ 4 years) |
| Bio-based plasticizers adopted to meet VOC limits | +1.3% | EU, spill-over to North America and China | Medium term (2-4 years) |
| Demand for smart tires driving conductive rubber compound innovation | +0.9% | Global, early gains in premium passenger-car segments | Long term (≥ 4 years) |
| Source: Mordor Intelligence | |||
OEM Shift Toward Low-Rolling-Resistance Compounds
Silica-rich treads now feature in baseline specifications because the European Union penalizes rolling resistance above 6.5 kg/ton, and U.S. CAFE rules follow a comparable threshold[1]Evonik Industries, “Silica Enables Low Rolling Resistance,” corporate.evonik.com. Continental’s EcoContact 7 adopts 18-22% precipitated silica and solution SBR, lowering rolling resistance by 15% and extending electric-vehicle range by 3-4%. The trade-off involves longer cure cycles and a USD 1.50–2.00 uplift per tire, which costs OEMs to absorb to protect warranty metrics. Compliance with ISO 28580 assures that the claimed gains withstand laboratory scrutiny. As a result, silica demand tracks electric-vehicle adoption curves, locking in double-digit volume growth even as carbon-black volumes flatten.
Surge in E-Commerce Boosting Replacement-Tire Mileage
Last-mile delivery has pushed light-commercial-vehicle mileage up 18-25% since 2024, cutting replacement intervals below 32,000 km. Amazon’s global van fleet alone cycles tires every 10-12 months, a cadence that favors high-durability carbon-black-rich compounds blended with natural rubber for tear strength. Bridgestone bundles supply, embedded sensors, and analytics, slicing fleet tire expense by 8-12%. Because replacement tires face laxer labeling rules, compounders privilege wear life over efficiency without regulatory friction. As urban logistics matures, this driver stabilizes near-term tonnage, especially in North America and Europe.
Re-Industrialization of Southeast Asia Creating New Local Tire Plants
Thailand, Vietnam, and Indonesia attracted USD 2.8 billion of tire FDI during 2024-2025 through tax holidays and proximity to plantations. Bridgestone’s 450,000 tons per annum Rayong plant sources 65% of its natural rubber within 300 km, cutting freight cost by USD 0.10/kg and slashing lead time to 72 hours. Cabot and Birla follow with local carbon-black expansions, while specialty chemicals still ship from Western hubs under patent cover. Weaker enforcement of REACH-like rules lets regional plants trial experimental grades faster, accelerating product cycles. The outcome is a bifurcated supply chain of local commodity inputs and imported high-value additives.
Bio-Based Plasticizers Adopted to Meet VOC Limits
REACH Annex XVII caps PAH content below 3 ppm, effectively banning traditional aromatics. Epoxidized soybean oil now leads the replacement roster, cutting VOC emissions 60-75% in mixing while adding USD 0.50 per tire in compound cost. Goodyear moved soybean-oil plasticizers into 30% of North American SKUs in 2025 and targets 50% by 2027. OEM sustainability scorecards and ISO 14001 mandates reinforce adoption even outside the EU. Supply security hinges on oilseed crushing capacity scaling at the pace of demand, making Midwest feedstock an emerging strategic asset.
Restraints Impact Analysis of Tire Material Market*
| Restraints | (~) % Impact on CAGR Forecast | Geographic Relevance | Impact Timeline |
|---|---|---|---|
| Looming EU PFAS ban limiting fluorinated additives | -1.2% | EU, potential spill-over to UK and California | Medium term (2-4 years) |
| Climate-linked leaf-fall disease squeezing natural-rubber supply | -0.9% | Southeast Asia (Thailand, Indonesia, Malaysia) | Short term (≤ 2 years) |
| Airless tire architectures reducing material volumes per wheel | -0.6% | North America and EU premium segments | Long term (≥ 4 years) |
| Source: Mordor Intelligence | |||
Looming EU PFAS Ban Limiting Fluorinated Additives
ECHA’s January 2025 proposal would phase out fluoropolymer processing aids within five years, yet tire compounders rely on 0.1-0.3% loadings to cut mold-release force by up to 40%[2]European Chemicals Agency, “PFAS Restriction Proposal,” echa.europa.eu. Bridgestone warns that removing the aids lifts compound viscosity by 15-20 MU and halves green-tire shelf life, raising working-capital needs by EUR 50–80 million across the region. Substitutes based on silicone cost two to three times more and require entire cure-system redesigns. The EU Chemical Strategy for Sustainability hints that even essential-use exemptions could sunset, pressuring tire makers to accelerate research and development now.
Climate-Linked Leaf-Fall Disease Squeezing Natural-Rubber Supply
Fungal outbreaks cut latex yields 30-50% across 18-22% of Thai and Sumatran plantations, pushing RSS-3 spot prices to USD 2.35/kg in late 2025. Michelin upped synthetic-rubber content in passenger-car treads to 62%, buffering supply risk but absorbing higher raw-material costs. Government fungicide programs need 5-7 years to impact yields, so substitution dynamics will persist into the medium term.
*Our forecasts treat driver/restraint impacts as directional, not additive. The impact forecasts reflect baseline growth, mix effects, and variable interactions.
Tire Material Market Segment Analysis
By Material Type:
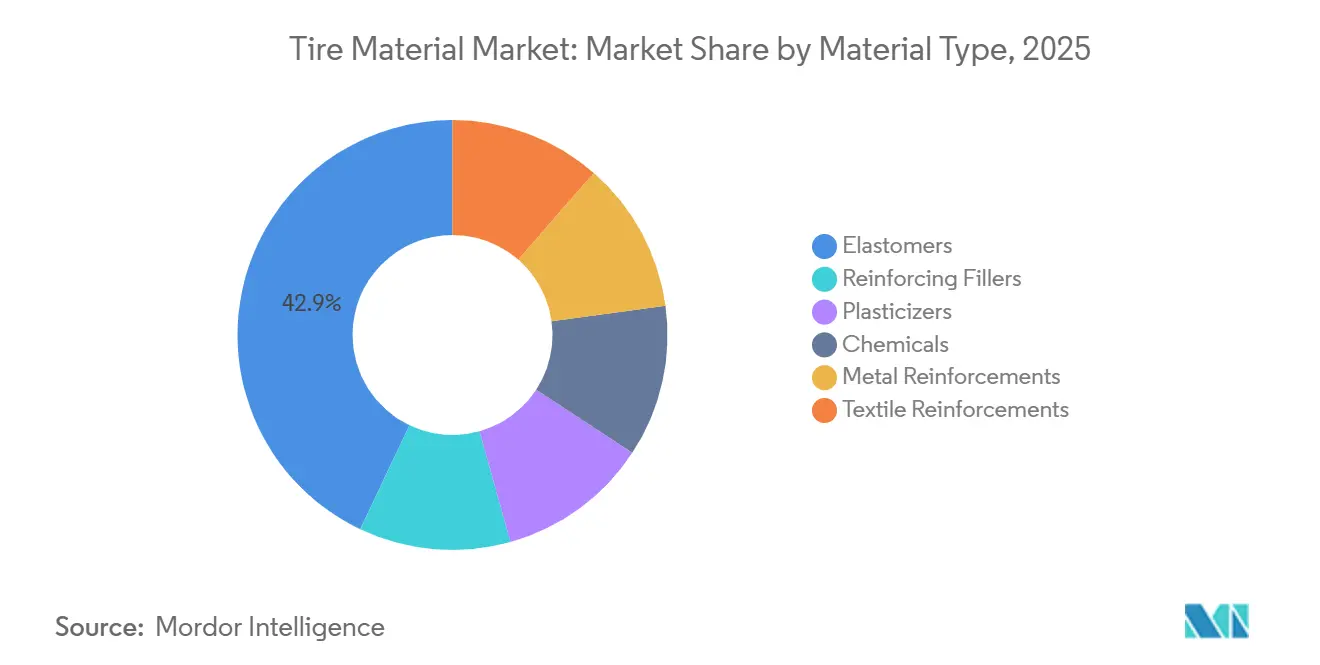
Elastomers Dominate Yet Specialties Gain PaceElastomers held 42.94% of the 2025 volume and are set to grow at 5.51% through 2031. The fillers segment follows, with carbon black still owning 60% of filler tonnage, though precipitated silica earns double-digit growth as OEMs chase efficiency mandates. Plasticizers, chemicals, and Plasticizers, chemicals, and tire reinforcement materials fill the balance, driven by REACH-compliant paraffinic oils and the steady need for steel cord in radial belts. the balance, driven by REACH-compliant paraffinic oils and the steady need for steel cord in radial belts.
In the medium term, bio-based plasticizers enjoy niche yet lucrative traction, while conductive-grade carbon nanomaterials open a fresh revenue stream for suppliers with dispersion know-how. Airless designs temper long-run elastomer tonnage growth, but they lift demand for engineered thermoplastics and fatigue-resistant fibers, proving that overall tire material market demand can rise even as per-tire material intensity inches downward.



By Vehicle Type:
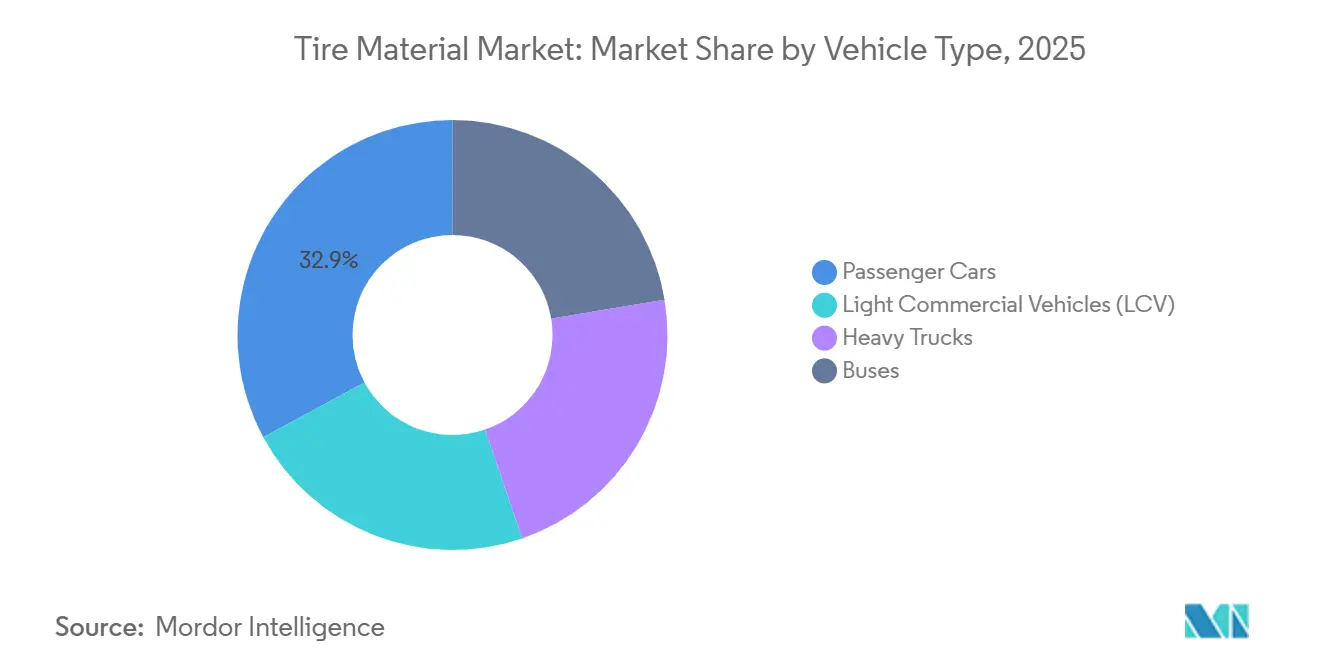
Heavy Trucks Accelerate on ElectrificationPassenger cars contributed 32.88% of 2025 tonnage, buoyed by heavier EV platforms that use more rubber per unit. Heavy trucks, however, post the headline number, expanding at a 5.98% CAGR through 2031. Each electric Class-8 truck needs tires with higher load indices, thicker bead bundles, and reinforced steel belts, lifting material per tire by about 8 kg. Light commercial vehicles keep a stable 22% slice, their volumes propped up by e-commerce route density. Buses remain niche but benefit from government transit investments in South and Southeast Asia. The tire material market share for heavy trucks overtakes buses and LCVs in incremental growth terms, reshaping supplier priorities toward high-strength cords and heat-resistant compounds.
Geography Analysis
APAC Tire Material Market
Asia-Pacific retains leadership with 52.34% of 2025 consumption. China’s vertically integrated ecosystem, from Hainan plantations to Shandong carbon-black plants, keeps average lead times under 48 hours. India’s PLI scheme channels USD 1.2 billion into domestic compounding, unlocking duty rebates on export volumes. Japan and South Korea, though smaller in tonnage, command premium prices through solution SBR and liquid rubber specialities. ASEAN hubs grow on the back of tariff-free raw rubber and seven-year tax holidays, though logistics bottlenecks shave margins.
North America Tire Material Market
North America's demand is driven by high annual mileage and a light-truck-heavy vehicle mix. Mexican plants exploit USMCA duty-free corridors and 40-50% labor savings to support Mexico tire production for both U.S. and South American markets. Canada’s snow-tire research and development spills over into high-silica all-season lines worldwide.
EMEA and South America Tire Material Market
Europe anchors premium and ultra-high-performance segments where compound cost is secondary to handling gains. The Middle East and Africa, at a small base, is anticipated to grow with the fastest CAGR of 5.88% during 2026-2031 as Saudi roadbuilding and UAE logistics muscles expand truck fleets. South America remains import-protected yet currency-volatile, limiting upscale material adoption despite Brazil’s local-content rules.

Value Chain Analysis
The tire material value chain begins with upstream feedstocks, including natural rubber from Southeast Asian plantations, petrochemical-derived monomers for synthetic rubbers, and energy-intensive inputs for carbon black, silica, and curing systems such as insoluble sulfur. These materials move to compounders and material formulators, which blend elastomers with reinforcing fillers, plasticizers, and chemicals, then supply tire manufacturers for mixing, calendaring/extrusion, building, and vulcanization. After tire production, OEM fitment and the replacement channel determine end-market pull. Validation barriers are high, since tire makers typically lock in materials through platform qualification programs (often following PPAP-style approval disciplines), which tends to favor incumbent suppliers with proven consistency, technical service, and regional logistics capability.
Midstream supply resilience has become a differentiator as single-point failures and transit risks propagate quickly across global tire plants. In June 2026, an incident at a 70,000-ton-capacity insoluble sulfur facility in Shandong highlighted how concentrated specialized inputs can tighten supply and increase reformulation and procurement complexity for compounders. Logistics disruptions affecting rubber shipments through the Red Sea and Gulf added multi-day lead-time variability in 2026, reinforcing the shift toward localized sourcing near tire plants, including ASEAN localization moves that combine local commodity inputs (natural rubber, carbon black) with imported high-value additives under patent protection.
Competitive Landscape
The tire material market is moderately consolidated. Birla Carbon’s Indonesian greenfield plant chases ASEAN demand and captures freight arbitrage. Vertical integration is rare; fewer than 15% of tire makers run captive filler lines, choosing merchant flexibility instead. Specialty niches see CNT makers like Arkema and Nanocyl pitching conductive fillers that conventional carbon black cannot match in resistivity. Bio-based plasticizer entrants Cargill and Elevance command green premiums but must scale supply chain credibility. LANXESS wins share through machine-learning-driven compound modeling that slashes formulation cycles to 90 days, giving OEMs a faster route to market for custom tires.
Tire Material Industry Leaders
Cabot Corporation
Birla Carbon
Bridgestone Corporation
Evonik
Orion
- *Disclaimer: Major Players sorted in no particular order
Tire Material Market Companies Covered in this Report
- Bekaert
- Birla Carbon
- Bridgestone Corporation
- Cabot Corporation
- Continental AG
- Evonik
- Exxon Mobil Corporation
- JSR Corporation
- Kuraray Co., Ltd.
- LANXESS
- Linglong Tire
- Michelin
- Orion
- Sailun Group Co., Ltd.
- Sumitomo Rubber Industries, Ltd.
- Umicore
- Zhongce Rubber Group Co., Ltd.

Market Opportunities and Future Outlook
Circular reinforcing fillers and closed-loop material ecosystems represent an identifiable whitespace as tire makers work to secure qualified streams of recovered carbon black (rCB), pyrolysis-derived intermediates, and traceable recycled content that can meet performance validation. Pirelli North America launched a closed-loop recycling initiative in Rome, Georgia in May 2026, using Bolder Industries pyrolysis technology to reintegrate ISCC PLUS-certified rCB into new tire manufacturing. This supports a clearer path for material suppliers that can deliver consistent rCB grades, certification, and technical support at scale. In steel reinforcements, circular sourcing is moving from concept to structured collaboration, with Bekaert and CITIC Special Steel announcing a strategic agreement in July 2026 to develop circular reinforcement materials using recycled steel from end-of-life tires. For bead wire and cord suppliers, the opportunity centers on documenting recycled inputs without compromising tensile and fatigue performance.
Standardized, comparable sustainability disclosure is also creating an unmet need for verified lifecycle data at the material level, rather than only at the finished-tire level. The Tire Industry Project updated Product Category Rules in March 2026 to improve consistency in LCA calculations, including greenhouse gas accounting and biogenic carbon treatment, which increases the value of suppliers that can provide auditable product carbon footprints and chain-of-custody documentation alongside traditional technical datasheets. On the formulation side, drop-in sustainable inputs that reduce factory retooling requirements are receiving more attention, supported by progress updates in December 2025 from Michelin, IFPEN, and Axens on BioButterfly work relating to bio-based butadiene from bioethanol. Interest is also building around premix concepts, including microfibrillated cellulose-based premixes, that aim to substitute inputs while relying on core mixing assets.
Recent Industry Developments in Tire Material Market
- February 2026: Birla Carbon launched a new production line at its Trecate, Italy facility dedicated to finishing and packing Continua Sustainable Carbonaceous Material (SCM). This expands availability of a branded sustainable carbonaceous stream within Europe, supporting tire and compound customers that want lower-impact reinforcing materials with more controlled product handling and consistency.
- October 2025: Bridgestone held a groundbreaking ceremony for a pilot demonstration plant at its Seki Plant to advance precise pyrolysis for recycling end-of-life tires into tire-derived oil and recovered carbon black, with completion targeted for 2027. The investment strengthens in-house circular feedstock development and increases competitive pressure on merchant suppliers to offer certified, tire-grade recovered materials.
- November 2024: Bridgestone announced a 27 billion yen investment plan to expand premium passenger tire capacity at three plants in Japan through 2028, centered on ENLITEN technology adoption. The program supports higher-spec compound systems and increases demand for advanced fillers, specialty elastomers, and sustainable inputs that can meet premium performance and evolving material content targets.


Tire Material Market Report Scope and Research Methodology
Market Definition and Coverage
For this study, the tire material market is defined as the raw and semi-processed inputs that are compounded into new tire production, tracked in volume terms (tons) across major vehicle tire categories and regions.
Scope exclusions: It excludes finished tires, retreading services, and downstream distribution margins for tire products.
Segments Covered in This Report
- By Material Type
- Elastomers
- Natural Rubber
- Synthetic Rubber
- Reinforcing Fillers
- Carbon Black
- Silica
- Plasticizers
- Paraffinic Oil
- Naphthenic Oil
- Aromatic Oil
- Chemicals
- Sulfur
- Zinc Oxide
- Stearic Acid
- Metal Reinforcements
- Steel Cord
- Bead Wire
- Textile Reinforcements
- Nylon
- Polyester
- Others
- Elastomers
- By Vehicle Type
- Passenger Cars
- Light Commercial Vehicles (LCV)
- Heavy Trucks
- Buses
- By Geography
- Asia-Pacific
- China
- Japan
- India
- South Korea
- ASEAN Countries
- Rest of Asia-Pacific
- North America
- United States
- Canada
- Mexico
- Europe
- Germany
- United Kingdom
- France
- Italy
- Spain
- Turkey
- NORDIC Countries
- Russia
- Rest of Europe
- South America
- Brazil
- Argentina
- Rest of South America
- Middle-East and Africa
- Saudi Arabia
- United Arab Emirates
- South Africa
- Rest of Middle-East and Africa
- Asia-Pacific
Data Sources, Market Sizing, and Validation
Desk Research
Desk research is used to set the fact base around tire production volumes, vehicle parc trends, and raw material supply signals that influence tire compound demand. We review public statistics and technical references to understand typical material intensity patterns and how they move with tire mix (radialization, rim sizes, and performance labeling).
Sources used include, for example, national statistics offices for industrial output, UN Comtrade for trade flows in relevant rubber and chemical intermediates, USTMA and ETRMA publications for tire demand indicators, and the International Rubber Study Group for natural and synthetic rubber context. We also refer to customs and port releases, company annual reports and investor presentations, and peer-reviewed polymer and rubber journals to cross-check formulation and usage direction. Where needed, we use paid subscriptions for company financials and intelligence, patent databases, and an import-export shipment-level database to fill gaps in production footprint and material movement signals. These are illustrative examples only, and many other public sources were referenced for data collection, validation, and clarification.
Primary Interviews and Surveys
Primary work is used to validate the demand pool for tire materials and translate secondary indicators into realistic assumptions on material usage per tire. We speak with a mix of material suppliers, tire makers, distributors, and industry experts across APAC, EMEA, and the Americas, so regional mix shifts and pricing pass-through logic are clarified before finalizing the model.
Distribution of primary research fieldwork respondents
| Company type | Respondent position | Region |
|---|---|---|
| Top tier: 36% | CXOs: 18% | APAC: 39% |
| Mid tier: 42% | Functional/Unit leaders: 27% | EMEA: 37% |
| Smaller Players: 22% | Managers: 55% | Americas: 24% |
Market-Sizing & Forecasting
Market sizing is built using a top-down approach where tire production volumes by region and vehicle class are reconstructed and then converted into material demand using material intensity factors from technical references and expert checks. To keep totals consistent, results are corroborated with selective bottom-up approximations, such as sampled supplier volume disclosures, channel checks on key inputs, and sanity checks using indicative ASP ranges multiplied by implied volumes.
Key inputs that shape the model include new tire production by vehicle type, average tire weight and mix shifts toward higher rim sizes, elastomer to filler ratios in common formulations, changes in reinforcement needs tied to radial tire penetration, and the pace of silica adoption for low rolling resistance tires. Forecasting is run using scenario analysis supported by trend consensus from primary experts, which helps separate base demand from cyclical swings in auto production and replacement cycles. Where bottom-up signals are incomplete in smaller countries, we bridge gaps by applying regional intensity benchmarks and then re-checking against trade and production proxies.
Data Validation & Update Cycle
Outputs are validated through multiple checks that compare the model against independent signals like tire production direction, rubber and chemical input availability, and trade movement for relevant intermediates. Large variances are flagged, assumptions are revisited, and follow-up calls are triggered when an input changes the total beyond a reasonable range.
Before sign-off, the work is reviewed in steps so calculation logic, units, and conversions stay consistent across countries and time series. Reports are refreshed annually, and interim updates are made when material events occur, such as sharp feedstock price shifts or major capacity changes. Right before delivery, a fresh pass is completed so clients receive the latest updated view.
Mordor Intelligence's Tire Material Market Estimate Compared With Other Published Estimates
Published market sizes for tire materials can look far apart because the measurement unit, the boundary of what counts as a material, and the demand pool used for the build-up are not always aligned. Differences also come from how replacement versus OEM demand is treated and whether adjacent items like finished tires or broader rubber chemicals are pulled into the same number.
Tire production trends by region, combined with material intensity checks from formulation references and interview feedback, are the evidence points used to keep Mordor Intelligence aligned to a volume-based tire compound demand pool (tons), which avoids mixing value-only assumptions with unrelated downstream margins.
Benchmark comparison
| Source | Market Size | Gaps in Research Methodology |
|---|---|---|
| Mordor Intelligence | USD 1.52 M (2026) | |
| Global Consultancy A | USD 95.38 B (2025) | Reported in value terms and likely applies blended pricing across materials, which can also pull in broader chemicals and reinforcement categories beyond compound demand measured in tons. |
| Industry Publisher B | USD 86.44 B (2025) | Uses a value framework with a different base year setup and may include a wider tire-material basket across tire types, so conversion back to pure compound volume is not directly comparable. |
The table shows that the spread is mainly driven by unit choices and scope boundaries rather than a true disagreement on demand direction. By keeping the model tied to tire output signals and material intensity factors, the estimate stays traceable to clear inputs that can be reviewed and repeated year to year.


Key Questions Answered in the Report
What is the projected volume for the tire material market in 2031?
The tire material market is forecast to reach 2.25 million tons by 2031, expanding at 8.13% CAGR from 2026.
Which material category grows fastest through 2031?
Silica-based reinforcing fillers post the steepest gains as OEMs mandate low-rolling-resistance treads, outpacing traditional carbon black.
How does electrification affect tire material demand?
Electric vehicles use 8-12% more rubber and thicker reinforcements per tire to handle greater curb weights and torque, boosting total tonnage despite efficiency efforts.
What regulatory change poses the greatest near-term risk?
The prospective EU PFAS ban could force compounders to remove fluorinated processing aids within five years, triggering costly reformulations.
Why is Asia-Pacific dominant in tire material supply?
The region combines plantation proximity, integrated carbon-black capacity, government incentives, and rapid vehicle-fleet growth, delivering over half of global volume.
Are airless tires likely to shrink material demand?
Each airless tire uses roughly 30% less elastomer, yet the shift toward high-performance resins and fibers partly offsets the drop, keeping aggregate demand positive.
Page last updated on:


 Your data is secure and never sold or shared.


