Thin Wall Packaging Market Size and Share
Market Overview
| Study Period | 2020 - 2031 |
|---|---|
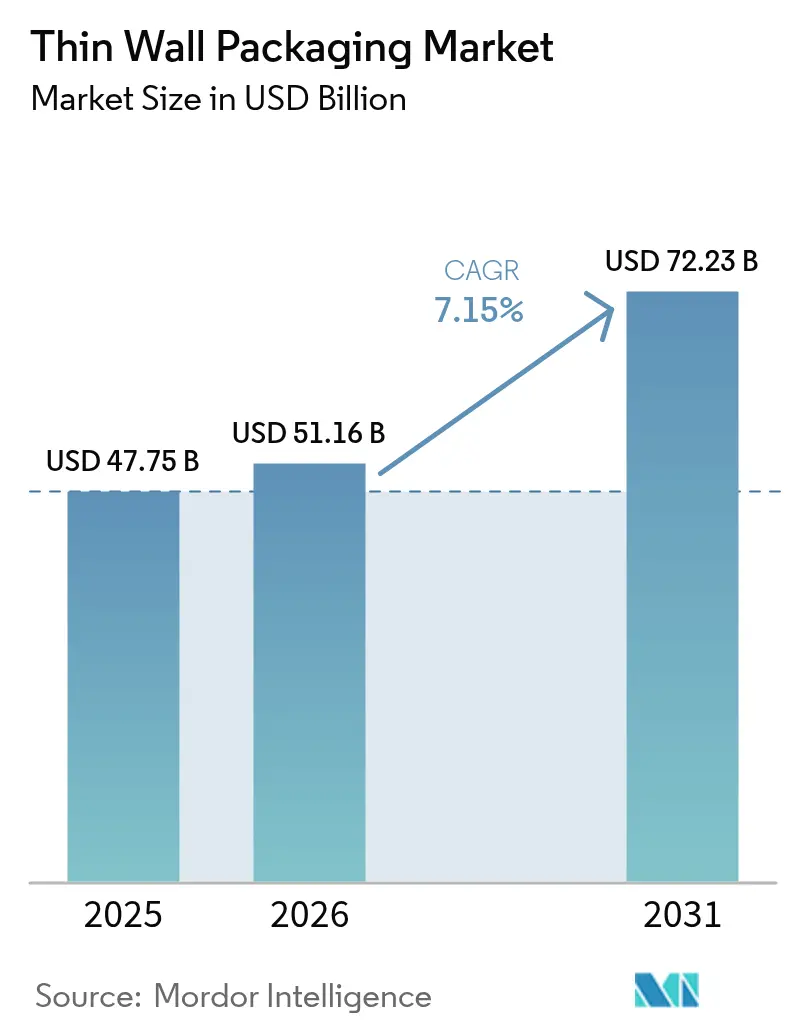
| Market Size (2026) | USD 51.16 Billion |
| Market Size (2031) | USD 72.23 Billion |
| Growth Rate (2026 - 2031) | 7.15% CAGR |
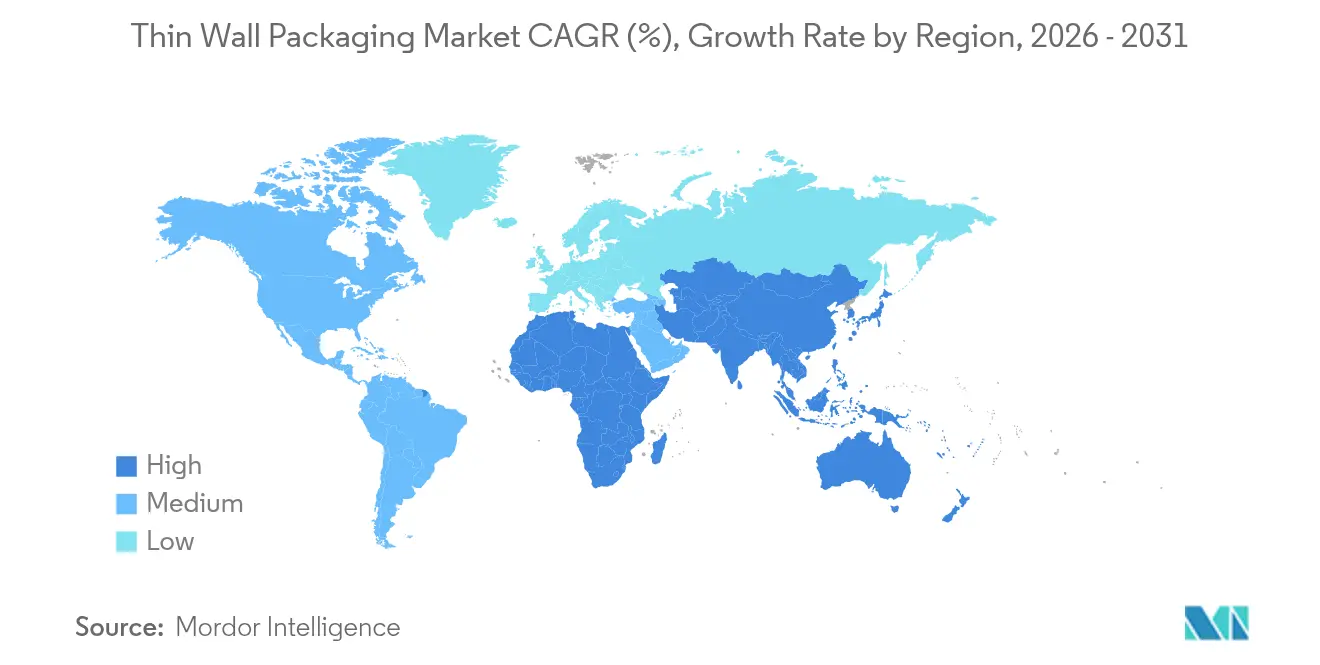
| Fastest Growing Market | Asia Pacific |
| Largest Market | North America |
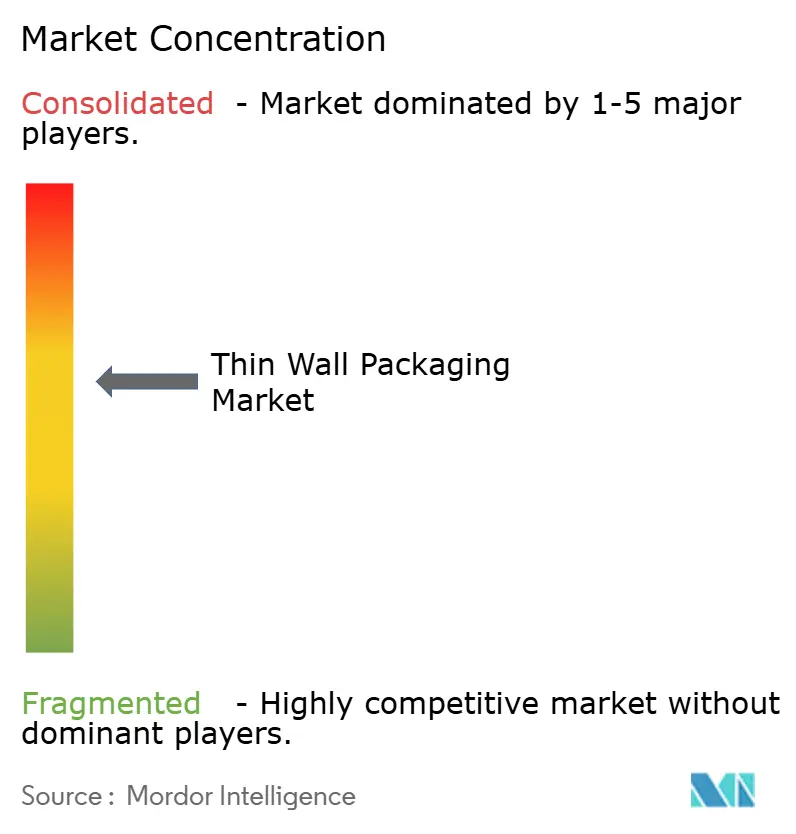
| Market Concentration | Medium |
Major Players *Disclaimer: Major Players sorted in no particular order Image © Mordor Intelligence. Reuse requires attribution under CC BY 4.0. | |
Thin Wall Packaging Market Analysis by Mordor Intelligence
Thin wall packaging market size in 2026 is estimated at USD 51.16 billion, growing from 2025 value of USD 47.75 billion with 2031 projections showing USD 72.23 billion, growing at 7.15% CAGR over 2026-2031. Upward momentum is fuelled by logistics growth tied to online retail, material-efficient design targets that cut freight charges, and tightening legislative support for recyclable formats. Polypropylene remains the workhorse resin, yet biopolymer penetration is accelerating as brand owners race to meet extended producer responsibility rules. Manufacturing innovation in hot-runner injection molding and inline extrusion-thermoforming keeps throughput high while driving wall thickness below 1 mm. Regionally, North America retains volume leadership, but Asia-Pacific is expanding fastest on the back of urbanization, meal-delivery adoption and rising disposable incomes. These converging factors combine to position the thin wall packaging market as a central platform for brand differentiation, cost containment and carbon reduction over the next five years.
Key Report Takeaways
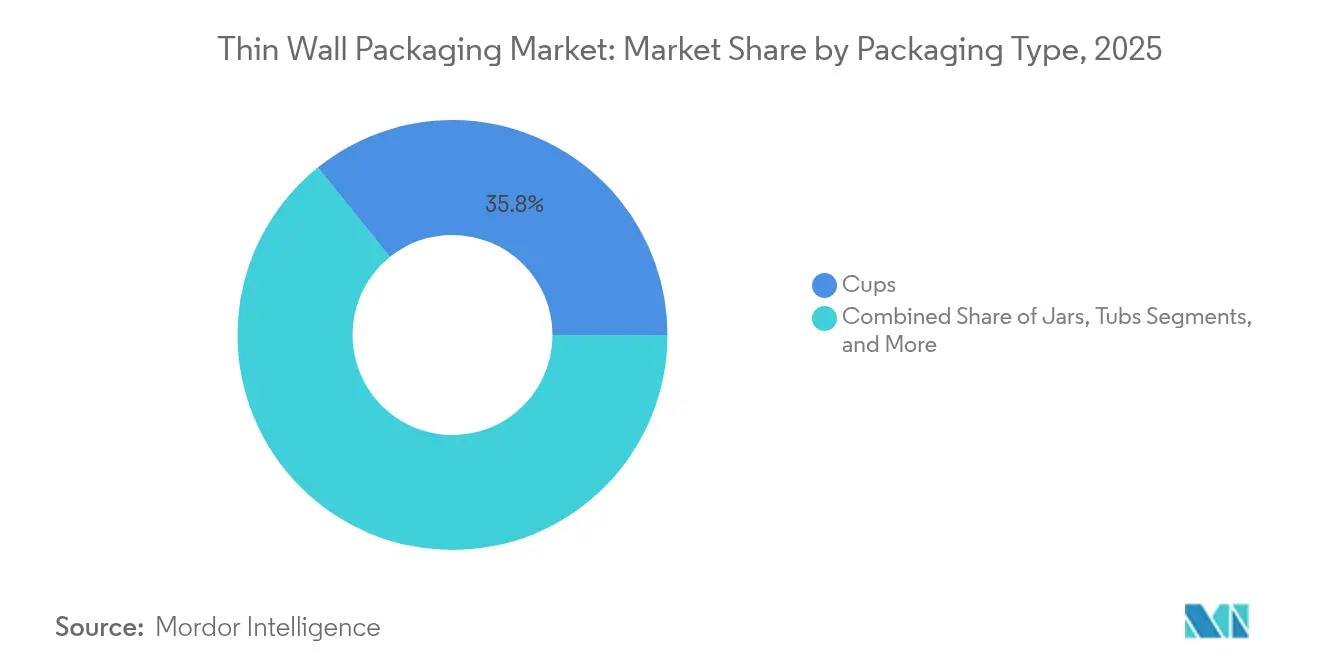
- By packaging type, cups represented 35.78% share of the thin wall packaging market size in 2025; bowls and lids are advancing at a 7.55% CAGR between 2026-2031.
- By material, polypropylene accounted for 42.65% of thin wall packaging market share in 2025, and biopolymers are expected to record an 8.05% CAGR through 2031.
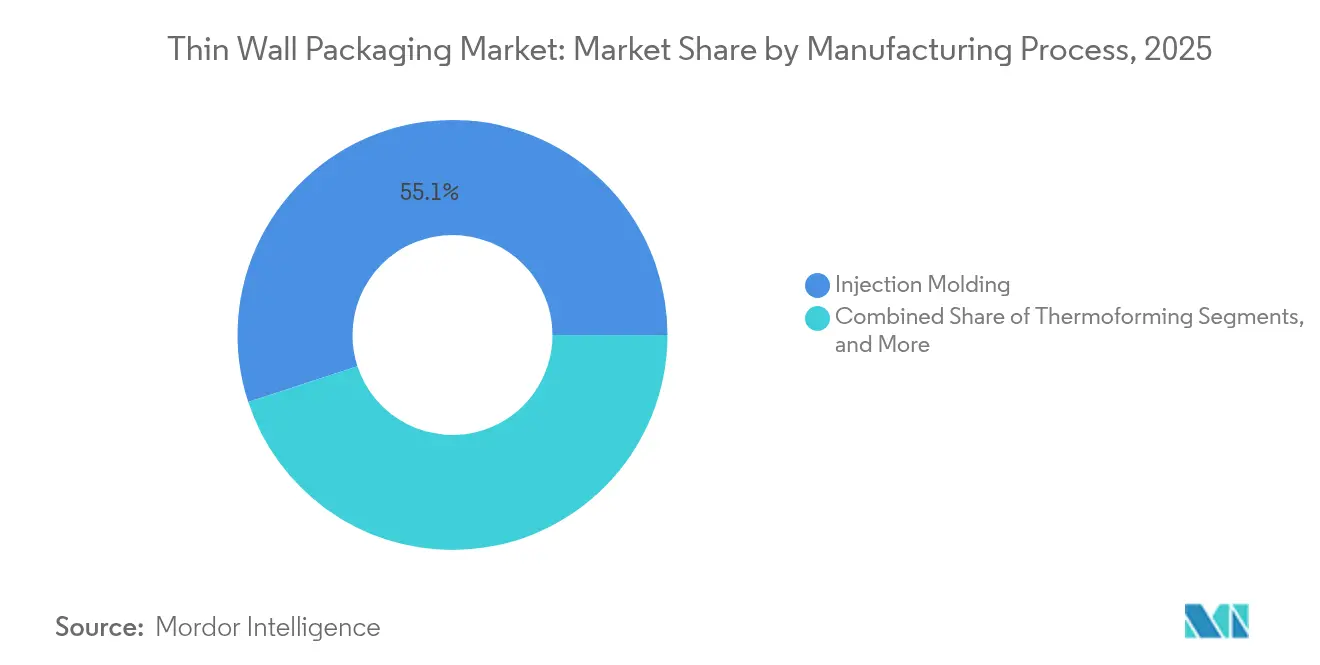
- By manufacturing process, injection molding led with 55.05% share of the thin wall packaging market size in 2025, whereas extrusion technologies are forecast to expand at an 8.4% CAGR to 2031.
- By end-user industry, food and beverage applications captured 35.12% of thin wall packaging market share in 2025, while cosmetics and personal care are set to grow at a 9.85% CAGR through 2031
- By geography, North America held 27.85% of thin wall packaging market share in 2025, while Asia-Pacific is projected to grow at a 9.1% CAGR through 2031.
Note: Market size and forecast figures in this report are generated using Mordor Intelligence’s proprietary estimation framework, updated with the latest available data and insights as of 2026.
Global Thin Wall Packaging Market Trends and Insights
Drivers Impact Analysis*
| Driver | (~) % Impact on CAGR Forecast | Geographic Relevance | Impact Timeline |
|---|---|---|---|
| Surge in e-commerce logistics | +1.2% | Global, with concentration in North America and Asia-Pacific | Medium term (2-4 years) |
| Demand for convenient ready-to-eat meals | +0.9% | Global, strongest in urban centers across all regions | Short term (≤ 2 years) |
| Lightweighting for cost-down and CO₂ reduction | +0.8% | Global, regulatory-driven in Europe and North America | Long term (≥ 4 years) |
| In-mold labelling (IML) boosts recyclability | +0.6% | Europe and North America, expanding to Asia-Pacific | Medium term (2-4 years) |
| Refill-friendly thin-wall packs in cosmetics | +0.5% | North America and Europe, premium segments globally | Medium term (2-4 years) |
| Cold-chain meal-kit boom | +0.4% | North America and Europe, emerging in Asia-Pacific urban areas | Short term (≤ 2 years) |
| Source: Mordor Intelligence | |||
Surge in E-commerce Logistics
Rapid online retail expansion pushes the thin wall packaging market toward designs that withstand automated sortation while minimizing dimensional weight fees. Brands such as Levain Bakery cut process steps from eight to four and achieved a 50% packaging-efficiency gain by adopting sub-millimeter containers that flow smoothly through fulfillment centers.[1]RRD Solutions, “Levain Bakery Streamlines E-Commerce Fulfillment,” rrd.comReadyWise uses on-demand right-sized packs to move 1 million pouches weekly, trimming freight costs and floor space simultaneously. Automation compatibility and space optimization make thin wall formats infrastructure-critical for e-commerce scalability rather than a simple cost lever.
Demand for Convenient Ready-to-Eat Meals
Urban consumers gravitate to microwave-ready, portion-controlled fare that requires packaging capable of safe heating without material distortion. Curefit now dispatches 35,000 ready meals daily in containers engineered for freshness retention and rapid reheat cycles, illustrating how food-service recovery steers incremental resin demand toward high-barrier thin wall designs. Transparent lids encourage impulse purchase while thermoformed bases exploit precise wall calibration to conserve resin and uphold structural integrity.
Lightweighting for Cost-Down and CO₂ Reduction
Enterprises marry material savings with carbon targets by pushing wall thickness below 1 mm. Mid-America Machining’s Cornerstone technology demonstrates commercial viability for lighter bottles that still satisfy drop-test norms and regional container-deposit statutes. Berry Global reported a 43% jump in post-consumer resin usage and a 28.3% emissions decline, linking weight reduction directly to ESG performance.[2]Plastics Today editors, “Berry Global 2024 Sustainability Report,” plasticstoday.com Regulatory frameworks, including carbon pricing and mandatory recycled-content thresholds, reinforce lightweighting as an enduring profit lever.
In-mold Labelling (IML) Boosts Recyclability
IML integrates graphics during molding, eliminating glues that historically contaminated reclaim streams. Global IML demand is on course to reach USD 4.06 billion in 2025 as brand owners seek mono-material packs that clear deposit return systems without delamination steps. The one-pass process compresses cycle times, lowers labor inputs and permits vivid artwork without secondary decoration. In Europe, plastic taxes tied to recycled content credits accelerate IML transition, making it a central pillar in closed-loop packaging roadmaps.
Restraints Impact Analysis*
| Restraint | (~) % Impact on CAGR Forecast | Geographic Relevance | Impact Timeline |
|---|---|---|---|
| Plastic-tax and EPR legislation | -0.8% | Europe and North America, expanding globally | Short term (≤ 2 years) |
| Resin price volatility | -0.6% | Global, acute in import-dependent regions | Short term (≤ 2 years) |
| Shift to mono-material flexible films | -0.4% | Global, led by Europe and North America | Medium term (2-4 years) |
| High-cavitation tooling cap-ex | -0.3% | Global, particularly affecting smaller manufacturers | Long term (≥ 4 years) |
| Source: Mordor Intelligence | |||
Plastic-tax and EPR Legislation
The United Kingdom now levies GBP 200 per tonne on packaging below 30% recycled content, extracting an anticipated GBP 700 million annually without earmarking funds for recycling infrastructure. Spain launched a per-kilogram tax on virgin plastic in 2023, while Germany’s implementation delay until 2025 clouds investment forecasts. [3]RIGK GmbH, “EPR Legislation Timelines in Europe,” rigk.de These policies inflate compliance costs and encourage accelerated transitions toward certified recyclate streams and closed-loop partnerships.
Resin Price Volatility
Polypropylene values slipped 2 cents per pound in late 2024, contrasting a 3-cent rise for polyethylene, squeezing margins on long-term supply contracts. Berry Global’s 2024 Q2 net sales fell 6%, a decline partly linked to resin price fluctuations that depress pass-through revenue. Converters respond by adopting dynamic index pricing, multiresin design flexibility and regionalized sourcing to cushion volatility shocks.
*Our forecasts treat driver/restraint impacts as directional, not additive. The impact forecasts reflect baseline growth, mix effects, and variable interactions.
Segment Analysis
By Packaging Type: Cups Sustain Leadership, Bowls Accelerate
Cups generated a 35.78% share of the thin wall packaging market in 2025, underpinned by food-service reopenings and robust on-the-go beverage rituals. The segment benefits from low material-to-volume ratios, automated filling compatibility and brand-friendly print surfaces. Growth persists through 2031 as coffee chains and quick-service restaurants widen sustainable cup trials capable of withstanding 100 °C fill temperatures without deformation.
The bowls and lids category is projected to post a 7.55% CAGR to 2031, catalyzed by global meal-kit subscriptions and refrigerated fresh-cut produce. Operators prioritize transparent lids that showcase product freshness and support gas-flush shelf-life extensions. Advances in inline thermoforming enable bowls with 400-micron average wall sections that match drop-test standards formerly associated only with heavier rivals. Trays, tubs and jars remain vital for dairy, confectionery and personal-care niches, each leveraging geometry and barrier customization to maintain shelf differentiation.


By Material: Polypropylene Dominates as Biopolymers Scale
Polypropylene captured 42.65% of thin wall packaging market share in 2025 due to its versatile processing window, moisture resistance and favorable price-performance ratio. Yet, the thin wall packaging market is witnessing brisk uptake of PLA and PHA resins, which are expanding at an 8.05% CAGR as converters scramble to meet compostability and recycled-content mandates.
The Fraunhofer Institute unveiled an 80% bio-based flexible PLA film that runs on conventional LDPE lines, signaling cost-effective integration potential for high-clarity applications. Meanwhile, PHA pioneer Green Team validated home-compostable pots that decompose within six months without microplastic traces. PET sustains niche relevance in oxygen-sensitive prepared salads, while polystyrene and PVC continue to lose share amid tightening regulatory scrutiny.
By Manufacturing Process: Injection Molding Efficiency vs. Extrusion Momentum
Injection molding held 55.05% of the thin wall packaging market size in 2025, favoured for repeatable 0.4-second cavity-fill times and the ability to pack 128 cavities per tool without dimensional drift. Oerlikon HRSflow’s Multiflow system processes shot weights as low as 0.5 g, broadening moldable design freedom across PCR and biopolymer blends.
Extrusion-thermoforming methods are set to grow 8.4% annually, propelled by energy-efficient inline systems that eliminate reheat steps and slash scrap rates. Brown Machine’s Quad Series offers advanced deflection control for deep-draw bowls, reducing average wall thickness by 10% while sustaining top-load strength. Selection criteria increasingly hinge on flexibility to swap resins and cycle between orders within minutes capabilities that bolster small-batch economics and speed to market.
By End-User Industry: Food and Beverage Core, Cosmetics Outpace
Food and beverage brands accounted for 35.12% of thin wall packaging market share in 2025, relying on high-barrier tubs and lidded trays that guard against oxygen ingress and support microwave reheating. Portion-control ice-cream and yogurt packs remain a staple, while prepared-meal suppliers pivot to multi-compartment designs that keep ingredients separated until consumption.
Cosmetics and personal care products are forecast to clock a 9.85% CAGR as refill-ready jars and premium matte finishes gain shelf visibility. Wellnesse validated cost-neutral recycled-content containers that maintain strict material purity standards a signal that aesthetics and sustainability can align without margin sacrifice. Pharmaceutical and nutraceutical players add incremental volume through high-precision inhaler components and unit-dose cups produced in clean-room-validated facilities.
Geography Analysis
North America retained 27.85% of the thin wall packaging market in 2025 on the back of entrenched meal-service businesses, sophisticated recycling channels and early adoption of light-weighting toolkits. Brand owners continue to absorb premium resin pricing in return for compliance-ready packs that navigate federal and state plastics legislation. The United States remains the innovation locus for advanced hot-runner systems, while Canada channels public-sector procurement policies toward PCR adoption in institutional food programmes.
Asia-Pacific is projected to achieve a 9.1% CAGR to 2031, underpinned by rapid urbanization, growing middle-class purchasing power and a sharp shift toward omni-channel grocery. China leads volume, but India and Indonesia post the fastest per-capita expansion. The Food Safety and Standards Authority of India’s clearance for recycled plastic in food contact applications further lowers entry barriers for PCR-rich thin wall designs. Regional converters invest heavily in multilayer extrusion-thermoforming lines configurable for both polypropylene and emerging bio-resins, boosting supply resilience.
Europe commands significant share by virtue of early sustainability mandates and a continental focus on circularity. Plastic taxes and EPR regimes intensify cost pressures yet simultaneously reward companies capable of delivering 30% or greater recycled content without sacrificing seal integrity. Germany, France and the Nordics are hotbeds for IML adoption as retailers push mono-material packaging in private-label assortments. Eastern European nations, aided by lower labour costs, emerge as contract-manufacturing hubs that feed Western demand while navigating identical regulatory thresholds.
The Middle East and Africa cluster offers nascent but promising prospects, particularly in frozen-dairy exports and regional QSR chains that seek high-heat-resistant PP cups. South American growth is tethered to agricultural value-addition and an expanding middle class attracted to convenience formats. Local resin production in Brazil provides cost advantage; however, unreliable recycling infrastructure limits circular material sourcing, slowing penetration of PCR-rich thin wall offerings.

Competitive Landscape
The thin wall packaging market is moderately fragmented, with regional champions and global multinationals leveraging a mix of material science, process know-how and supply-chain integration to vie for share. The February 2025 shareholder approval of the Amcor–Berry Global merger promises USD 650 million in annual cost synergies and a combined R&D budget of USD 180 million, creating a scale player that spans healthcare blisters to food-service cups. Consolidation helps smooth resin procurement volatility and offers cross-portfolio sustainability expertise to blue-chip FMCG clients.
Huhtamaki expands molded-fiber capacity in Northern Ireland to meet brand demand for compostable coffee-cup lids, signaling incumbents’ readiness to cannibalize legacy plastic volume for long-term environmental credibility. Dart Container’s alliance with PulPac introduces Dry-Molded Fiber technology to North America, slashing water and energy inputs by up to 80% and positioning the firm as a decarbonization pioneer.
Smaller specialists such as Green Team and Intertech Plastics seize white-space opportunities in high-performance biopolymers and precision in-mold labelling, respectively. Their agility in piloting new resins and tooling concepts enables premium margin capture in cosmetics and nutraceutical micro-batches where large incumbents may lack the nimbleness to customize rapidly. Overall, strategy pivots on balancing global material contracts with the nimble, region-specific customization necessary for compliance and consumer acceptance.
Thin Wall Packaging Industry Leaders
Berry Global Inc.
Greiner Packaging International
Faerch Group
Silgan Holdings Inc.
Huhtamaki Oyj
- *Disclaimer: Major Players sorted in no particular order

Recent Industry Developments
- February 2025: Amcor and Berry Global shareholders approved a merger targeting USD 650 million annual synergies and USD 180 million in incremental R&D investment.
- January 2025: Kimberly-Clark committed USD 2 billion to upgrade North American manufacturing, adding a Warren, Ohio greenfield site and expanding Beech Island, South Carolina.
- January 2025: Gerresheimer invested USD 180 million to enlarge its Peachtree City, Georgia plant for inhalers and autoinjectors, adding 400 jobs.
- January 2025: Amcor secured a European patent for its AmFiber Performance Paper, a high-barrier recyclable solution for food and healthcare.
- November 2024: Berry Global closed its merger with Glatfelter, forming a USD 12.3 billion revenue sustainability-focused platform.


Global Thin Wall Packaging Market Report Scope
Thin wall packaging is responsible for the protection of the products that are contained in it from contamination or damages, thereby playing an important role for any product-based firm.The Thin wall Packaging Market is segmented by Type (Tubs, Cups, Pots, Jars, Trays), By Packaging Materials (Polystyrene (PS), Polyvinyl Chloride (PVC), Polyethylene Terephthalate (PET), Polypropylene (PP), Polyethylene (PE)) End-user Industry (Food & Beverages, Cosmetics, Pharmaceutical, Other End-user Industries), and Geography.
| Tubs |
| Jars |
| Pots |
| Cups |
| Trays |
| Bowls and Lids |
| Polypropylene (PP) |
| Polyethylene Terephthalate (PET) |
| Polystyrene (PS) |
| Polyethylene (PE) |
| Polyvinyl Chloride (PVC) |
| Biopolymers (PLA, PHA) |
| Injection Molding |
| Thermoforming |
| Extrusion and Others |
| Food and Beverage | Dairy Products |
| Ready Meals | |
| Fruits and Vegetables | |
| Meat, Poultry and Seafood | |
| Confectionery and Snacks | |
| Cosmetics and Personal Care | |
| Pharmaceuticals and Nutraceuticals | |
| Industrial and Household Goods |
| North America | United States |
| Canada | |
| Mexico | |
| South America | Brazil |
| Argentina | |
| Rest of South America | |
| Europe | Germany |
| United Kingdom | |
| France | |
| Italy | |
| Spain | |
| Russia | |
| Rest of Europe | |
| Asia-Pacific | China |
| Japan | |
| India | |
| Australia | |
| South Korea | |
| Rest of Asia-Pacific | |
| Middle East | Saudi Arabia |
| United Arab Emirates | |
| Turkey | |
| Rest of Middle East | |
| Africa | South Africa |
| Egypt | |
| Nigeria | |
| Rest of Africa |
| By Packaging Type | Tubs | |
| Jars | ||
| Pots | ||
| Cups | ||
| Trays | ||
| Bowls and Lids | ||
| By Material | Polypropylene (PP) | |
| Polyethylene Terephthalate (PET) | ||
| Polystyrene (PS) | ||
| Polyethylene (PE) | ||
| Polyvinyl Chloride (PVC) | ||
| Biopolymers (PLA, PHA) | ||
| By Manufacturing Process | Injection Molding | |
| Thermoforming | ||
| Extrusion and Others | ||
| By End-User Industry | Food and Beverage | Dairy Products |
| Ready Meals | ||
| Fruits and Vegetables | ||
| Meat, Poultry and Seafood | ||
| Confectionery and Snacks | ||
| Cosmetics and Personal Care | ||
| Pharmaceuticals and Nutraceuticals | ||
| Industrial and Household Goods | ||
| By Geography | North America | United States |
| Canada | ||
| Mexico | ||
| South America | Brazil | |
| Argentina | ||
| Rest of South America | ||
| Europe | Germany | |
| United Kingdom | ||
| France | ||
| Italy | ||
| Spain | ||
| Russia | ||
| Rest of Europe | ||
| Asia-Pacific | China | |
| Japan | ||
| India | ||
| Australia | ||
| South Korea | ||
| Rest of Asia-Pacific | ||
| Middle East | Saudi Arabia | |
| United Arab Emirates | ||
| Turkey | ||
| Rest of Middle East | ||
| Africa | South Africa | |
| Egypt | ||
| Nigeria | ||
| Rest of Africa | ||


Key Questions Answered in the Report
What is the current size of the thin wall packaging market?
The thin wall packaging market stands at USD 51.16 billion in 2026 and is projected to reach USD 72.23 billion by 2031 at a 7.15% CAGR.
Which packaging type leads the thin wall segment?
Cups hold the top position, accounting for 35.78% of 2025 revenue as food-service demand rebounds.
Why are biopolymers gaining traction in thin wall applications?
PLA and PHA gain an 8.05% CAGR because they meet compostability targets and help brands comply with plastic taxes and EPR rules without sacrificing functional performance.
Which region is the fastest-growing market for thin wall packaging?
Asia-Pacific is projected to expand at a 9.1% CAGR through 2031, driven by urbanization, rising disposable incomes and rapid meal-delivery adoption.
How are e-commerce trends influencing thin wall packaging design?
Automated fulfillment centers require lightweight, durable packs under 1 mm wall thickness that lower dimensional-weight fees and withstand mechanical handling, making thin wall solutions integral to online retail logistics.
Page last updated on:


