Thermoplastic Composites Market Size and Share
Market Overview
| Study Period | 2021 - 2031 |
|---|---|
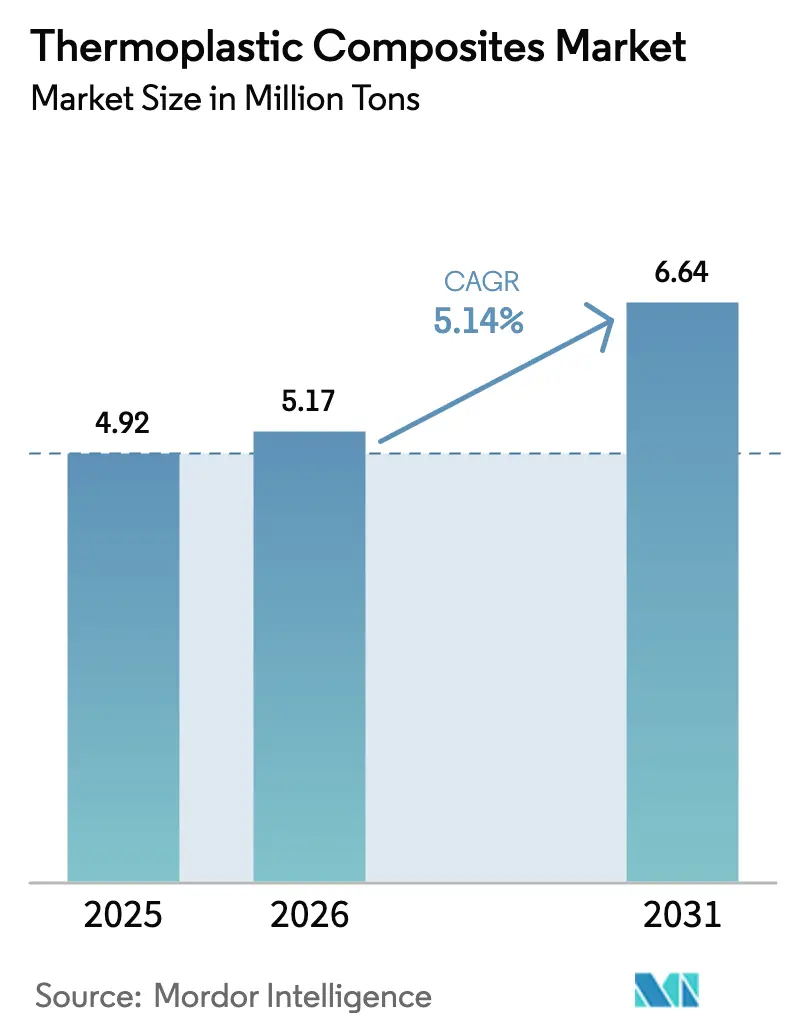
| Market Volume (2026) | 5.17 Million tons |
| Market Volume (2031) | 6.64 Million tons |
| Growth Rate (2026 - 2031) | 5.14% CAGR |
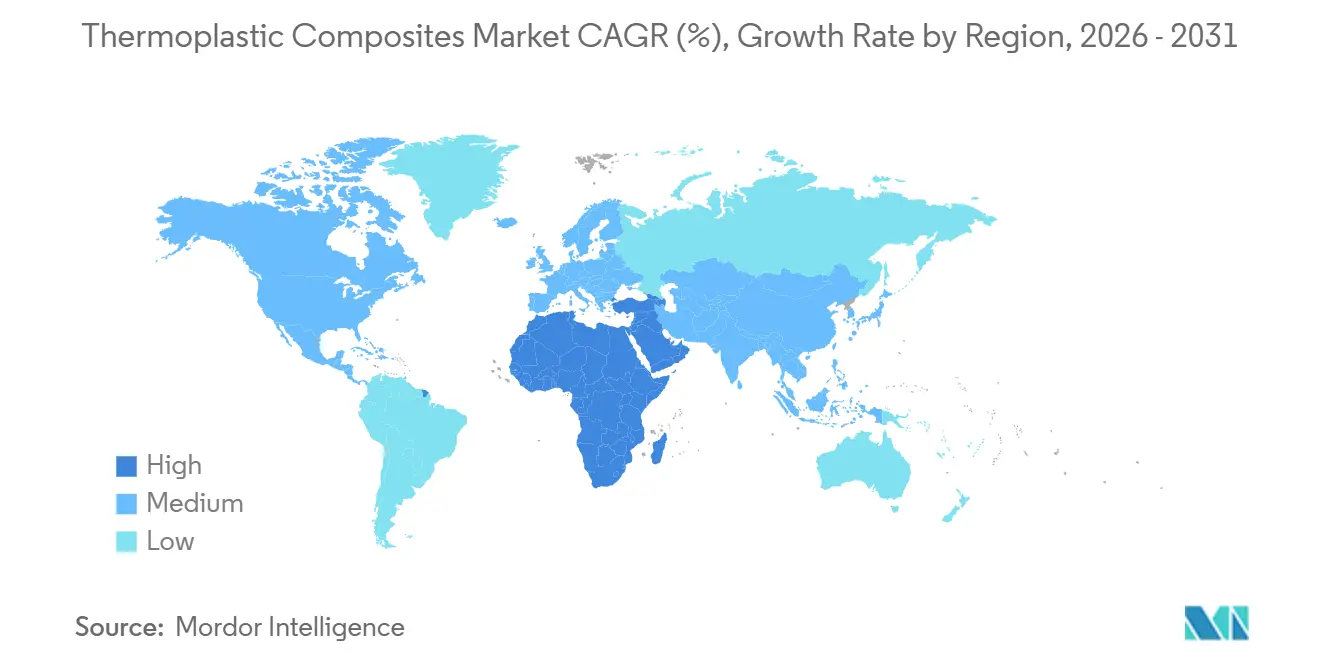
| Fastest Growing Market | Middle East and Africa |
| Largest Market | Asia Pacific |
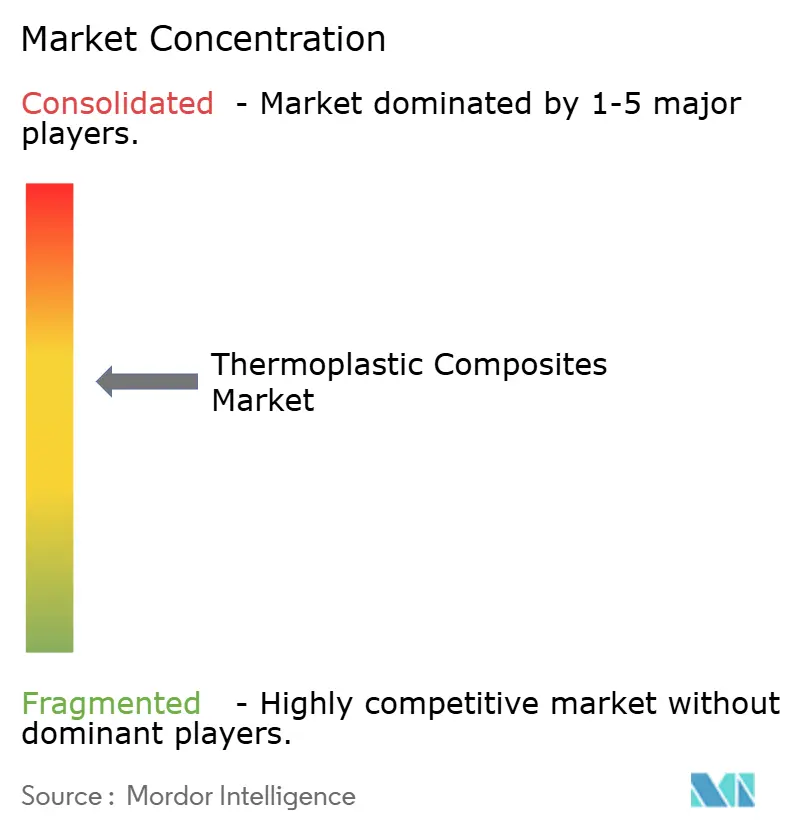
| Market Concentration | Medium |
Major Players *Disclaimer: Major Players sorted in no particular order Image © Mordor Intelligence. Reuse requires attribution under CC BY 4.0. | |
Thermoplastic Composites Market Analysis by Mordor Intelligence
The Thermoplastic Composites Market size is expected to increase from 4.92 Million tons in 2025 to 5.17 Million tons in 2026 and reach 6.64 Million tons by 2031, growing at a CAGR of 5.14% over 2026-2031. This growth reflects sustained demand from automotive lightweighting mandates, aerospace production ramp-ups, and energy-infrastructure upgrades that increasingly favor mechanically robust yet recyclable materials. Polyamide, glass-fiber, and short-fiber products continue to dominate high-volume programs because they align with established injection-molding and compression-molding lines. Continuous-fiber formats are gaining share as automated tape-laying cells cut cycle times to below 60 seconds, making structural parts such as battery trays cost-competitive with stamped aluminum. Pressure-vessel makers are also shifting to thermoplastic wraps because Type IV cylinders resist hydrogen embrittlement and trim 40% of curb weight versus steel.
Key Report Takeaways
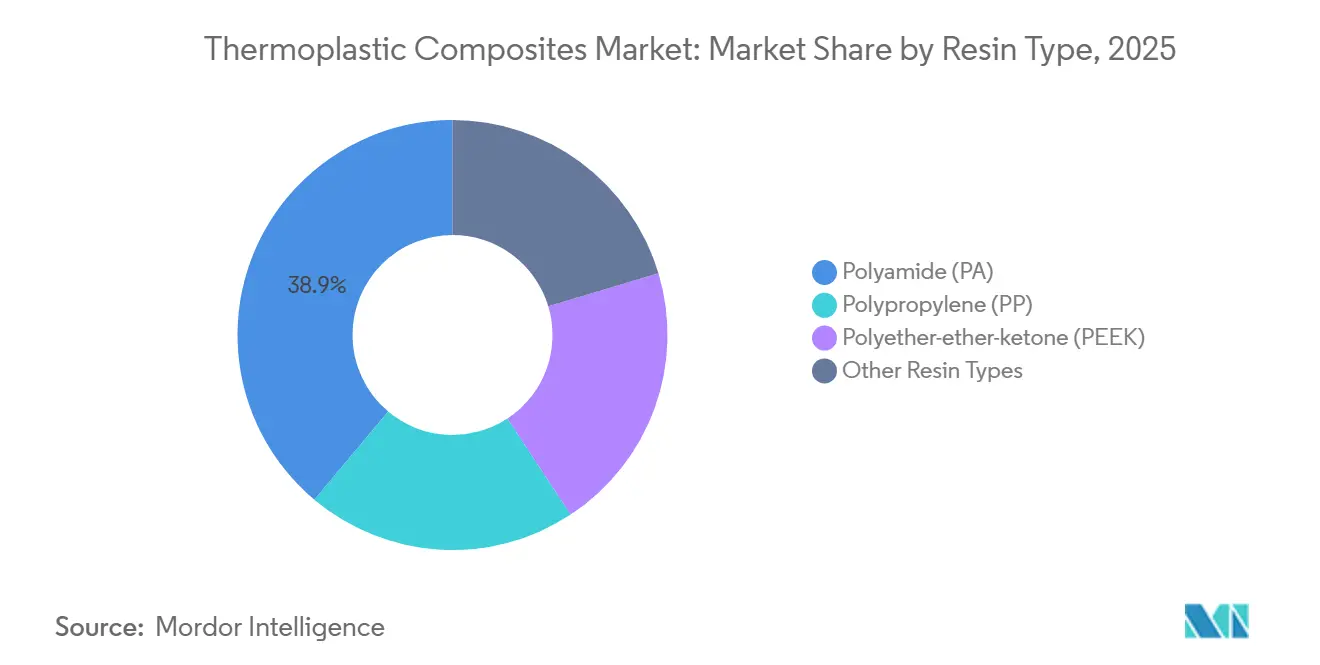
- By resin type, polyamide captured 38.89% of volume in 2025, while polyether-ether-ketone (PEEK) recorded the fastest forecast CAGR at 6.08% through 2031.
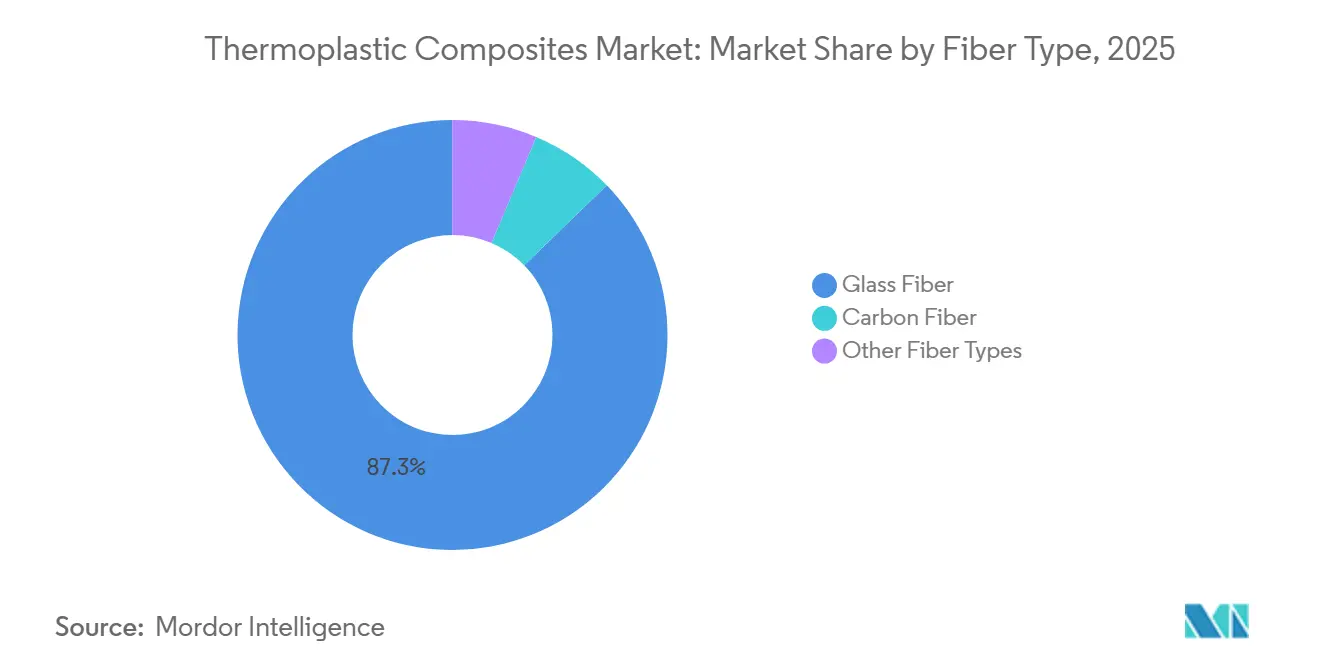
- By fiber type, glass accounted for 87.27% of the 2025 volume; carbon fiber is projected to grow at a 5.81% CAGR through 2031.
- By product type, short-fiber held 39.54% of volume in 2025, whereas long-fiber is set to rise at a 5.36% CAGR to 2031.
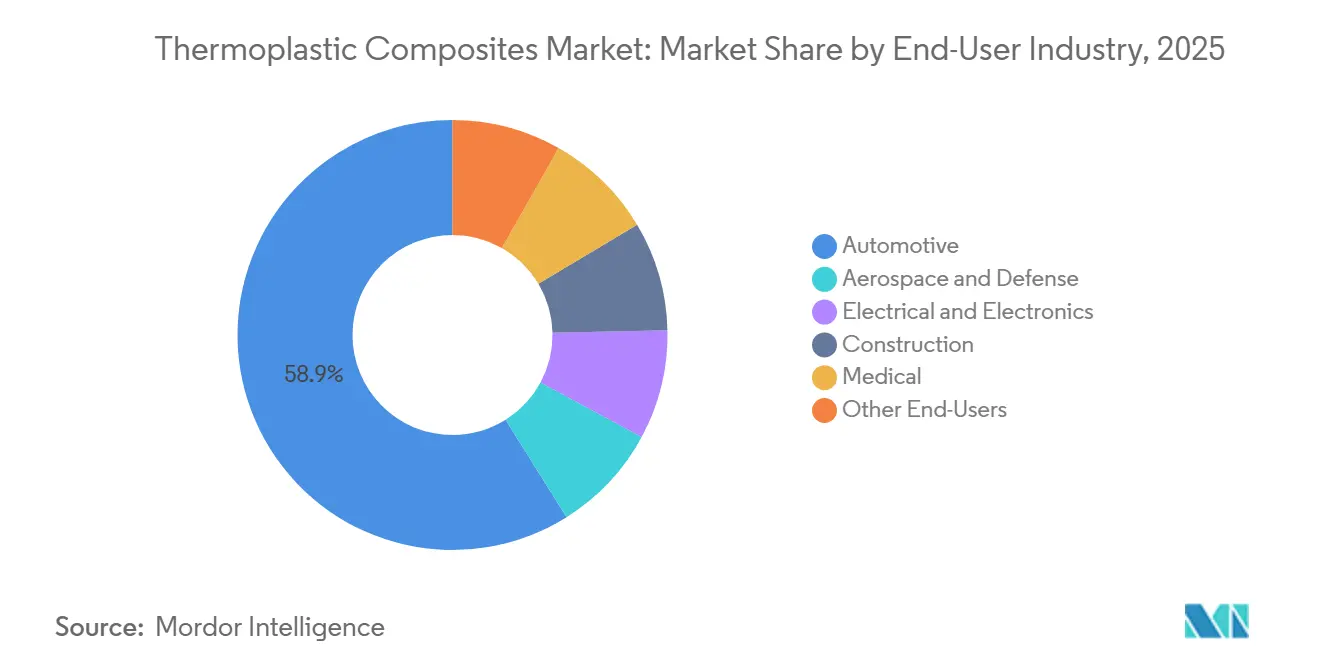
- By end-user industry, automotive dominated with 58.91% of 2025 demand; aerospace and defense are expected to expand at a 6.18% CAGR over the same horizon.
- By geography, Asia-Pacific led with 48.76% of global volume in 2025; the Middle East and Africa are forecast to grow the fastest, at 5.72% annually through 2031.
Note: Market size and forecast figures in this report are generated using Mordor Intelligence’s proprietary estimation framework, updated with the latest available data and insights as of January 2026.
Global Thermoplastic Composites Market Trends and Insights
Driver Impact Analysis*
| Drivers | (~) % Impact on CAGR Forecast | Geographic Relevance | Impact Timeline |
|---|---|---|---|
| Rapid Vehicle Lightweighting Mandates in Europe and the United States | +1.2% | Europe, North America | Medium term (2-4 years) |
| OEM Push for Recyclable Composite Solutions in E-Mobility | +1.0% | Global, with concentration in Europe, China | Medium term (2-4 years) |
| Asia-Pacific LNG and Hydrogen Storage Megaproject Pipeline | +0.8% | Asia-Pacific core, spillover to Middle East | Long term (≥4 years) |
| Thermoplastic Over-Molding Adoption in Smart Electronics Housings | +0.6% | Asia-Pacific (China, South Korea, ASEAN), North America | Short term (≤2 years) |
| Military Demand for Damage-Tolerant, Radar-Transparent Structures | +0.5% | North America, Europe, Middle East | Long term (≥4 years) |
| Source: Mordor Intelligence | |||
Rapid Vehicle Lightweighting Mandates in Europe and the United States
Euro 7 rules effective mid-2025 and the U.S. EPA’s 2027-2032 greenhouse-gas standards oblige automakers to remove 8%–12% of curb weight to stay inside fleet-average limits. Thermoplastic composites deliver 30%–40% savings versus steel yet cycle in under 60 seconds, enabling line-side integration. BMW’s iX roof panel shows structural feasibility while trimming 15 kg per vehicle[1]BMW Group, “Annual Report 2025,” bmwgroup.com. Penalties above EUR 95 per excess gram of CO₂ make adoption financially unavoidable.
OEM Push for Recyclable Composite Solutions in E-Mobility
EU Battery Regulation thresholds on recycled content and digital passports promote closed-loop enclosures built from remeltable matrices. Mercedes-Benz recovers short-fiber polyamide housings for reuse, achieving 22% recycled content with no impact-strength loss. China’s draft design-for-disassembly rules amplify the shift, and the American Chemistry Council targets 30% composite scrap circularity by 2030[2]American Chemistry Council, “Durable Plastics Circularity Roadmap,” americanchemistry.com .
Asia-Pacific LNG and Hydrogen Storage Megaproject Pipeline
Japan’s 12 Mt hydrogen target and South Korea’s 5.26 Mt goal spur demand for Type IV cylinders that weigh 40% less than steel and avoid embrittlement. Strohm’s 10-km composite pipe for a Chinese offshore project validated 100-bar service at −40 °C. NEOM and NEDO adoption further extend the regional scale.
Thermoplastic Over-Molding Adoption in Smart-Electronics Housings
Electronics brands bond rigid frames and soft-touch grips in a single cycle, cutting adhesive steps. Apple’s 2024 iPhone 15 Pro chassis marries titanium with short-fiber polyamide inserts, keeping weight under 200 g. Samsung’s 2025 Galaxy S25 mid-frames raise battery capacity 12% without aluminum. MIIT data show thermoplastic housings doubled to 18% of smartphone mass by 2025.
Restraint Impact Analysis*
| Restraints | (~) % Impact on CAGR Forecast | Geographic Relevance | Impact Timeline |
|---|---|---|---|
| High Cost of Raw Materials and Forming Processes | −0.9% | Global | Short term (≤2 years) |
| Limited Awareness and Standardization | −0.5% | Asia-Pacific, South America, Middle East and Africa | Medium term (2-4 years) |
| Competitive Pressure from Thermoset Composites | −0.9% | Global | Long term (≥4 years) |
| Source: Mordor Intelligence | |||
High Cost of Raw Materials and Forming Processes
Polyamide resins fluctuated between USD 2,800 and USD 3,400/ton in 2024-2025 as caprolactam supply tightened, and PEEK still commands USD 60–80/kg, curbing penetration outside aviation and implants. Carbon fiber at USD 15–25/kg remains a premium over glass. Automated tape-laying cells exceed USD 5 million, limiting SME entry, whereas epoxy systems price in at USD 4–6/kg and keep share in low-volume aerospace runs.
Limited Awareness and Standardization
ISO 527 and ASTM D3039 were drafted for thermosets, so weld-line strength and strain-rate effects in thermoplastic composites are under-documented. EASA guidance on primary-structure certification will not finalize before 2027, delaying aircraft adoption. New ISO working groups aim to harmonize test methods by 2028, but until then regional standards add 12–18 months to qualification cycles.
*Our forecasts treat driver/restraint impacts as directional, not additive. The impact forecasts reflect baseline growth, mix effects, and variable interactions.
Segment Analysis
By Resin Type: Polyamide Dominance Meets PEEK’s Niche Expansion
The thermoplastic composites market size for polyamide reached 38.89% of total volume in 2025, owing to high-speed injection lines that meet automotive cycle-time targets. Moisture absorption cuts stiffness 15%–20% but boosts impact toughness, sustaining bumper-beam appeal. PEEK, although just a fraction of tonnage, is on a 6.08% CAGR path as aircraft brackets need 180 °C service and spine cages demand radiolucency. Polypropylene retains non-structural covers where cost and recycled-content mandates align, while PPS and PEI satisfy under-hood flame-retardant niches.
Heightened electrification keeps demand for chemical-resistant matrices; battery-tray suppliers are trialing recycled-content polyamide to meet 25% ELV thresholds. Meanwhile, the U.S. FDA’s 510(k) clearance of PEEK spinal cages spurs hospital demand even as surgeons weigh titanium familiarity. Over the forecast horizon, polyimide blends and low-smoke zero-halogen PAEK grades could carve out cabin-interior volume once fire-smoke-toxicity testing matures.


By Fiber Type: Glass-Fiber Economics Versus Carbon’s Performance Premium
Glass fiber supplied 87.27% of 2025 volume, offering 72 GPa modulus for USD 1.50–2.00/kg - adequate for battery trays and seat backs. Carbon fiber’s 5.81% CAGR outlook is underpinned by programs like Mercedes-Benz EQS roof bows that trim 8 kg and lower center of gravity 12 mm. Basalt and aramid remain below 3% combined because supply chains lack scale.
Crash-standards tightening will gradually expand carbon into B-pillar reinforcements once cost drops below USD 12/kg, expected as two new 25 kt lines in China come online in 2027. Natural-fiber hybrids are testing well for door-trim acoustics in EU vans, though moisture uptake challenges persist.
Product Type: Long-Fiber Gains Ground in Structural Applications
Short-fiber formats kept a 39.54% share in 2025; cycle times under 30 seconds fit high-cavitation tools for intake manifolds. Yet long-fiber’s 5.36% CAGR reflects seat-frame and front-end-carrier conversions that require 150–200 MPa tensile strength. Continuous-fiber tapes already exceed 800 MPa and are entering A350 fuselage frames under Toray’s 2025 supply deal.
Glass-mat thermoplastic (GMT) shields battery packs from road debris, providing quasi-isotropic impact resistance in 90-second cycles. As automotive part-consolidation targets intensify, compression-molded LFT and GMT offerings will capture metal stampings, trimming tool sets by up to 50%.
By End-User Industry: Automotive Lightweighting Versus Aerospace Certification Momentum
Automotive accounted for 58.91% of 2025 tonnage; the Tesla Model Y battery tray alone removed 18 kg and cut assembly time by 35%. Aerospace and defense, however, hold the fastest-growing slot at a 6.18% CAGR as Airbus validates PAEK frames that slash cure time 40% and weight 15% versus aluminum.
Electronics suppliers demand radar-transparent housings; Samsung’s Galaxy Watch 6 case achieved MIL-STD-810H shock-proofing while weighing 30% less than stainless steel. Construction pilots, including composite rebar in marine bridges, show a 50-year life without cathodic protection. Medical adoption pivots on surgeon familiarity, yet radiolucent implants reduce follow-up imaging time and costs.
Geography Analysis
Asia-Pacific held 48.76% share in 2025, powered by China’s 26.1 million vehicle output and electronics clusters along the Pearl River Delta. Beijing’s NEV plan, extended to 2030, requires recyclable lightweight components, fueling short- and long-fiber feedstock imports. Japan’s JPY 300 billion subsidy backs 1,000 hydrogen stations by 2030, pulling Type IV cylinder demand. South Korea’s multi-material mid-frame adoption reduced smartphone assembly steps 40%. India’s production-linked incentive cuts capital costs for composite cells, while Vietnam and Thailand expand over-molding capacity as supply chains diversify.
North America and Europe account for significant consumption volume. U.S. CAFE rules force Detroit to drop 100–150 kg per model using composite closures and seating. Boeing’s 777X floor beams showcase cost and cycle reductions, and Euro ELV mandates place 25% recycled-plastic thresholds by 2030. The U.K.’s GBP 18 million wing-skin project targets 50% labor cuts at ATI facilities.
The Middle East and Africa lead by growth rate at 5.72% through 2031. Saudi Aramco’s 200-km hydrogen pipeline at NEOM highlights 60% weight savings and embrittlement resistance. Masdar City specs thermoplastic façades that survive 50 °C swings. South Africa’s Nampak compounding line readies for export vehicles bound for Europe, while Nigeria assesses sour-gas composite pipe to meet local content rules. South America trails, though Brazilian agri-equipment gains from lightweight harvesters that consume less diesel.

Competitive Landscape
The thermoplastic composites market is moderately consolidated, with the leading players holding considerable production capacities and advancing the production of innovative products. BASF’s Ultramid Structure couples long-fiber pellets with simulation software, letting OEMs consolidate metal stampings and carve 25% off tooling cost. Long-term success hinges on backward-integrated resin supply, forward-integrated automated fabrication, and partnerships that guarantee closed-loop recycling streams. Suppliers that match material innovation with digital traceability will capture an outsized share as circular-economy mandates tighten.
Thermoplastic Composites Industry Leaders
TORAY INDUSTRIES, INC.
Solvay
Hexcel Corporation
SABIC
TEIJIN LIMITED
- *Disclaimer: Major Players sorted in no particular order

Recent Industry Developments
- November 2025: Toray and Airbus signed a five-year deal for continuous-fiber thermoplastic tapes for A350 frames and floor beams, targeting a 15% weight reduction.
- September 2025: BASF lifted Ultramid polyamide compounding capacity in Shanghai by 35,000 t/y, adding long-fiber lines for EV battery beams.
- January 2025: Mitsubishi Chemical and Toyota launched a program to integrate 30% post-consumer polyamide into battery trays by 2027, using blockchain traceability.


Research Methodology Framework and Report Scope
Market Definitions and Key Coverage
Our study defines the thermoplastic composites market as the global supply of fiber-reinforced materials whose matrix is a melt-processable resin, sold in pellet, sheet, prepreg, or molded form to downstream fabricators in transportation, aerospace, electrical, construction, medical, and other industries.
Scope exclusion: parts made with thermoset matrices or natural bitumen binders are kept outside this assessment.
Segmentation Overview
- By Resin Type
- Polypropylene (PP)
- Polyamide (PA)
- Polyether-ether-ketone (PEEK)
- Other Resin Types
- By Fiber Type
- Glass Fiber
- Carbon Fiber
- Other Fiber Types
- By Product Type
- Short-Fiber Thermoplastic (SFT)
- Long-Fiber Thermoplastic (LFT)
- Continuous-Fiber Thermoplastic (CFT)
- Glass-Mat Thermoplastic (GMT)
- By End-User Industry
- Automotive
- Aerospace and Defense
- Electrical and Electronics
- Construction
- Medical
- Other End-Users
- By Geography
- Asia-Pacific
- China
- Japan
- India
- South Korea
- ASEAN
- Rest of Asia-Pacific
- North America
- United States
- Canada
- Mexico
- Europe
- Germany
- United Kingdom
- France
- Italy
- Spain
- Rest of Europe
- South America
- Brazil
- Argentina
- Rest of South America
- Middle East and Africa
- Saudi Arabia
- United Arab Emirates
- South Africa
- Nigeria
- Rest of Middle East and Africa
- Asia-Pacific
Detailed Research Methodology and Data Validation
Primary Research
Mordor analysts conducted structured calls with resin suppliers, tier-one molders, automotive lightweighting engineers, and aerospace materials specifiers across North America, Europe, and Asia. These discussions validated real-world scrap rates, typical long-fiber price bands, and adoption curves for over-molding, which desk documents seldom quantify. Insights also guided the selection of scenario drivers in our forecast model.
Desk Research
We began with government trade statistics such as UN Comtrade and Eurostat for import-export flows of polypropylene, polyamide, and carbon fiber intermediates, which anchor regional supply. Trade association yearbooks from the American Composites Manufacturers Association and JEC publications helped us trace end-use penetration trends. Company 10-Ks and investor decks revealed mix shifts toward long-fiber formats, while peer-reviewed articles in Composites Science and Technology clarified density factors needed to translate weight into volume. Paid databases, notably D&B Hoovers for producer revenues and Dow Jones Factiva for deal news, filled corporate-level gaps. This list is illustrative; dozens of additional open and licensed sources fed our desk research.
Second-round desk work mapped fifteen focus countries by correlating vehicle production (OICA), aircraft deliveries (Aviation Week), and building permits (national statistics) with composite intensity ratios. The exercise produced preliminary demand pools that were later stress-tested through interviews.
Market-Sizing & Forecasting
A top-down reconstruction starts with production and trade data for key resins and fabrics, adjusted for captive use, to arrive at apparent consumption by region. Results are cross-checked through selective bottom-up roll-ups of sampled supplier shipments and average selling prices where available. Variables influencing the model include vehicle build counts, average composite kilograms per car, twin-aisle aircraft backlog burn, regional housing starts, and announced capacity additions in glass-fiber lines. Forecasts deploy multivariate regression combined with scenario analysis to reflect policy pushes for vehicle light-weighting and resin price volatility. Where bottom-up evidence diverges by more than five percent from the top-down result, gaps are prorated using consensus factors agreed during primary interviews.
Data Validation & Update Cycle
Before sign-off, our team re-runs variance checks against independent indicators such as quarterly resin output and export bills. Anomalies trigger a senior analyst review and, when material, a call-back to earlier respondents. We refresh every twelve months and issue interim updates when plant closures, tariff shifts, or major acquisitions could skew the baseline.
Why Mordor's Thermoplastic Composites Baseline Earns Trust
Published estimates differ because firms pick distinct measurement units, segment mixes, and refresh cadences.
By modeling in physical tons and tying every region to verified production inputs, we minimize currency swings and revenue accounting distortions.
Benchmark comparison
| Market Size | Anonymized source | Primary gap driver |
|---|---|---|
| 4.91 million tons (2025) | Mordor Intelligence | - |
| USD 31.6 billion (2024) | Global Consultancy A | Uses revenue; bundles thermoset grades and recycled streams, leading to higher headline value |
| USD 23.58 billion (2024) | Industry Research Firm B | Excludes continuous-fiber formats and omits Middle East, lowering total |
| USD 34.27 billion (2024) | Trade Journal C | Employs aggressive ASP escalation and combines thermoset converters, inflating value |
Estimates diverge largely on unit of measurement, scope breadth, and price trajectories.
Mordor's ton-based build-up, transparent country coverage, and annual refresh give decision-makers a reproducible, balanced baseline grounded in traceable variables.


Key Questions Answered in the Report
How big is the thermoplastic composites market in 2026?
The thermoplastic composites market is estimated to reach 5.17 million tons in 2026 and is forecast to grow at a 5.14% CAGR to 2031.
Which resin dominates current demand?
Polyamide holds the lead with 38.89% of 2025 volume thanks to cost-effective injection-molding compatibility.
What end-use segment is growing fastest after automotive?
Aerospace and defense applications are projected to rise at a 6.18% CAGR as airframers shift to continuous-fiber thermoplastic structures.
Why are thermoplastic composites preferred for hydrogen storage?
Type IV cylinders with thermoplastic wraps weigh 40% less than steel and resist hydrogen embrittlement, improving fuel-cell vehicle range and safety.
Which region will add the most incremental volume by 2031?
Asia-Pacific leads in absolute tonnage, while the Middle East and Africa post the highest growth rate at 5.72% per year, driven by hydrogen infrastructure builds.
Page last updated on:


