Market Overview
| Study Period | 2021 - 2031 |
|---|---|
| Forecast Data Period | 2026 - 2031 |
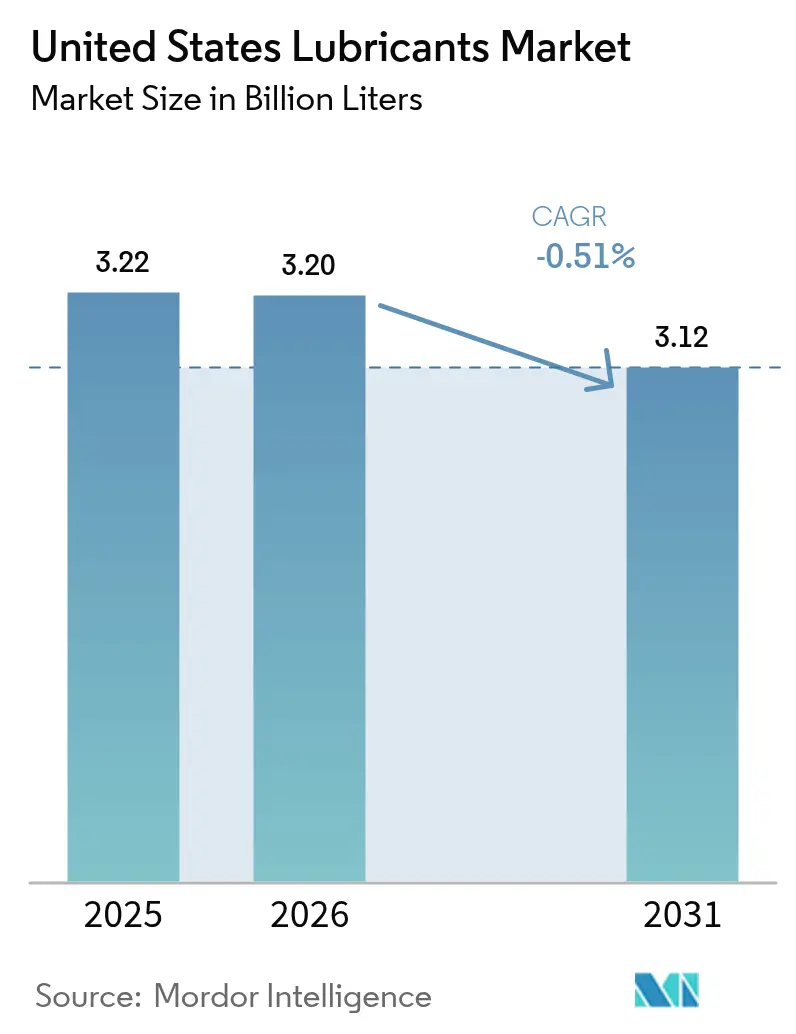
| Base Year Market Size (2025) | 3.22 Billion liters |
| Market Volume (2026) | 3.20 Billion liters |
| Market Volume (2031) | 3.12 Billion liters |
| Growth Rate (2026 - 2031) | -0.51% CAGR |
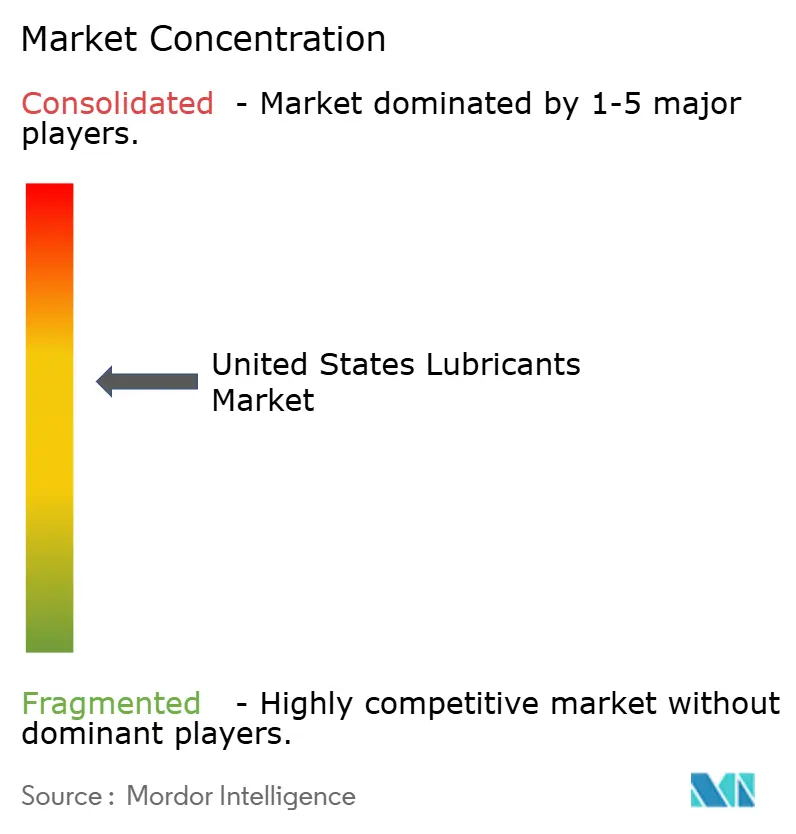
| Market Concentration | Medium |
Major Players *Disclaimer: Major Players sorted in no particular order Image © Mordor Intelligence. Reuse requires attribution under CC BY 4.0. | |
United States Lubricants Market Analysis by Mordor Intelligence
The United States Lubricants Market size is projected to contract from 3.22 Billion liters in 2025 and 3.20 Billion liters in 2026 to 3.12 Billion liters by 2031, registering a CAGR of -0.51% between 2026 to 2031. Automotive engine oil volumes are declining due to the increasing adoption of electric vehicles (EVs) and the extension of drain intervals by original equipment manufacturers (OEMs) to over 10,000 miles. Additionally, the Environmental Protection Agency’s (EPA) 2027 low-NOx regulation is driving a shift toward ultra-low-viscosity PC-12 oils, which require high-quality Group III base stocks. Domestic Group III production capacity expansions by ExxonMobil and Chevron have reduced reliance on imports but have also heightened price competition among independent blenders. Meanwhile, artificial intelligence (AI)-enabled condition-monitoring platforms are segmenting demand, with fleets opting for premium synthetics, while cost-sensitive buyers continue to prefer mineral oils.
Key Report Takeaways
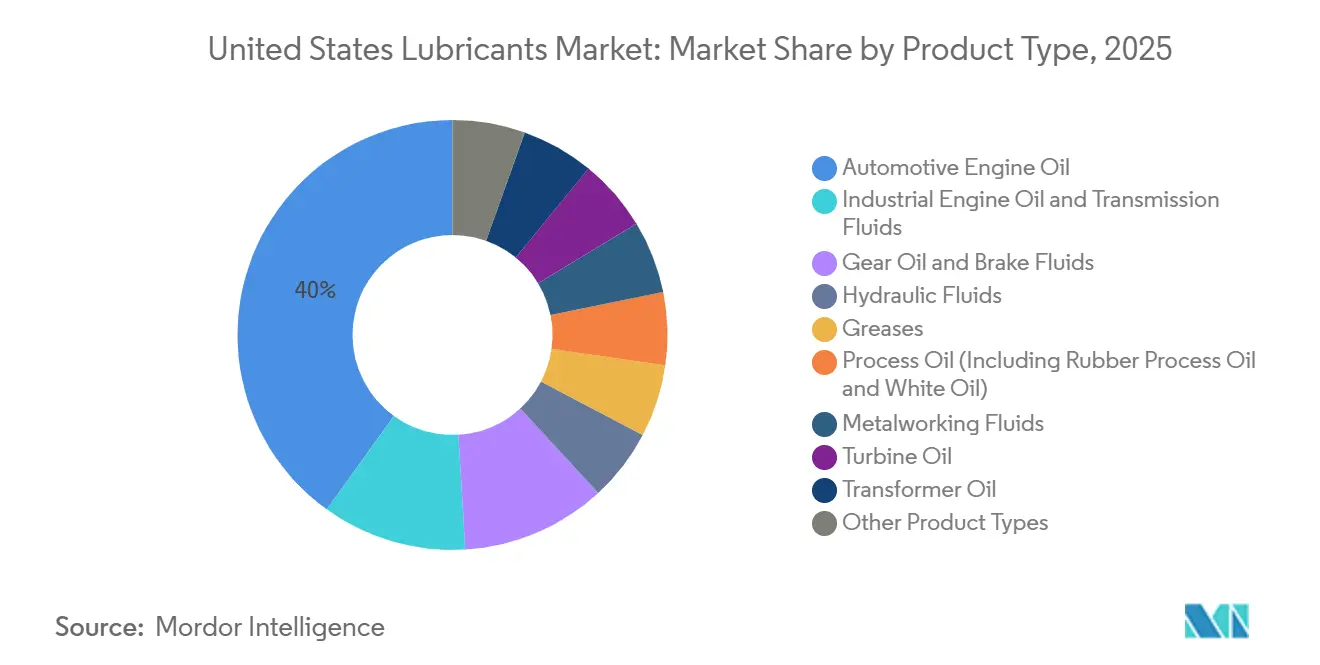
- By product type, automotive engine oil led with 40.05% of the United States lubricants market share in 2025, while industrial engine oil is projected to post the fastest growth at 0.07% CAGR through 2031.
- By base stock type, mineral oil-based lubricants accounted for 61.70% of the United States lubricants market share in 2025, while bio-based lubricants are forecast to expand at a 0.22% CAGR through 2031.
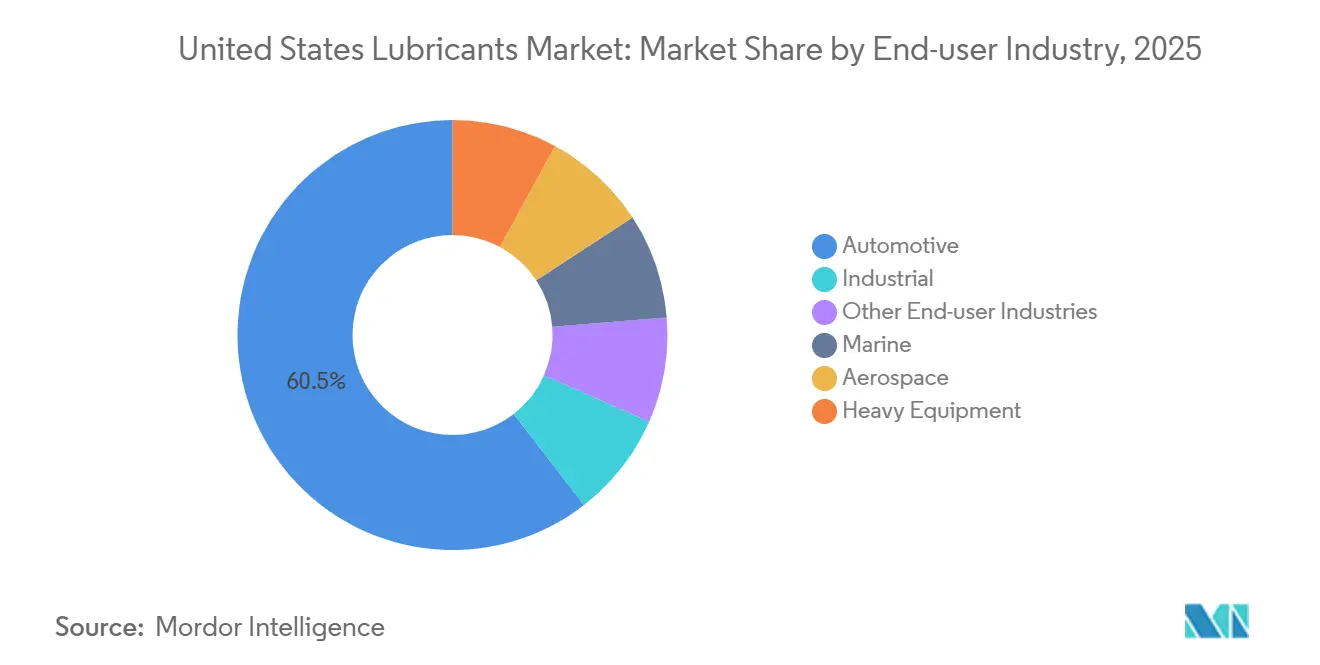
- By end-user industry, the automotive segment held 60.48% of the United States lubricants market share in 2025, whereas the industrial segment is expected to advance at a 0.05% CAGR through 2031.
Note: Market size and forecast figures in this report are generated using Mordor Intelligence’s proprietary estimation framework, updated with the latest available data and insights as of 2026.
United States Lubricants Market Trends and Insights
Drivers Impact Analysis*
| Driver | (~) % Impact on CAGR Forecast | Geographic Relevance | Impact Timeline |
|---|---|---|---|
| Manufacturing and construction rebound | +0.3% | National, concentrated in Texas, California, and Great Lakes industrial corridors | Medium term (2-4 years) |
| Shift toward Group II/III and synthetic formulations | +0.2% | National, with premium adoption strongest in Northeast and West Coast | Long term (≥ 4 years) |
| EPA 2027 low-NOx rule spurring ultra-low-vis oils | +0.4% | National, heavy-duty fleet operators in logistics hubs (Texas, Illinois, California) | Short term (≤ 2 years) |
| Domestic Group III capacity additions lowering import risk | +0.1% | National, supply-chain benefits concentrated in Gulf Coast refining centers | Medium term (2-4 years) |
| AI-enabled predictive-maintenance uptake for premium lubes | +0.2% | National, early adoption in automotive fleets and discrete manufacturing | Long term (≥ 4 years) |
| Source: Mordor Intelligence | |||
Manufacturing And Construction Rebound
Industrial production returned to growth in late 2025, increasing demand for metalworking fluids, gear oils, and hydraulic oils in discrete manufacturing. Infrastructure spending under the Infrastructure Investment and Jobs Act enhanced construction equipment utilization, driving the need for biodegradable hydraulic fluids[1]U.S. Census Bureau, “Value of Construction Put in Place,” census.gov. Automotive assembly remained steady as EV production replaced traditional lubricated powertrains, but aerospace and medical-device machining experienced growth, favoring synthetic coolants. Expansion in copper and lithium mining further supported the use of ecological hydraulic fluids in environmentally sensitive areas. These factors partially mitigated the decline in automotive volumes.
Shift Toward Group II/III And Synthetic Formulations
Group II and Group III base stocks accounted for approximately 55% of finished-oil volume in 2025, as OEMs specified low-SAPS oils to improve emissions after-treatment durability. ExxonMobil’s Baytown and Chevron’s Pascagoula expansions collectively added 14,000 barrels per day of Group III supply, reducing import dependency and narrowing price premiums. Polyalphaolefin and ester synthetics, priced 15-20% higher than Group III, gained popularity in turbocharged gasoline direct-injection engines due to their deposit-control benefits. Quick-lube chains in rural areas continued to prioritize mineral 5W-30 blends, creating a two-tier market. API licensing requirements ensured that new-vehicle oils complied with ILSAC GF-6B or API SP standards, effectively mandating higher-quality base stocks.
EPA 2027 Low-NOx Rule Spurring Ultra-Low-Vis Oils
The EPA finalized its heavy-duty low-NOx standard in December 2024, leading to the introduction of the PC-12 category with viscosity grades as low as 0W-20. Fuel economy improvements of 1-2% are critical for fleets facing diesel prices above USD 4 per gallon in 2025. Additive manufacturers have invested over USD 200 million in low-SAPS chemistry to meet the new 0.4% sulfated-ash limit. Truck OEMs must finalize oil-supply contracts by mid-2026 to ensure certification, compressing development timelines. Legacy CK-4 formulations will continue to be used for pre-2027 engines, segmenting the heavy-duty oil market for the rest of the decade.
Domestic Group III Capacity Additions Lowering Import Risk
U.S. Group III imports decreased from 42,000 to 35,000 barrels per day between 2023 and 2025 as ExxonMobil and Chevron brought new capacity online. Vertex Energy’s gas-to-liquid project is expected to add an additional 3,000 barrels per day of low-carbon Group II. This increased supply compressed price spreads over Group II, reducing blender margins. Tolling agreements with integrated majors have become essential for independents such as HF Sinclair and Calumet. The concentrated supply landscape has raised entry barriers for potential new market participants.
Restraints Impact Analysis*
| Restraint | (~) % Impact on CAGR Forecast | Geographic Relevance | Impact Timeline |
|---|---|---|---|
| Base-oil price volatility squeezing blender margins | -0.6% | National, acute for independent blenders in Midwest and Southeast | Short term (≤ 2 years) |
| Extended OEM drain intervals dampening replenishment demand | -0.8% | National, concentrated in passenger-car and light-truck segments | Long term (≥ 4 years) |
| Lithium-soap thickener scarcity inflating grease costs | -0.3% | National, affecting automotive and industrial grease applications | Medium term (2-4 years) |
| Source: Mordor Intelligence | |||
Base-Oil Price Volatility Squeezing Blender Margins
Group II prices fluctuated between USD 3.20 and USD 4.10 per gallon in 2025, reducing independent blender margins to low double digits. Integrated majors mitigated this volatility through captive refining, while independents faced 4-6 weeks of exposure between feedstock purchases and product sales. Additive costs, which account for 15-20% of total costs, also increased, necessitating reformulation trials that require lengthy OEM approvals. Automotive retail prices remained inflexible, limiting the ability to pass on costs. Industrial contracts offered more pricing flexibility but represented only a quarter of total volume, insufficient to offset pressure in the core automotive segment.
Extended OEM Drain Intervals Dampening Replenishment Demand
Ford and General Motors now recommend 10,000-mile oil change intervals for mainstream turbocharged engines, doubling service life compared to 2015 standards. On-board oil-life monitors further optimize change timing, reducing throughput for dealerships and quick-lube centers[2]National Automobile Dealers Association, “Service Trends 2025,” nada.org. EVs do not require engine oil, and plug-in hybrids consume up to 50% less lubricant, further diminishing installed-base demand. While some do-it-yourself drivers disregard OEM recommendations, sustaining a portion of retail demand, the overall downward trend in replenishment demand remains evident.
*Our forecasts treat driver/restraint impacts as directional, not additive. The impact forecasts reflect baseline growth, mix effects, and variable interactions.
Segment Analysis
By Product Type: Automotive Engine Oil Anchor Volume Dominance
Automotive engine oil accounted for 40.05% of the United States lubricants market share in 2025. However, declining internal combustion engine (ICE) vehicle sales and longer drain intervals are expected to lead to a future contraction. Industrial engine oil is projected to grow modestly at a 0.07% CAGR through 2031, driven by the expansion of gas-fired power generation and data-center backup generators. Transmission fluid trends vary: demand for continuously variable transmission (CVT) fluid is increasing, supported by 38% CVT penetration in compact crossovers, while fill-for-life multi-speed automatics are reducing traditional automatic transmission fluid (ATF) sales.
Process oils provide a buffer against automotive market weakness, with rubber process oil volumes linked to 330 million U.S. tire shipments in 2025. Grease production faces cost pressures due to lithium scarcity, prompting a shift toward calcium-complex systems for certain chassis applications. Biodegradable hydraulic fluids for forestry equipment are gaining traction, driven by state-level environmental regulations in the Pacific Northwest. Across these segments, premium synthetic lubricants continue to dominate where performance and life-cycle cost considerations are critical.


By Base Stock Type: Mineral Oil-Based Lubricants Dominance Erodes as Bio-Based Lubricants Gain Momentum
Mineral oil-based lubricants retained 61.70% of the United States lubricants market share in 2025, primarily due to their cost advantage. However, low-SAPS (sulfated ash, phosphorus, and sulfur) mandates and energy-efficiency goals are pushing original equipment manufacturers (OEMs) toward Group III and synthetic lubricants, expanding the premium segment. Semi-synthetic blends, which combine 20-30% polyalphaolefin (PAO) with Group II/III base stocks, are thriving in quick-lube outlets seeking a balance between cost and performance.
Bio-based lubricants are expected to grow at a 0.22% CAGR through 2031, supported by federal procurement under the USDA’s BioPreferred program and niche applications in food processing and forestry. However, fluctuations in feedstock prices and limitations in high-temperature performance restrict broader adoption, positioning bio-based oils as complementary rather than direct competitors to petrochemical-based synthetics.
By End-user Industry: Automotive Decline Offset by Industrial Resilience
The automotive industry accounted for 60.48% of lubricant demand in 2025. However, the sale of 1.8 million electric vehicles (EVs) reduced lubricant consumption for internal combustion engines. Heavy-duty trucks partially offset this decline, with PC-12 oils supporting fleet upgrades. Marine and aerospace segments deliver higher margins due to stringent MIL-PRF and IMO specifications, which create barriers to entry for new competitors.
The industrial segment is forecast to grow at a 0.05% CAGR through 2031, driven by diverse applications in power generation, metalworking, and textiles. Natural gas turbines are adopting ISO VG 32 oils for their superior oxidation stability, while aerospace machining increasingly relies on synthetic coolants for aluminum alloy processing. Mining and construction machinery are benefiting from infrastructure investments, boosting demand for high-zinc engine oils and anti-wear hydraulic fluids.
Geography Analysis
Regional demand is concentrated in the Gulf Coast, Midwest, and California. Gulf Coast refiners supply Group III base stocks, reducing logistics costs for regional blenders. The Midwest, with its automotive and heavy-equipment manufacturing hubs, consumes significant volumes of engine and hydraulic oils. California’s stringent environmental regulations are accelerating the adoption of low-SAPS synthetics and biodegradable fluids.
In the Northeast, cold winters drive demand for 0W-20 and 5W-30 synthetic oils with superior pumpability. The Southeast’s growing ports and data-center corridors are increasing the need for turbine and transformer oils. Forestry operations in the Mountain West are driving regional demand for bio-based hydraulic fluids. Climate and regulatory variations across regions necessitate localized product mixes, requiring distributors to manage seasonally adjusted inventories effectively.
Competitive Landscape
Integrated companies such as ExxonMobil, Shell, Chevron, Valvoline, and BP controlled approximately 64% of the market volume in 2025, leveraging vertical integration and extensive distribution networks. Shell’s collaboration with Blue Tide on a 5,000-barrel-per-day re-refinery reduces feedstock carbon intensity and strengthens its circular economy credentials. Independent blenders compete on price and regional presence but remain vulnerable to fluctuations in base-oil costs.
Service bundling has emerged as a key differentiator, with programs like Signum and LubeAnalyst converting one-time sales into subscription-based contracts, enhancing customer retention. Specialty firms such as FUCHS and Quaker Houghton focus on high-margin metalworking fluids, which require advanced technical expertise. Patent activity in low-SAPS additives and bio-esters highlights an ongoing innovation race to establish a foothold in emerging sustainability-focused niches.
United States Lubricants Industry Leaders
Exxon Mobil Corporation
Shell plc
BP p.l.c
Chevron Corporation
Valvoline
- *Disclaimer: Major Players sorted in no particular order

Recent Industry Developments
- March 2026: Pennzoil Quaker State Company, operating as a wholly owned subsidiary of Shell USA, Inc., sold Jiffy Lube International (JLI) and its subsidiary, Premium Velocity Auto (PVA) LLC, to an affiliate of Monomoy Capital Partners (Monomoy) for USD1.3 billion. As part of the transaction, Pennzoil Quaker State Company entered long-term lubricants supply agreement with Monomoy.
- March 2026: Palmdale Oil Company acquired assets from Fleetwing, a well-established fuel and lubricant distributor located in Lakeland, Florida. This acquisition enhanced Palmdale's infrastructure along the I-4 corridor and broadened its service offerings for commercial and industrial customers throughout the state.


United States Lubricants Market Report Scope
Lubricants are substances made from a combination of base oils and additives. These lubricants are used in various automotive applications such as engines, brakes, gears, and other parts. The base oil composition in the formulation of lubricants is primarily between 75-90%. Lubricants are used to reduce friction between surfaces in contact to minimize energy loss generated from friction.
The United States lubricants market is segmented by product type, base stock type, and end-user industry. By product type, the market is segmented into automotive engine oil, industrial engine oil, transmission fluids, gear oil, brake fluids, hydraulic fluids, greases, process oil (including rubber process oil and white oil), metalworking fluids, turbine oil, transformer oil, and other product types. By base stock type, the market is segmented into mineral oil-based lubricants, synthetic lubricants, semi-synthetic lubricants, and bio-based lubricants. By end-user industry, the market is segmented into automotive, marine, aerospace, heavy equipment, industrial, and other end-user industries. The automotive segment is further segmented into passenger vehicles, commercial vehicles, and two-wheelers. The heavy equipment segment is further segmented into construction, mining, and agriculture. The industrial segment is further segmented into power generation, metallurgy and metalworking, textiles, and oil and gas. For each segment, the market sizing and forecasts have been done on the basis of volume (liters).
By Product Type
| Automotive Engine Oil |
| Industrial Engine Oil |
| Transmission Fluids |
| Gear Oil |
| Brake Fluids |
| Hydraulic Fluids |
| Greases |
| Process Oil (Including Rubber Process Oil and White Oil) |
| Metalworking Fluids |
| Turbine Oil |
| Transformer Oil |
| Other Product Types |
By Base Stock Type
| Mineral Oil-Based Lubricants |
| Synthetic Lubricants |
| Semi-Synthetic Lubricants |
| Bio-Based Lubricants |
By End-user Industry
| Automotive | Passenger Vehicles |
| Commercial Vehicles | |
| Two-Wheelers | |
| Marine | |
| Aerospace | |
| Heavy Equipment | Construction |
| Mining | |
| Agriculture | |
| Industrial | Power Generation |
| Metallurgy and Metalworking | |
| Textiles | |
| Oil and Gas | |
| Other End-user Industries |
| By Product Type | Automotive Engine Oil | |
| Industrial Engine Oil | ||
| Transmission Fluids | ||
| Gear Oil | ||
| Brake Fluids | ||
| Hydraulic Fluids | ||
| Greases | ||
| Process Oil (Including Rubber Process Oil and White Oil) | ||
| Metalworking Fluids | ||
| Turbine Oil | ||
| Transformer Oil | ||
| Other Product Types | ||
| By Base Stock Type | Mineral Oil-Based Lubricants | |
| Synthetic Lubricants | ||
| Semi-Synthetic Lubricants | ||
| Bio-Based Lubricants | ||
| By End-user Industry | Automotive | Passenger Vehicles |
| Commercial Vehicles | ||
| Two-Wheelers | ||
| Marine | ||
| Aerospace | ||
| Heavy Equipment | Construction | |
| Mining | ||
| Agriculture | ||
| Industrial | Power Generation | |
| Metallurgy and Metalworking | ||
| Textiles | ||
| Oil and Gas | ||
| Other End-user Industries | ||


Key Questions Answered in the Report
What is the volume of the United States lubricants market?
The United States lubricants market stands at 3.20 billion liters in 2026 and is projected to decline to 3.12 billion liters by 2031.
Which product type is growing the fastest through 2031?
Industrial engine oil shows the highest projected growth, advancing at 0.07% CAGR through 2031 on the back of gas-fired power generation and data-center backup gensets.
Why are Group III base stocks becoming more important?
EPA emissions rules and OEM fuel-efficiency targets require low-viscosity, low-SAPS oils that can only be met reliably with Group III or higher base stocks.
How does the EPA 2027 low-NOx rule influence blending strategies?
It mandates PC-12 oils with viscosities down to 0W-20, pushing blenders to invest in premium additives and secure Group III supply for catalyst-safe formulations.
Page last updated on:


