Linerless Labels Market Size and Share
Market Overview
| Study Period | 2020 - 2031 |
|---|---|
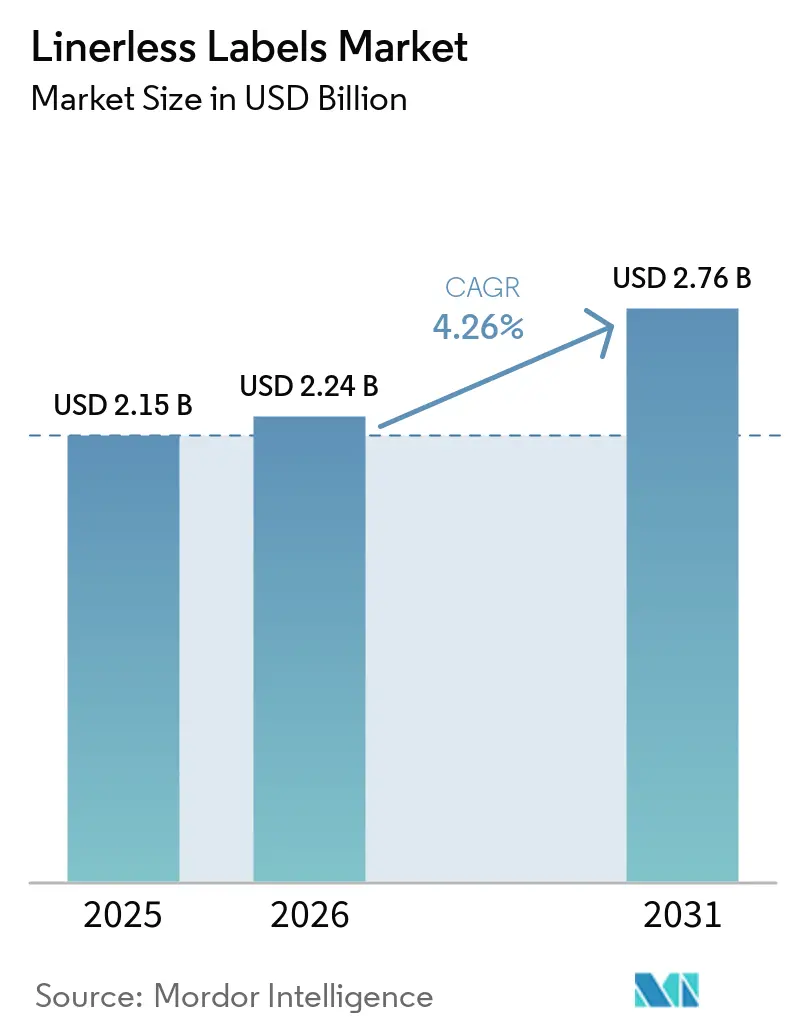
| Market Size (2026) | USD 2.24 Billion |
| Market Size (2031) | USD 2.76 Billion |
| Growth Rate (2026 - 2031) | 4.26% CAGR |
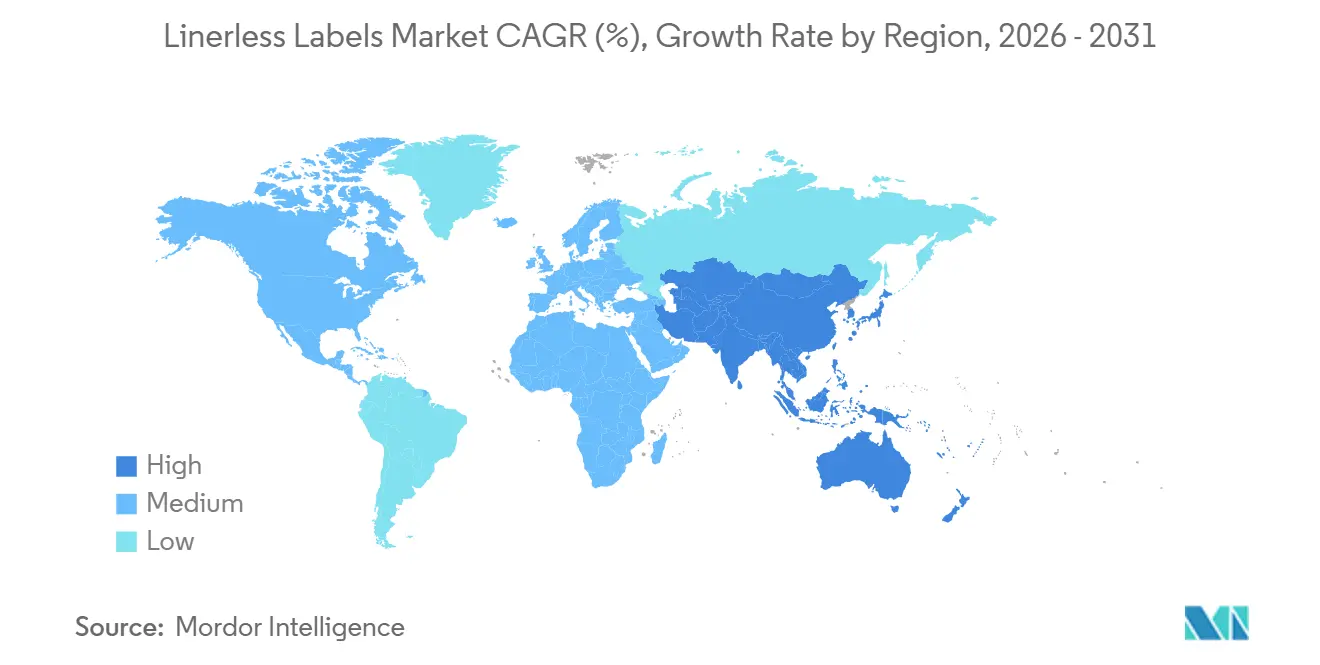
| Fastest Growing Market | Asia-Pacific |
| Largest Market | Europe |
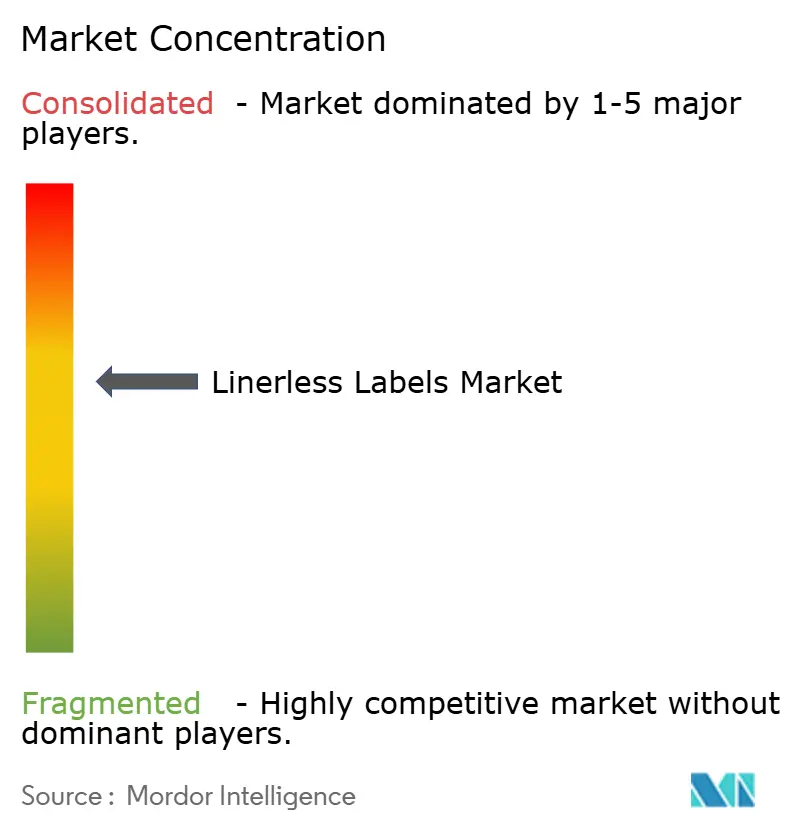
| Market Concentration | Medium |
Major Players *Disclaimer: Major Players sorted in no particular order Image © Mordor Intelligence. Reuse requires attribution under CC BY 4.0. | |
Linerless Labels Market Analysis by Mordor Intelligence
The Linerless Labels Market size is expected to increase from USD 2.15 billion in 2025 to USD 2.24 billion in 2026 and reach USD 2.76 billion by 2031, growing at a CAGR of 4.26% over 2026-2031.
The linerless labels market is benefiting from tighter packaging waste rules in Europe and North America, while rising parcel volumes are increasing demand for variable-length labels that work well in high-throughput fulfillment settings. The linerless labels market is also seeing stronger interest from food producers and logistics operators that want to reduce liner waste, improve line uptime, and support broader sustainability targets. Competitive positioning in the linerless labels market is being shaped by vertical integration, adhesive know-how, and the ability to connect labeling hardware with analytics and RFID capabilities. The linerless labels market also has room to expand through digital printing, recycled and specialty facestocks, and smart labeling programs that connect product tracking with inventory and operational data. At the same time, retrofit costs and raw material volatility are keeping adoption uneven across legacy sites, especially where capital budgets remain tight.
Key Report Takeaways
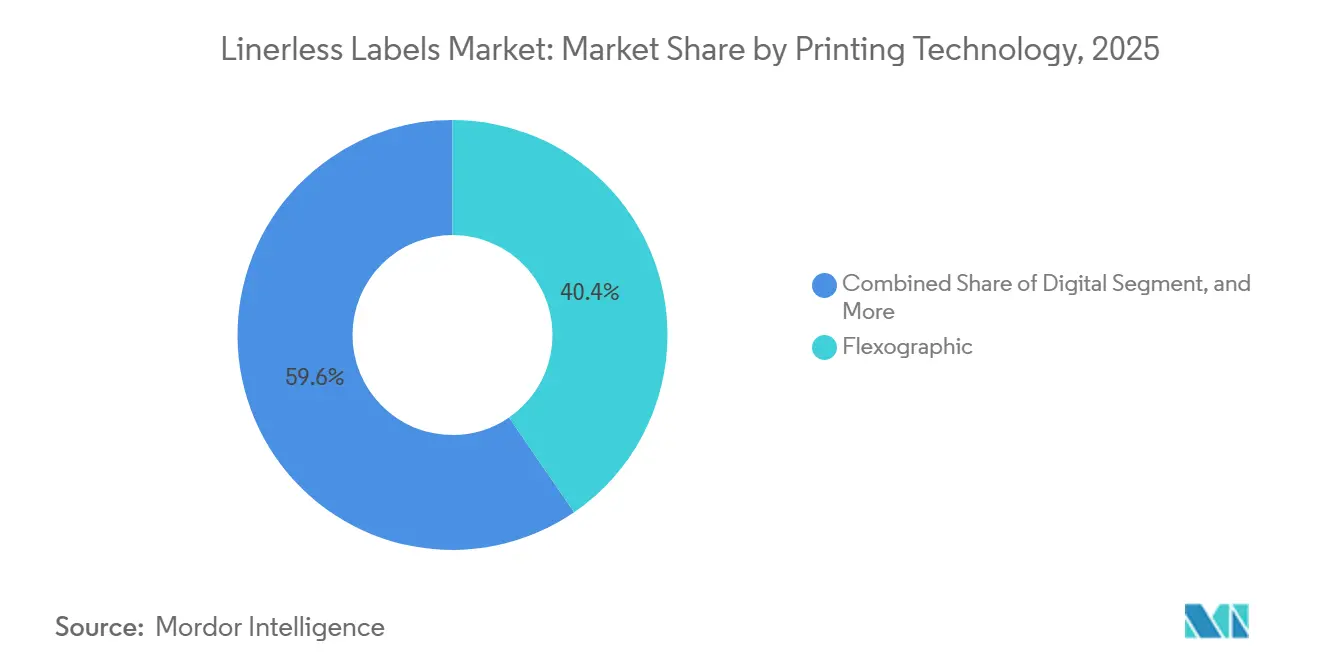
- By printing technology, flexographic printing held 40.43% of the linerless labels market share in 2025, while digital inkjet and thermal printing is projected to expand at a 5.43% CAGR through 2031.
- By facestock material, film substrates accounted for 48.23% share of the linerless labels market size in 2025, while specialty and recycled substrates are expected to expand at a 5.72% CAGR through 2031.
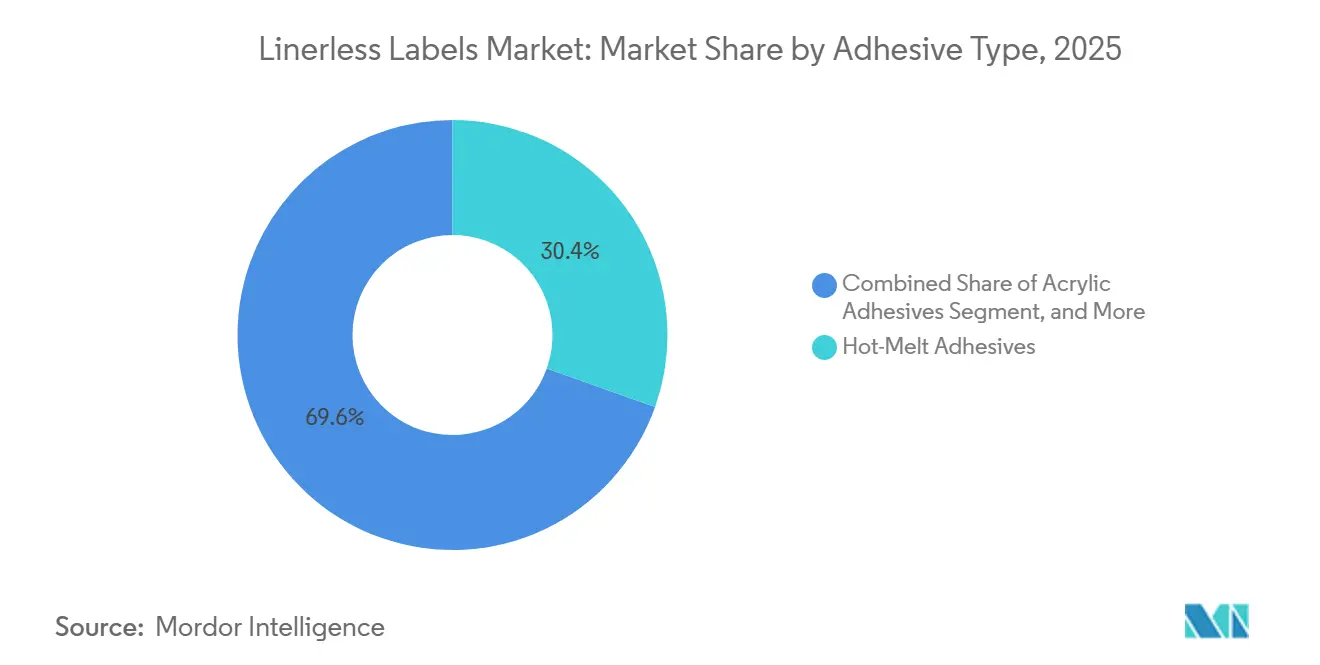
- By adhesive type, hot-melt adhesives held 30.43% share of the linerless labels market size in 2025, while acrylic adhesives are projected to grow at a 5.61% CAGR through 2031.
- By end-user industry, food held 28.46% of the linerless labels market share in 2025, while logistics and e-commerce is projected to expand at a 6.14% CAGR through 2031.
- By geography, Europe held 38.82% of the linerless labels market share in 2025, while Asia-Pacific is projected to grow at a 6.04% CAGR through 2031.
Note: Market size and forecast figures in this report are generated using Mordor Intelligence’s proprietary estimation framework, updated with the latest available data and insights as of January 2026.
Global Linerless Labels Market Trends and Insights
Drivers Impact Analysis*
| Driver | (~) % Impact on CAGR Forecast | Geographic Relevance | Impact Timeline |
|---|---|---|---|
| Rising Sustainability Mandates in Food and Beverage Packaging | +1.2% | Global, with highest regulatory intensity in EU and North America | Medium term (2-4 years) |
| E-Commerce Logistics Boom Requiring Variable-Length Shipping Labels | +1.0% | Global, concentration in North America, China, India, and Southeast Asia | Short term (≤ 2 years) |
| Regulatory Waste-Reduction Mandates in Europe and North America | +0.9% | Europe and North America | Long term (≥ 4 years) |
| RFID-Enabled Connected Packaging and Micro-Fulfillment Adoption | +0.6% | Global, spill-over from North America and EU to APAC | Medium term (2-4 years) |
| Quick-Service Restaurant Kitchen Automation Driving On-Demand Linerless Printing | +0.5% | North America, Europe, Japan, and expanding into APAC quick-commerce hubs | Medium term (2-4 years) |
| Carbon Border Adjustment Mechanisms Elevating Demand for Low-Waste Labeling | +0.3% | EU core, with spill-over to trading partners in APAC and South America | Long term (≥ 4 years) |
| Source: Mordor Intelligence | |||


Rising Sustainability Mandates in Food and Beverage Packaging
Sustainability requirements in packaged food and beverage are moving from voluntary goals toward operating requirements, and that shift is supporting the linerless labels market across major packaged goods categories. FINAT stated in 2026 that packaging placed on the EU market will need to meet stricter recyclability requirements under the PPWR framework, underscoring the importance of label formats that reduce waste and simplify material flows. Ravenwood Packaging noted in 2025 that linerless formats help producers respond to UK and EU policy shifts by removing the release liner, thereby reducing disposal needs and supporting lower waste-handling burdens. That matters most in chilled food lines, where label volumes are high, and disposal contracts are already under review. As a result, the linerless labels market is gaining traction, with sustainability goals now sitting alongside cost and compliance in procurement decisions.
E-Commerce Logistics Boom Requiring Variable-Length Shipping Labels
Parcel growth continues to support the linerless labels market, as continuous rolls suit high-volume shipping operations that require variable label lengths and fast changeovers. The United States Census Bureau estimated that retail e-commerce sales in 2025 grew significantly, keeping parcel demand elevated across retail fulfillment and third-party logistics networks.[1]U.S. Census Bureau, “Quarterly Retail E-Commerce Sales,” U.S. Census Bureau, census.gov Lowry Solutions explained in 2025 that linerless labeling is well-suited to logistics and warehouse settings that need efficient print-and-apply workflows across changing package formats. The value of this model increases further in dense urban fulfillment sites, where operators benefit from fewer material-handling steps and lower space requirements for label stock. These conditions are helping the linerless labels market expand beyond its earlier food-service base into mainstream fulfillment and shipping applications.
Regulatory Waste-Reduction Mandates in Europe and North America
Waste-reduction rules are expanding the addressable market for linerless labels, as packaging decisions are now tied more closely to recyclability and material minimization. It is estimated that EU regulatory direction is making market access increasingly dependent on packaging formats that meet recyclability requirements. Ravenwood Packaging also highlighted that UK producers face recyclability-linked cost signals under Extended Producer Responsibility, which gives procurement teams a direct reason to remove liner waste where possible. The combined effect is not limited to compliance, because it also changes the economic comparison between conventional self-adhesive labels and liner-free alternatives. That shift is helping the linerless labels market build a stronger long-term position in food, beverage, and logistics packaging programs.
RFID-Enabled Connected Packaging and Micro-Fulfillment Adoption
Smart labeling is expanding the linerless labels market because RFID and related sensor technologies increase the value of each label beyond identification alone. Avery Dennison announced in April 2026 a strategic USD 75 million investment in Wiliot and became the preferred inlay design, manufacturing, and commercial partner for Wiliot’s battery-free Bluetooth Low-Energy platform. Avery Dennison also said in its first quarter 2026 results that a significant RFID rollout in food applications with the largest U.S. grocery retailer is expected in the second half of 2026. This supports a broader shift in the linerless labels market toward formats that combine product data, tracking, and operational visibility on the same label. As retailers and logistics operators scale connected packaging, the linerless labels market is likely to benefit most where speed, data density, and automation already matter.
Restraints Impact Analysis*
| Restraint | (~) % Impact on CAGR Forecast | Geographic Relevance | Impact Timeline |
|---|---|---|---|
| Retrofit Costs for Legacy Labeling Lines | -0.8% | Global, acute in North America and Europe | Short term (≤ 2 years) |
| Raw-Material Price Volatility in Adhesives and Release Coatings | -0.6% | Global | Medium term (2-4 years) |
| Shortage of High-Performance Silicone-Free Adhesives | -0.4% | Global, supply constraints concentrated in APAC | Long term (≥ 4 years) |
| Adhesive Build-Up Issues in Cold-Chain Environments | -0.3% | North America, Europe, and cold-chain-intensive APAC markets | Medium term (2-4 years) |
| Source: Mordor Intelligence | |||
Retrofit Costs for Legacy Labeling Lines
Retrofit spending remains one of the clearest near-term constraints on the linerless labels market, especially in plants and distribution centers built around conventional liner systems. Lowry Solutions noted in 2025 that standard thermal desktop and mobile printers do not support linerless formats, and that dedicated systems require specialized components, such as non-stick rollers and purpose-built activation units. This creates a longer conversion path for food and regulated end uses, where hardware changes must also pass internal qualification and compliance reviews. The linerless labels market is therefore splitting between newer sites that can specify linerless systems from the start and older sites that need a stronger savings case before investing. Even where modular upgrade paths are emerging, the linerless labels market still faces slower adoption among smaller converters and contract packagers with tighter capital budgets.
Raw-Material Price Volatility in Adhesives and Release Coatings
The linerless labels market remains sensitive to swings in adhesive and release-coating inputs because these materials do most of the technical work in the finished construction. A technical comparison published in 2025 in UV+EB Technology and Converting Quarterly showed that silicone system choice affects printhead compatibility and release behavior in linerless applications, underscoring the specialized nature of these chemistries. UPM Adhesive Materials also launched new adhesive lines in June 2026 for demanding pharmaceutical, wine and spirits, and industrial chemical applications, reflecting the continuing need for tightly engineered adhesive performance in regulated and challenging environments. These conditions do not remove demand, but they can compress margins and slow the pace of capacity additions. For that reason, the linerless labels market is likely to reward suppliers that control formulation development and converter qualification more closely than open-market buyers can.
*Our forecasts treat driver/restraint impacts as directional, not additive. The impact forecasts reflect baseline growth, mix effects, and variable interactions.
Segment Analysis
By Printing Technology: Digital Formats Recalibrate The Flexo-Led Installed Base
Flexographic printing held a 40.43% share of the linerless labels market in 2025, reflecting its long installed base, efficient economics in long runs, and broad compatibility with adhesive-coated facestocks. Gravure printing remained a narrower option used in selected premium beverage and cosmetics applications where high image consistency still matters. Other printing formats, including screen and offset hybrids, served smaller, specification-heavy programs rather than core-volume demand. Even with that installed base, the linerless labels market is shifting more clearly toward digital formats where variable data, shorter runs, and integrated tracking functions carry more value than plate efficiency alone.
Digital (inkjet and thermal) printing is projected to grow at a 5.43% CAGR through 2031, and that expansion is changing how converters in the linerless labels industry balance capacity, run length, and data complexity. Labels and Labeling reported in 2026 that 1,200 DPI inkjet systems are becoming more attractive to converters seeking consistent quality and scalable productivity across short- to long-run applications. Hybrid inkjet systems are also gaining ground because they let converters add digital flexibility without abandoning existing finishing and conventional print assets. As web-to-label ordering expands and smart-label requirements become more common, the linerless labels market is likely to keep moving toward a mixed production base where flexo stays important but digital absorbs the faster-growing workloads.


By Facestock Material: Film Substrates Anchor The Market While Recycled Grades Advance
Film substrates, including PP, PET, and PE, accounted for 48.23% of the linerless labels market size in 2025 because they offered strong moisture resistance, chemical durability, and dimensional stability across food, beverage, and personal care use. Paper facestocks remained important for ambient food labeling, direct thermal applications, quick-service restaurant ticketing, and shipping labels, where print quality needs are simpler and cost control matters more. Specialty and recycled substrates formed the fastest-growing facestock group, with a 5.72% CAGR expected through 2031. This mix shows that the linerless labels market is still anchored by proven performance materials, even as procurement standards are increasingly rewarding recyclability and post-consumer content.
UPM Adhesive Materials introduced the UPM ProCycle portfolio in May 2026 for rigid PET and HDPE packaging in food and beverage and home and personal care applications, with the materials independently verified as recycling-compatible across packaging types and markets.[2]UPM Adhesive Materials, “UPM Delivers Purpose-Built Adhesive Solutions for Demanding Label Applications,” UPM Adhesive Materials, labelmaterials.upm.com UPM Raflatac also launched the OptiCut WashOff linerless label in October 2024 for returnable and reusable plastic food containers, supporting cleaner removal during industrial washing and better alignment with packaging reuse cycles. Within the linerless labels industry, these launches show that material innovation is focused less on novelty and more on proving compatibility with real recycling and reuse systems. That is helping the linerless labels market expand into applications where sustainability claims now need operational evidence rather than broad messaging.
By Adhesive Type: Hot-Melt Dominance Meets Acrylic’s Accelerating Gains
Hot-melt adhesives held a 30.43% share of the linerless labels market in 2025, supported by fast tack, reliable bonding on films and corrugated surfaces, and compatibility with high-speed applicator settings. Specialty adhesive systems served smaller but important niches, especially where migration limits, sterile conditions, or highly specific substrate behavior shaped the qualification process. Other adhesive types, including water-based and emulsion systems, remained less central because slower cure profiles and narrower substrate fit limited their role in production-speed linerless use. This left the linerless labels market with a clear current leader in hot melt, even as the growth path increasingly favored systems with broader substrate flexibility.
Acrylic adhesives are projected to grow at a 5.61% CAGR through 2031, reflecting performance gains that have narrowed historical gaps in colder and more demanding environments. The technical comparison published in 2025 by UV+EB Technology and Converting Quarterly found that thermal silicone systems commonly paired with acrylics can offer better printhead compatibility because their chemistry transfers less silicone to direct-thermal printheads. UPM Adhesive Materials reinforced this direction in June 2026 by launching purpose-built adhesive lines for pharmaceutical, wine and spirits, and industrial chemical labeling, where performance certification remains critical. Together, these changes indicate that the linerless labels market is moving toward adhesive systems that can support wider SKU ranges without sacrificing reliability.
By End-User Industry: Food Maintains Leadership As Logistics Accelerates
Food accounted for 28.46% of the linerless labels market in 2025, making it the largest end-user segment, as the format has long been established for weigh-scale labeling of meat, fish, poultry, and fresh packaged items. Beverage remained relevant in craft brewing and premium spirits, where linerless neck collars and body labels increasingly support sustainability messaging. Healthcare and pharmaceuticals also present a higher-value opportunity in the linerless labels market, though adoption remains slower because validation, sterility, and print-record requirements extend pilot and qualification timelines.
Logistics and e-commerce is expected to grow at a 6.14% CAGR through 2031, making it the fastest-growing end-user area in the linerless labels market as parcel flows continue to scale. Avery Dennison said in its first-quarter 2026 results that its food segment expects a significant RFID linerless rollout with the largest U.S. grocery retailer across bakery, meat, and deli applications in the second half of 2026. That example shows how food and logistics demand are converging around labels that combine product identification and inventory intelligence. As connected packaging programs spread, the linerless labels market is likely to see its strongest new demand where traceability and high-speed application are needed together.
Geography Analysis
Europe held 38.82% of the linerless labels market in 2025, maintaining its leading regional position, as regulations, converter capabilities, and large retail chains all supported adoption. FINAT reported in 2026 that the PPWR direction strengthens the commercial importance of packaging formats that can meet recyclability expectations and maintain access to the EU market. The UK added a parallel economic driver through Extended Producer Responsibility, with recyclability-weighted fees reinforcing the case for eliminating non-recyclable liner waste. Germany and France remained the most advanced national markets in Europe, while adoption in Italy and the rest of the region stayed more concentrated among larger food and logistics operators.
Asia-Pacific is projected to expand at a 6.04% CAGR through 2031, which makes it the fastest-growing regional segment in the linerless labels market. SATO Corporation announced in September 2025 that ASKUL adopted its NonSepa linerless label at the Kanto Distribution Center, using dedicated automatic label-printing and application machines to replace conventional liner labels. China’s logistics operators are also working in an environment where Tier-1 city waste fees above CNY 300 per tonne (USD 42 per tonne), make liner disposal a visible operating cost. India, Indonesia, Vietnam, Japan, South Korea, and Australia are therefore contributing to a regional growth pattern that combines parcel expansion with more automated labeling practices.
North America remained a mature region in the linerless labels market, where adoption was driven more by retailer scorecards, logistics throughput, and operating efficiency than by broad federal packaging mandates. The United States Census Bureau’s 2025 e-commerce sales estimate shows why parcel intensity remains a durable demand driver for linerless shipping formats. Lowry Solutions also noted in 2025 that linerless formats align well with warehouse, logistics, and quick-service restaurant labeling use cases that depend on efficient print-and-apply operations.[3]Lowry Solutions, “Linerless Labels, Benefits, Applications and How They Work,” Lowry Solutions, lowrysolutions.com South America remained earlier in its adoption curve, with Brazil and Argentina standing out as the main growth markets, while the Middle East and Africa represented a longer-duration opportunity tied to logistics modernization and cold-chain investment.

Competitive Landscape
The linerless labels market operates with moderate concentration, with Avery Dennison and UPM Raflatac holding structural advantages through scale, materials depth, and strong links between labeling products and broader enterprise workflows. Avery Dennison is expected to strengthen its position in April 2026 through a USD 75 million investment in Wiliot, linking its inlay design and manufacturing capabilities more closely to battery-free connected product intelligence. UPM Adhesive Materials is expected to expand its competitive reach in May 2026 with ProCycle solutions designed to improve packaging recyclability and in June 2026 with specialized adhesive launches for demanding label applications. These moves indicate that competition in the linerless labels market is no longer centered only on label supply, as suppliers also compete on recyclability fit, adhesive performance, and smart-label functionality.
Hardware-led competition is also becoming more visible in the linerless labels market. Zebra Technologies is expected to unveil its ZeroLiner Linerless Printing Solution at Automate 2026, combining linerless print-and-apply with machine vision and RFID to deliver an integrated workflow platform. SATO Corporation has also advanced the market through the use of NonSepa linerless labels at ASKUL’s Kanto Distribution Center and through environmental product declarations for selected linerless products. These examples indicate that equipment makers and auto-ID specialists now have greater room to compete directly with converter-led solution sets. This shift matters because the linerless labels market increasingly rewards companies that offer validated systems rather than standalone components.
A second pattern is emerging as strategic initiatives in the linerless labels market increasingly emphasize practical deployment rather than broad positioning statements. Avery Dennison is aligning RFID, data platforms, and food retail rollout activities to strengthen switching costs in enterprise accounts. UPM is integrating recyclable material portfolios with new adhesive families, enabling the company to serve both sustainability-led and regulated end uses from a stronger technical base. Meanwhile, Zebra and SATO indicate that the next phase of competition may arise from hardware, automation, and workflow integration rather than label stock alone. Consequently, the linerless labels market is moving toward a structure in which scale remains important, while validated smart-label systems and materials expertise carry greater competitive weight than before.
Linerless Labels Industry Leaders
R.R. Donnelley & Sons Company
Reflex Labels Ltd.
Avery Dennison Corporation
UPM Raflatac
SATO Europe GmbH
- *Disclaimer: Major Players sorted in no particular order

Recent Industry Developments
- June 2026: Zebra Technologies Corporation unveiled its ZeroLiner Linerless Printing Solution at Automate 2026 in Chicago. The system integrates in-line, fully automated linerless print-and-apply processes using machine vision and RFID technology for package and label validation, representing a hardware-layer entry into the linerless solutions market that challenges established converter-applicator partnerships.
- June 2026: UPM Adhesive Materials released the UPM PharmaSure, UPM Vetro, and UPM Endurance adhesive lines, purpose-built for demanding pharmaceutical, wine and spirits, and oil and industrial chemical label applications, respectively. The launch reflects the broader industry effort to extend high-performance linerless and self-adhesive solutions into regulated, challenging end-use environments where adhesive performance certification requirements have historically limited format migration.
- April 2026: Avery Dennison announced a strategic USD 75 million minority investment in Wiliot, a provider of battery-free Bluetooth Low Energy sensors. The company also became the preferred inlay design, manufacturing, and commercial partner for Wiliot’s physical AI platform. The partnership aims to accelerate the adoption of digital identities for physical items across retail, logistics, and food applications, leveraging Avery Dennison’s existing RFID manufacturing scale and its atma.io cloud platform.
- December 2025: DHL Supply Chain Germany deployed a HERMA InNo-Liner linerless system in combination with Cab print-and-apply hardware at its Nohra logistics center in Thuringia. The site processes approximately 750,000 labeled shipping cartons annually, DHL reported approximately 60% waste reduction and approximately 40% lower system cost versus conventional self-adhesive label systems, with the added benefit of a setup time under 1 minute per roll change.


Global Linerless Labels Market Report Scope
Linerless labels are a type of pressure-sensitive label that do not have a liner. They are made with a special release coating applied to the face of the label, which allows the labels to be wound onto a roll without the adhesive sticking to the label below. This release coating not only prevents them from sticking together but also creates a UV-, chemical-, and moisture-resistant barrier. The Linerless Labels Market Report is Segmented by Printing Technology (Digital, Flexographic, Gravure, and Other Printing Technologies), Facestock Material (Paper, Film, and Specialty and Recycled Substrates), Adhesive Type (Acrylic Adhesives, Hot-Melt Adhesives, Specialty Adhesive, and Other Adhesive Types), End-User Industry (Food, Beverage, Healthcare and Pharmaceuticals, Cosmetics and Personal Care, Household Chemicals, Logistics and E-commerce, and Other End-User Industries), and Geography (North America, South America, Europe, Asia-Pacific, and Middle East and Africa). The Market Forecasts are Provided in Terms of Value (USD).
| Digital (Inkjet and Thermal) |
| Flexographic |
| Gravure |
| Other Printing Technologies |
| Paper |
| Film (PP, PET, PE) |
| Specialty and Recycled Substrates |
| Acrylic Adhesives |
| Hot-Melt Adhesives |
| Specialty Adhesives |
| Other Adhesive Types |
| Food |
| Beverage |
| Healthcare and Pharmaceuticals |
| Cosmetics and Personal Care |
| Household Chemicals |
| Logistics and E-commerce |
| Other End-User Industries |
| North America | United States | |
| Canada | ||
| Mexico | ||
| South America | Brazil | |
| Argentina | ||
| Rest of South America | ||
| Europe | Germany | |
| United Kingdom | ||
| France | ||
| Italy | ||
| Rest of Europe | ||
| Asia-Pacific | China | |
| Japan | ||
| South Korea | ||
| Australia | ||
| India | ||
| Rest of Asia-Pacific | ||
| Middle East and Africa | Middle East | Saudi Arabia |
| United Arab Emirates | ||
| Turkey | ||
| Rest of Middle East | ||
| Africa | South Africa | |
| Egypt | ||
| Rest of Africa | ||
| By Printing Technology | Digital (Inkjet and Thermal) | ||
| Flexographic | |||
| Gravure | |||
| Other Printing Technologies | |||
| By Facestock Material | Paper | ||
| Film (PP, PET, PE) | |||
| Specialty and Recycled Substrates | |||
| By Adhesive Type | Acrylic Adhesives | ||
| Hot-Melt Adhesives | |||
| Specialty Adhesives | |||
| Other Adhesive Types | |||
| By End-User Industry | Food | ||
| Beverage | |||
| Healthcare and Pharmaceuticals | |||
| Cosmetics and Personal Care | |||
| Household Chemicals | |||
| Logistics and E-commerce | |||
| Other End-User Industries | |||
| By Geography | North America | United States | |
| Canada | |||
| Mexico | |||
| South America | Brazil | ||
| Argentina | |||
| Rest of South America | |||
| Europe | Germany | ||
| United Kingdom | |||
| France | |||
| Italy | |||
| Rest of Europe | |||
| Asia-Pacific | China | ||
| Japan | |||
| South Korea | |||
| Australia | |||
| India | |||
| Rest of Asia-Pacific | |||
| Middle East and Africa | Middle East | Saudi Arabia | |
| United Arab Emirates | |||
| Turkey | |||
| Rest of Middle East | |||
| Africa | South Africa | ||
| Egypt | |||
| Rest of Africa | |||


Key Questions Answered in the Report
How large will the linerless labels market be by 2031?
The linerless labels market is projected to reach USD 2.76 billion by 2031, rising from USD 2.15 billion in 2025 at a 4.26% CAGR over 2026-2031.
What is driving demand for linerless label solutions?
The main growth factors are tighter packaging waste rules, higher e-commerce parcel volumes, more automated logistics workflows, and increasing use of RFID-enabled labeling.
Which end-user segment leads demand today?
Food was the largest end-user segment in 2025 with a 28.46% share, supported by established use in meat, fish, poultry, and fresh packaged food labeling.
Which end-user segment is growing the fastest?
Logistics and e-commerce is the fastest-growing segment, with a projected 6.14% CAGR through 2031 as fulfillment centers adopt variable-length and high-speed print-and-apply labels.
Which region is leading adoption, and which one is growing the fastest?
Europe led in 2025 with a 38.82% share, while Asia-Pacific is projected to grow the fastest at a 6.04% CAGR through 2031.
What are the main barriers to wider adoption?
The biggest constraints are retrofit costs for legacy labeling lines and volatility in adhesive and release-coating inputs, both of which can delay conversion and pressure margins.
Page last updated on:


