Grapes Market Size and Share
Grapes Market Analysis by Mordor Intelligence
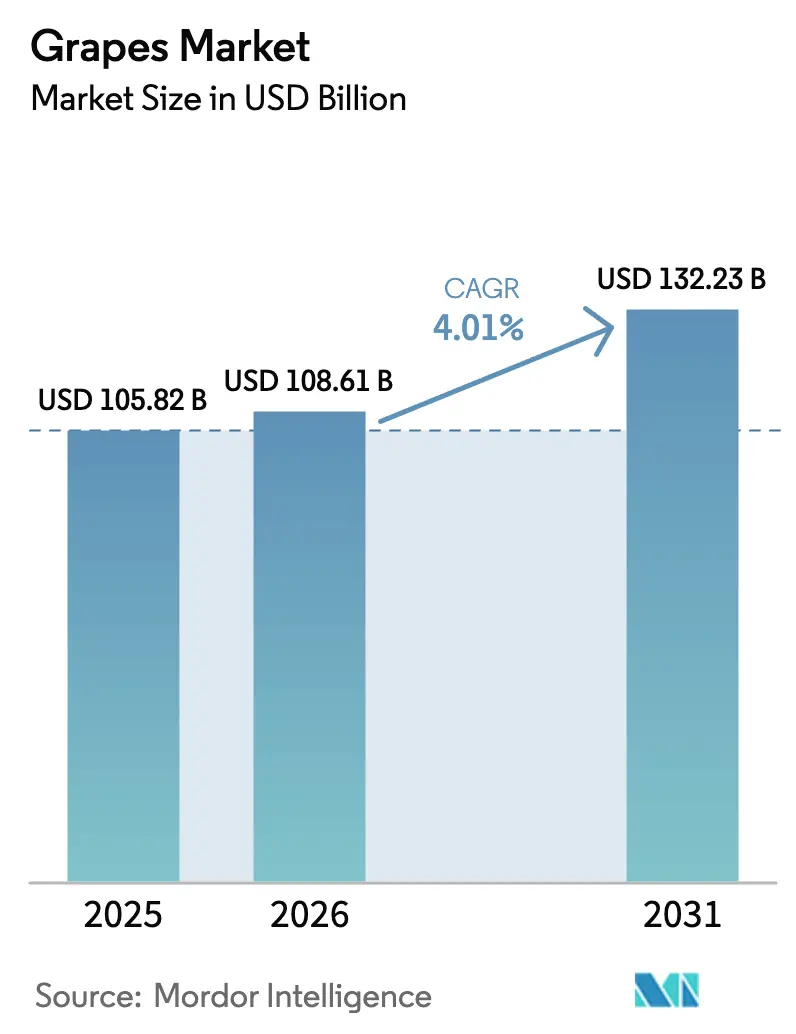
The grapes market size is projected to expand from USD 105.82 billion in 2025 and USD 108.61 billion in 2026 to USD 132.23 billion by 2031, registering a 4.01% CAGR between 2026 and 2031. Sustained growth reflects a pivot toward margin-rich premium seedless cultivars, rising health-driven demand for resveratrol and polyphenols, and accelerated logistics investment that lowers spoilage and broadens export windows. The Asia-Pacific region is led by China's scale and demand for high-value imports, while Africa recorded the highest regional CAGR, driven by South Africa, Egypt, and Kenya capitalizing on counter-seasonal market opportunities. Vertical integration is deepening in Chile, Peru, and California, where exporters deploy artificial-intelligence-enabled precision viticulture to offset labor scarcity and water caps. At the same time, cold-chain buildouts in Indonesia, India, and Vietnam compress seasonal price swings, extend shelf life, and unlock wider retail access. Processing channels raisins, juice concentrate, grape-seed oil, and nutraceutical extracts are capturing incremental value, especially for fruit that misses fresh-grade cosmetic standards yet carries high polyphenol content.
Key Report Takeaways
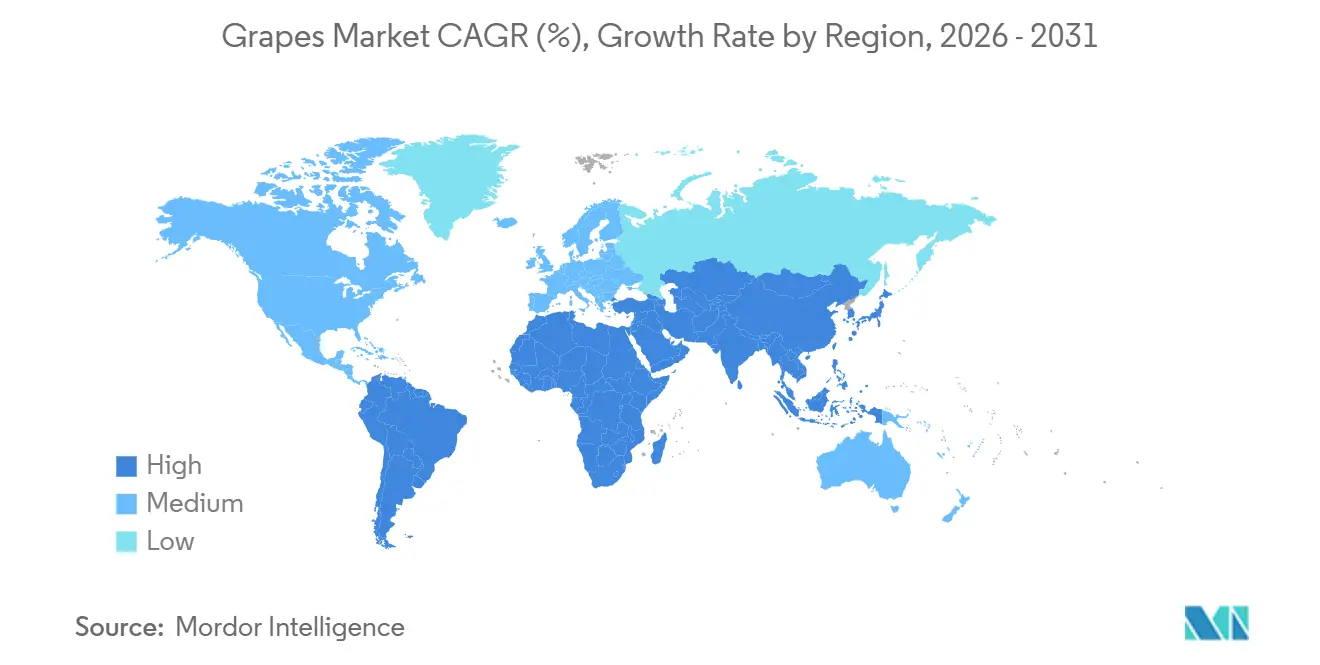
- By geography, Asia-Pacific accounted for 36.7% of the grapes market share in 2025, whereas Africa is projected to record the fastest expansion at a 5.0% CAGR to 2031.
Note: Market size and forecast figures in this report are generated using Mordor Intelligence’s proprietary estimation framework, updated with the latest available data and insights as of January 2026.
Global Grapes Market Trends and Insights
Drivers Impact Analysis
| Driver | (~) % Impact on CAGR Forecast | Geographic Relevance | Impact Timeline |
|---|---|---|---|
| Premiumization of table-grape varieties | +0.7% | North America, Europe, urban Asia-Pacific | Medium term (2-4 years) |
| Surge in functional grape-based nutraceuticals | +0.4% | Global, led by North America and Europe | Long term (≥ 4 years) |
| Expansion of cold-chain logistics in emerging economies | +0.6% | Asia-Pacific, Middle East, and Africa | Medium term (2-4 years) |
| Growth in organic-certified acreage price premiums | +0.5% | Europe, North America, and Australia | Long term (≥ 4 years) |
| Artificial intelligence-enabled precision viticulture adoption | +0.4% | North America, Europe, Australia, and Chile | Medium term (2-4 years) |
| Vertical-farming trials for high-density grapes | +0.1% | Japan, and Netherlands | Long term (≥ 4 years) |
| Source: Mordor Intelligence | |||
Premiumization of Table-Grape Varieties
Retailers across North America and Europe are dedicating more shelf space to proprietary cultivars that fetch 30-50% price premiums over legacy Thompson Seedless, driven by consumer pursuit of novel flavor profiles and longer shelf life. Sun World International's Autumncrisp brand has reached a significant milestone, surpassing USD 1 billion in global retail sales. This achievement was announced during the 2025 Specialty Foods Association Summer Fancy Foods Show, representing a notable accomplishment for a fresh produce variety. Grower conversion requires multi-year nursery lead times and higher establishment costs, yet returns justify investment for operations with controlled-atmosphere storage and direct-to-retail relationships. Expansion is concentrated in California, Chile, and Peru, where exporters align harvest calendars with Asian and Middle Eastern off-season demand. This dynamic is concentrating production among vertically integrated players that can manage licensing, post-harvest handling, and brand marketing, leaving commodity producers exposed to margin erosion.
Surge in Functional Grape-Based Nutraceuticals
Global resveratrol extract sales approached USD 90 million in 2024 and continue to exceed 10% annual growth as clinical evidence of cardiovascular benefits gains traction[1]Source: National Institutes of Health, “Resveratrol and Cardiovascular Health,” nih.gov. Grape-seed proanthocyanidin extracts are entering the cosmeceutical market to target skin elasticity and ultraviolet protection, while anthocyanin concentrates are replacing synthetic dyes in beverages as the European Union phases out azo colorants. Vineyard operators segregate high-polyphenol cultivars, such as Muscadine and Concord, for extraction, creating dual revenue streams that cushion volatility in the fresh market. Supercritical carbon dioxide extraction lines under construction in North America and Europe support pharmaceutical-grade purity, thereby raising entry barriers for small processors. The channel’s insensitivity to cosmetic defects enables growers to monetize fruit that would otherwise be discounted, thereby reinforcing overall profitability.
Growth in Organic-Certified Acreage Price Premiums
India is a significant global producer of grapes, with a total cultivation area of approximately 179,620 hectares in 2023-24. Maharashtra accounts for 63.76% of this area, followed by Karnataka at 31.37%. Although conventional farming dominates the industry, organic table grape production is expanding, emphasizing sustainable practices such as green manure and biopesticides[2]Source: Grapes, "Agricultural and Processed Food Products Export Development Authority (APEDA)," apeda.gov.in. Achieving organic certification requires a three-year transition period, during which yields typically decline by 15%-20% due to restrictions on chemical inputs. However, premium pricing compensates for the reduced yields, particularly for growers with diversified revenue streams. Australia and Chile are also expanding organic cultivation to meet demand from European and Japanese buyers, who prioritize low-residue produce. This trend reinforces a two-tier market structure, with certified organic growers focusing on securing premium shelf space, while conventional producers compete primarily on cost efficiency. Over time, the adoption of organic practices is projected to grow as carbon footprint disclosures become mandatory in developed markets.
Artificial Intelligence-Enabled Precision Viticulture Adoption
Sensor networks and satellite imagery guide irrigation scheduling and canopy management, reducing water use up to 25% and chemical inputs by 30% while safeguarding yield[3]Source: United States Department of Agriculture Agricultural Research Service, “Precision Viticulture and AI Applications,” ars.usda.gov. California start-ups such as Tule Technologies and Ceres Imaging covered more than 50,000 hectares with data-driven systems in 2024, helping vineyards comply with Sustainable Groundwater Management Act water quotas. Machine-learning algorithms forecast mildew pressure, cutting crop losses by up to 30%. Adoption skews to large operations that can amortize hardware and analytics across extensive hectares. Smaller vineyards join cooperative platforms, although full efficiency gains require multi-year data histories and technical skills. Precision tools also generate traceability datasets that meet retailer audit requirements, delivering an ancillary market-access benefit.
Restraints Impact Analysis
| Restraint | (~) % Impact on CAGR Forecast | Geographic Relevance | Impact Timeline |
|---|---|---|---|
| Escalating labor shortages in vineyards | −0.6% | North America, Australia, and Europe | Short term (≤ 2 years) |
| Stricter maximum-residue-level compliance | −0.4% | Global, acute for exporters to European Union and China | Medium term (2-4 years) |
| Water-scarcity induced irrigation caps | −0.5% | California, Chile, Australia, and Mediterranean Europe | Short term (≤ 2 years) |
| Tariff variability on inter-regional trade | −0.4% | Global, focused on United States-China and Australia-China corridors | Long term (≥ 4 years) |
| Source: Mordor Intelligence | |||
Escalating Labor Shortages in Vineyards
Seasonal labor availability in California’s Central Valley fell 18% between 2023 and 2025, prompting wage increases of about 25% yet still leaving unharvested acreage and quality losses[4]Source: United States Department of Agriculture Economic Research Service, “Farm Labor Trends,” ers.usda.gov. Manual picking remains indispensable for premium table grapes because mechanical harvesters bruise berries. Australia and Chile face parallel constraints as rural-to-urban migration and tighter visa rules shrink labor pools. Robotic harvesters equipped with computer vision emerge in wine-grape blocks, but commercial readiness for table grapes is several seasons away. The labor squeeze accelerates consolidation, as only larger enterprises can fund competitive pay, automated pruning equipment, and year-round employment that attracts workers. Smaller holdings often shift to less labor-intensive crops or exit the grapes market.
Tariff Variability on Inter-Regional Trade
China’s retaliatory duties on Australian table grapes diverted more than USD 300 million in exports to Southeast Asia and the Middle East, depressing prices in less developed retail channels[5]Source: Australian Bureau of Agricultural and Resource Economics and Sciences, “Agricultural Trade Data,” agriculture.gov.au. United States growers confront uncertainty over Section 301 tariff schedules that shape competitiveness in key Asian markets, while the European Union’s forthcoming carbon border adjustment will levy charges on imports from jurisdictions lacking equivalent carbon pricing. Exporters hedge by diversifying destinations and investing in traceability systems that document carbon footprints. These measures add cost and complexity, lengthening payback periods for vineyard establishment and post-harvest infrastructure. Policy swings complicate contractual planning and sustain price volatility in the global grapes market.
Geography Analysis
Asia-Pacific retained 36.7% of the global grape market share in 2025, as China harvested about 14.5 million metric tons while still importing USD 1.2 billion of premium seedless grapes to satisfy urban demand for varieties not grown domestically. India’s Nashik district exported 280,000 metric tons in the 2024-2025 season, capitalizing on new cold-storage capacity and tariff advantages in the United Arab Emirates and Southeast Asia. Japan and Australia represent mature, high-value markets where consumers pay USD 10-15 per kilogram for cultivars like Shine Muscat. Indonesia’s middle-class expansion and logistics upgrades further energize regional demand and reinforce the grapes market's leading role in Asia-Pacific.
Africa, projected to grow at a 5.0% CAGR through 2031, is the fastest-growing regional contributor. South Africa shipped more than 350,000 metric tons during the 2024-2025 window, leveraging counter-seasonal alignment with European Union and Middle Eastern demand. Egypt is expanding acreage in the Nile Delta and New Valley, where low labor costs and proximity to Europe foster a competitive advantage. Kenya attracts foreign investors seeking to diversify supply chains and mitigate climate risk, though infrastructure gaps continue to hamper volumes. Rising domestic consumption in Nigeria and Ethiopia complements export growth, widening regional market depth despite logistical bottlenecks.
North America and Europe show modest volume growth, yet premiumization, organic certification, and local provenance trends lift value. California produced around 1.1 million metric tons in 2024 but faces acreage contraction given water scarcity and labor costs. European output is concentrated in Italy, Spain, and France, where compliance with Farm-to-Fork sustainability targets accelerates the adoption of integrated pest management and organic conversion. Consumers increasingly demand locally grown produce with reduced food miles, creating niche opportunities for small vineyards that employ direct-to-consumer channels. South America, led by Chile and Peru, remains a cornerstone supplier to counter-seasonal markets, although water and wage inflation erode margins, prompting wider adoption of precision irrigation and mechanical thinning to preserve competitiveness.


Competitive Landscape
Vertically integrated multinationals such as Dole, Del Monte, and Perfection Fresh leverage cold-chain fleets, varietal licensing agreements, and multi-year retail contracts to secure shelf space across continents. These firms invest heavily in sensor networks, electronic traceability, and sustainability audits that smaller players struggle to afford. Intellectual-property-protected cultivars like Cotton Candy and Scarlet Crush generate royalty streams, allowing breeders and licensees to earn margins beyond commodity price cycles.
Technology adoption is the distinguishing factor between leaders and laggards. Artificial-intelligence-driven irrigation and disease-prediction platforms cut water and chemical costs by up to 30%, yielding margin gains of USD 500-USD 1,000 per hectare in high-cost regions. Cooperative models help smallholders access these tools, yet full benefit realization requires long-term data capture and technical staffing. Emerging disruptors include biotechnology start-ups pursuing de novo disease-resistant genetics via CRISPR editing, although regulatory approvals and consumer perception weigh on commercialization timelines. Controlled-environment agriculture players pilot urban vertical farms, but commercial viability awaits cost parity with field production.
Sustainability mandates further shape competition. Major grocery chains now require carbon footprint disclosure and third-party certifications such as GlobalG.A.P. or Rainforest Alliance. Compliance raises overhead and pushes consolidation as operations lacking scale exit or merge. Patent filings for grape breeding rose more than 30% since 2023, underscoring a tilt toward innovation and branding over pure volume. As a result, the grapes market is gradually concentrating among exporters able to navigate regulatory complexity, fund research, and operate globally spanning logistics.
Recent Industry Developments
- December 2025: Sun World International's AUTUMNCRISP seedless grapes achieved significant success in Denmark, leading to a 90% sales increase for Salling Group and boosting the overall grape category by 25% through an influencer-driven marketing campaign. These large, crisp, and sweet green grapes, positioned as a premium branded product, garnered over 1.5 million social media impressions, highlighting strong consumer demand and reshaping the retail grape category.
- November 2025: BASF SE introduced xarvio FIELD MANAGER for Grapes, a digital tool designed for wine grape growers in France, Spain, and Turkey. This tool provides access to established models for plant health, pest and disease management, fertilization, and irrigation, aiming to enhance crop health, optimize resource use, and minimize environmental impact.
- October 2025: Peru, Mexico, and Chile have launched the Global Grape Group (GGG) at the Global Produce and Floral Show in Anaheim. This alliance seeks to increase global consumption of table grapes, addressing a sustainability challenge where supply has significantly exceeded demand. Collectively, they represent a coordinated effort to stabilize the market.
- April 2025: The ICAR-National Research Centre for Grapes (ICAR-NRCG) has signed a Memorandum of Understanding (MoU) with the Department of Horticulture, Kashmir, to promote grape cultivation in non-traditional areas. This initiative aims to diversify agricultural practices away from traditional apple farming. Successful field trials in Ganderbal and Baramulla have demonstrated over 90% plant establishment, highlighting the potential to improve regional agricultural productivity.


Global Grapes Market Report Scope
Grapes are either consumed fresh as table grapes or processed into different forms, such as wine, raisins (dried grapes), jams, jellies, and juices. For this report, the market is limited to freshly traded grapes used for table or processing purposes. The Grapes Market Report is Segmented by Geography (North America, Europe, Asia-Pacific, South America, the Middle East, and Africa). The Report Includes Production Analysis (Volume), Consumption Analysis (Value and Volume), Export Analysis (Value and Volume), Import Analysis (Value and Volume), Wholesale Price Trend Analysis and Forecast, and More. The Market Forecasts are Provided in Terms of Value (USD) and Volume (Metric Tons).
| North America | United States | Production Analysis (Area Harvested, Yield, and Production Volume) |
| Consumption Analysis (Consumption Value and Volume) | ||
| Import Market Analysis (Import Value, Volume, and Key Supplying Markets) | ||
| Export Market Analysis (Export Value, Volume, and Key Destination Markets) | ||
| Wholesale Price Trend Analysis and Forecast | ||
| Regulatory Framework | ||
| List of Key Players | ||
| Logistics and Infrastructure | ||
| Seasonality Analysis | ||
| Mexico | Production Analysis (Area Harvested, Yield, and Production Volume) | |
| Consumption Analysis (Consumption Value and Volume) | ||
| Import Market Analysis (Import Value, Volume, and Key Supplying Markets) | ||
| Export Market Analysis (Export Value, Volume, and Key Destination Markets) | ||
| Wholesale Price Trend Analysis and Forecast | ||
| Regulatory Framework | ||
| List of Key Players | ||
| Logistics and Infrastructure | ||
| Seasonality Analysis | ||
| Canada | Production Analysis (Area Harvested, Yield, and Production Volume) | |
| Consumption Analysis (Consumption Value and Volume) | ||
| Import Market Analysis (Import Value, Volume, and Key Supplying Markets) | ||
| Export Market Analysis (Export Value, Volume, and Key Destination Markets) | ||
| Wholesale Price Trend Analysis and Forecast | ||
| Regulatory Framework | ||
| List of Key Players | ||
| Logistics and Infrastructure | ||
| Seasonality Analysis | ||
| Europe | Germany | Production Analysis (Area Harvested, Yield, and Production Volume) |
| Consumption Analysis (Consumption Value and Volume) | ||
| Import Market Analysis (Import Value, Volume, and Key Supplying Markets) | ||
| Export Market Analysis (Export Value, Volume, and Key Destination Markets) | ||
| Wholesale Price Trend Analysis and Forecast | ||
| Regulatory Framework | ||
| List of Key Players | ||
| Logistics and Infrastructure | ||
| Seasonality Analysis | ||
| United Kingdom | Production Analysis (Area Harvested, Yield, and Production Volume) | |
| Consumption Analysis (Consumption Value and Volume) | ||
| Import Market Analysis (Import Value, Volume, and Key Supplying Markets) | ||
| Export Market Analysis (Export Value, Volume, and Key Destination Markets) | ||
| Wholesale Price Trend Analysis and Forecast | ||
| Regulatory Framework | ||
| List of Key Players | ||
| Logistics and Infrastructure | ||
| Seasonality Analysis | ||
| France | Production Analysis (Area Harvested, Yield, and Production Volume) | |
| Consumption Analysis (Consumption Value and Volume) | ||
| Import Market Analysis (Import Value, Volume, and Key Supplying Markets) | ||
| Export Market Analysis (Export Value, Volume, and Key Destination Markets) | ||
| Wholesale Price Trend Analysis and Forecast | ||
| Regulatory Framework | ||
| List of Key Players | ||
| Logistics and Infrastructure | ||
| Seasonality Analysis | ||
| Netherlands | Production Analysis (Area Harvested, Yield, and Production Volume) | |
| Consumption Analysis (Consumption Value and Volume) | ||
| Import Market Analysis (Import Value, Volume, and Key Supplying Markets) | ||
| Export Market Analysis (Export Value, Volume, and Key Destination Markets) | ||
| Wholesale Price Trend Analysis and Forecast | ||
| Regulatory Framework | ||
| List of Key Players | ||
| Logistics and Infrastructure | ||
| Seasonality Analysis | ||
| Italy | Production Analysis (Area Harvested, Yield, and Production Volume) | |
| Consumption Analysis (Consumption Value and Volume) | ||
| Import Market Analysis (Import Value, Volume, and Key Supplying Markets) | ||
| Export Market Analysis (Export Value, Volume, and Key Destination Markets) | ||
| Wholesale Price Trend Analysis and Forecast | ||
| Regulatory Framework | ||
| List of Key Players | ||
| Logistics and Infrastructure | ||
| Seasonality Analysis | ||
| Asia-Pacific | China | Production Analysis (Area Harvested, Yield, and Production Volume) |
| Consumption Analysis (Consumption Value and Volume) | ||
| Import Market Analysis (Import Value, Volume, and Key Supplying Markets) | ||
| Export Market Analysis (Export Value, Volume, and Key Destination Markets) | ||
| Wholesale Price Trend Analysis and Forecast | ||
| Regulatory Framework | ||
| List of Key Players | ||
| Logistics and Infrastructure | ||
| Seasonality Analysis | ||
| India | Production Analysis (Area Harvested, Yield, and Production Volume) | |
| Consumption Analysis (Consumption Value and Volume) | ||
| Import Market Analysis (Import Value, Volume, and Key Supplying Markets) | ||
| Export Market Analysis (Export Value, Volume, and Key Destination Markets) | ||
| Wholesale Price Trend Analysis and Forecast | ||
| Regulatory Framework | ||
| List of Key Players | ||
| Logistics and Infrastructure | ||
| Seasonality Analysis | ||
| Japan | Production Analysis (Area Harvested, Yield, and Production Volume) | |
| Consumption Analysis (Consumption Value and Volume) | ||
| Import Market Analysis (Import Value, Volume, and Key Supplying Markets) | ||
| Export Market Analysis (Export Value, Volume, and Key Destination Markets) | ||
| Wholesale Price Trend Analysis and Forecast | ||
| Regulatory Framework | ||
| List of Key Players | ||
| Logistics and Infrastructure | ||
| Seasonality Analysis | ||
| Australia | Production Analysis (Area Harvested, Yield, and Production Volume) | |
| Consumption Analysis (Consumption Value and Volume) | ||
| Import Market Analysis (Import Value, Volume, and Key Supplying Markets) | ||
| Export Market Analysis (Export Value, Volume, and Key Destination Markets) | ||
| Wholesale Price Trend Analysis and Forecast | ||
| Regulatory Framework | ||
| List of Key Players | ||
| Logistics and Infrastructure | ||
| Seasonality Analysis | ||
| Indonesia | Production Analysis (Area Harvested, Yield, and Production Volume) | |
| Consumption Analysis (Consumption Value and Volume) | ||
| Import Market Analysis (Import Value, Volume, and Key Supplying Markets) | ||
| Export Market Analysis (Export Value, Volume, and Key Destination Markets) | ||
| Wholesale Price Trend Analysis and Forecast | ||
| Regulatory Framework | ||
| List of Key Players | ||
| Logistics and Infrastructure | ||
| Seasonality Analysis | ||
| South America | Brazil | Production Analysis (Area Harvested, Yield, and Production Volume) |
| Consumption Analysis (Consumption Value and Volume) | ||
| Import Market Analysis (Import Value, Volume, and Key Supplying Markets) | ||
| Export Market Analysis (Export Value, Volume, and Key Destination Markets) | ||
| Wholesale Price Trend Analysis and Forecast | ||
| Regulatory Framework | ||
| List of Key Players | ||
| Logistics and Infrastructure | ||
| Seasonality Analysis | ||
| Argentina | Production Analysis (Area Harvested, Yield, and Production Volume) | |
| Consumption Analysis (Consumption Value and Volume) | ||
| Import Market Analysis (Import Value, Volume, and Key Supplying Markets) | ||
| Export Market Analysis (Export Value, Volume, and Key Destination Markets) | ||
| Wholesale Price Trend Analysis and Forecast | ||
| Regulatory Framework | ||
| List of Key Players | ||
| Logistics and Infrastructure | ||
| Seasonality Analysis | ||
| Middle East | Turkey | Production Analysis (Area Harvested, Yield, and Production Volume) |
| Consumption Analysis (Consumption Value and Volume) | ||
| Import Market Analysis (Import Value, Volume, and Key Supplying Markets) | ||
| Export Market Analysis (Export Value, Volume, and Key Destination Markets) | ||
| Wholesale Price Trend Analysis and Forecast | ||
| Regulatory Framework | ||
| List of Key Players | ||
| Logistics and Infrastructure | ||
| Seasonality Analysis | ||
| United Arab Emirates | Production Analysis (Area Harvested, Yield, and Production Volume) | |
| Consumption Analysis (Consumption Value and Volume) | ||
| Import Market Analysis (Import Value, Volume, and Key Supplying Markets) | ||
| Export Market Analysis (Export Value, Volume, and Key Destination Markets) | ||
| Wholesale Price Trend Analysis and Forecast | ||
| Regulatory Framework | ||
| List of Key Players | ||
| Logistics and Infrastructure | ||
| Seasonality Analysis | ||
| Saudi Arabia | Production Analysis (Area Harvested, Yield, and Production Volume) | |
| Consumption Analysis (Consumption Value and Volume) | ||
| Import Market Analysis (Import Value, Volume, and Key Supplying Markets) | ||
| Export Market Analysis (Export Value, Volume, and Key Destination Markets) | ||
| Wholesale Price Trend Analysis and Forecast | ||
| Regulatory Framework | ||
| List of Key Players | ||
| Logistics and Infrastructure | ||
| Seasonality Analysis | ||
| Africa | Egypt | Production Analysis (Area Harvested, Yield, and Production Volume) |
| Consumption Analysis (Consumption Value and Volume) | ||
| Import Market Analysis (Import Value, Volume, and Key Supplying Markets) | ||
| Export Market Analysis (Export Value, Volume, and Key Destination Markets) | ||
| Wholesale Price Trend Analysis and Forecast | ||
| Regulatory Framework | ||
| List of Key Players | ||
| Logistics and Infrastructure | ||
| Seasonality Analysis | ||
| Kenya | Production Analysis (Area Harvested, Yield, and Production Volume) | |
| Consumption Analysis (Consumption Value and Volume) | ||
| Import Market Analysis (Import Value, Volume, and Key Supplying Markets) | ||
| Export Market Analysis (Export Value, Volume, and Key Destination Markets) | ||
| Wholesale Price Trend Analysis and Forecast | ||
| Regulatory Framework | ||
| List of Key Players | ||
| Logistics and Infrastructure | ||
| Seasonality Analysis | ||
| South Africa | Production Analysis (Area Harvested, Yield, and Production Volume) | |
| Consumption Analysis (Consumption Value and Volume) | ||
| Import Market Analysis (Import Value, Volume, and Key Supplying Markets) | ||
| Export Market Analysis (Export Value, Volume, and Key Destination Markets) | ||
| Wholesale Price Trend Analysis and Forecast | ||
| Regulatory Framework | ||
| List of Key Players | ||
| Logistics and Infrastructure | ||
| Seasonality Analysis | ||
| By Geography | North America | United States | Production Analysis (Area Harvested, Yield, and Production Volume) |
| Consumption Analysis (Consumption Value and Volume) | |||
| Import Market Analysis (Import Value, Volume, and Key Supplying Markets) | |||
| Export Market Analysis (Export Value, Volume, and Key Destination Markets) | |||
| Wholesale Price Trend Analysis and Forecast | |||
| Regulatory Framework | |||
| List of Key Players | |||
| Logistics and Infrastructure | |||
| Seasonality Analysis | |||
| Mexico | Production Analysis (Area Harvested, Yield, and Production Volume) | ||
| Consumption Analysis (Consumption Value and Volume) | |||
| Import Market Analysis (Import Value, Volume, and Key Supplying Markets) | |||
| Export Market Analysis (Export Value, Volume, and Key Destination Markets) | |||
| Wholesale Price Trend Analysis and Forecast | |||
| Regulatory Framework | |||
| List of Key Players | |||
| Logistics and Infrastructure | |||
| Seasonality Analysis | |||
| Canada | Production Analysis (Area Harvested, Yield, and Production Volume) | ||
| Consumption Analysis (Consumption Value and Volume) | |||
| Import Market Analysis (Import Value, Volume, and Key Supplying Markets) | |||
| Export Market Analysis (Export Value, Volume, and Key Destination Markets) | |||
| Wholesale Price Trend Analysis and Forecast | |||
| Regulatory Framework | |||
| List of Key Players | |||
| Logistics and Infrastructure | |||
| Seasonality Analysis | |||
| Europe | Germany | Production Analysis (Area Harvested, Yield, and Production Volume) | |
| Consumption Analysis (Consumption Value and Volume) | |||
| Import Market Analysis (Import Value, Volume, and Key Supplying Markets) | |||
| Export Market Analysis (Export Value, Volume, and Key Destination Markets) | |||
| Wholesale Price Trend Analysis and Forecast | |||
| Regulatory Framework | |||
| List of Key Players | |||
| Logistics and Infrastructure | |||
| Seasonality Analysis | |||
| United Kingdom | Production Analysis (Area Harvested, Yield, and Production Volume) | ||
| Consumption Analysis (Consumption Value and Volume) | |||
| Import Market Analysis (Import Value, Volume, and Key Supplying Markets) | |||
| Export Market Analysis (Export Value, Volume, and Key Destination Markets) | |||
| Wholesale Price Trend Analysis and Forecast | |||
| Regulatory Framework | |||
| List of Key Players | |||
| Logistics and Infrastructure | |||
| Seasonality Analysis | |||
| France | Production Analysis (Area Harvested, Yield, and Production Volume) | ||
| Consumption Analysis (Consumption Value and Volume) | |||
| Import Market Analysis (Import Value, Volume, and Key Supplying Markets) | |||
| Export Market Analysis (Export Value, Volume, and Key Destination Markets) | |||
| Wholesale Price Trend Analysis and Forecast | |||
| Regulatory Framework | |||
| List of Key Players | |||
| Logistics and Infrastructure | |||
| Seasonality Analysis | |||
| Netherlands | Production Analysis (Area Harvested, Yield, and Production Volume) | ||
| Consumption Analysis (Consumption Value and Volume) | |||
| Import Market Analysis (Import Value, Volume, and Key Supplying Markets) | |||
| Export Market Analysis (Export Value, Volume, and Key Destination Markets) | |||
| Wholesale Price Trend Analysis and Forecast | |||
| Regulatory Framework | |||
| List of Key Players | |||
| Logistics and Infrastructure | |||
| Seasonality Analysis | |||
| Italy | Production Analysis (Area Harvested, Yield, and Production Volume) | ||
| Consumption Analysis (Consumption Value and Volume) | |||
| Import Market Analysis (Import Value, Volume, and Key Supplying Markets) | |||
| Export Market Analysis (Export Value, Volume, and Key Destination Markets) | |||
| Wholesale Price Trend Analysis and Forecast | |||
| Regulatory Framework | |||
| List of Key Players | |||
| Logistics and Infrastructure | |||
| Seasonality Analysis | |||
| Asia-Pacific | China | Production Analysis (Area Harvested, Yield, and Production Volume) | |
| Consumption Analysis (Consumption Value and Volume) | |||
| Import Market Analysis (Import Value, Volume, and Key Supplying Markets) | |||
| Export Market Analysis (Export Value, Volume, and Key Destination Markets) | |||
| Wholesale Price Trend Analysis and Forecast | |||
| Regulatory Framework | |||
| List of Key Players | |||
| Logistics and Infrastructure | |||
| Seasonality Analysis | |||
| India | Production Analysis (Area Harvested, Yield, and Production Volume) | ||
| Consumption Analysis (Consumption Value and Volume) | |||
| Import Market Analysis (Import Value, Volume, and Key Supplying Markets) | |||
| Export Market Analysis (Export Value, Volume, and Key Destination Markets) | |||
| Wholesale Price Trend Analysis and Forecast | |||
| Regulatory Framework | |||
| List of Key Players | |||
| Logistics and Infrastructure | |||
| Seasonality Analysis | |||
| Japan | Production Analysis (Area Harvested, Yield, and Production Volume) | ||
| Consumption Analysis (Consumption Value and Volume) | |||
| Import Market Analysis (Import Value, Volume, and Key Supplying Markets) | |||
| Export Market Analysis (Export Value, Volume, and Key Destination Markets) | |||
| Wholesale Price Trend Analysis and Forecast | |||
| Regulatory Framework | |||
| List of Key Players | |||
| Logistics and Infrastructure | |||
| Seasonality Analysis | |||
| Australia | Production Analysis (Area Harvested, Yield, and Production Volume) | ||
| Consumption Analysis (Consumption Value and Volume) | |||
| Import Market Analysis (Import Value, Volume, and Key Supplying Markets) | |||
| Export Market Analysis (Export Value, Volume, and Key Destination Markets) | |||
| Wholesale Price Trend Analysis and Forecast | |||
| Regulatory Framework | |||
| List of Key Players | |||
| Logistics and Infrastructure | |||
| Seasonality Analysis | |||
| Indonesia | Production Analysis (Area Harvested, Yield, and Production Volume) | ||
| Consumption Analysis (Consumption Value and Volume) | |||
| Import Market Analysis (Import Value, Volume, and Key Supplying Markets) | |||
| Export Market Analysis (Export Value, Volume, and Key Destination Markets) | |||
| Wholesale Price Trend Analysis and Forecast | |||
| Regulatory Framework | |||
| List of Key Players | |||
| Logistics and Infrastructure | |||
| Seasonality Analysis | |||
| South America | Brazil | Production Analysis (Area Harvested, Yield, and Production Volume) | |
| Consumption Analysis (Consumption Value and Volume) | |||
| Import Market Analysis (Import Value, Volume, and Key Supplying Markets) | |||
| Export Market Analysis (Export Value, Volume, and Key Destination Markets) | |||
| Wholesale Price Trend Analysis and Forecast | |||
| Regulatory Framework | |||
| List of Key Players | |||
| Logistics and Infrastructure | |||
| Seasonality Analysis | |||
| Argentina | Production Analysis (Area Harvested, Yield, and Production Volume) | ||
| Consumption Analysis (Consumption Value and Volume) | |||
| Import Market Analysis (Import Value, Volume, and Key Supplying Markets) | |||
| Export Market Analysis (Export Value, Volume, and Key Destination Markets) | |||
| Wholesale Price Trend Analysis and Forecast | |||
| Regulatory Framework | |||
| List of Key Players | |||
| Logistics and Infrastructure | |||
| Seasonality Analysis | |||
| Middle East | Turkey | Production Analysis (Area Harvested, Yield, and Production Volume) | |
| Consumption Analysis (Consumption Value and Volume) | |||
| Import Market Analysis (Import Value, Volume, and Key Supplying Markets) | |||
| Export Market Analysis (Export Value, Volume, and Key Destination Markets) | |||
| Wholesale Price Trend Analysis and Forecast | |||
| Regulatory Framework | |||
| List of Key Players | |||
| Logistics and Infrastructure | |||
| Seasonality Analysis | |||
| United Arab Emirates | Production Analysis (Area Harvested, Yield, and Production Volume) | ||
| Consumption Analysis (Consumption Value and Volume) | |||
| Import Market Analysis (Import Value, Volume, and Key Supplying Markets) | |||
| Export Market Analysis (Export Value, Volume, and Key Destination Markets) | |||
| Wholesale Price Trend Analysis and Forecast | |||
| Regulatory Framework | |||
| List of Key Players | |||
| Logistics and Infrastructure | |||
| Seasonality Analysis | |||
| Saudi Arabia | Production Analysis (Area Harvested, Yield, and Production Volume) | ||
| Consumption Analysis (Consumption Value and Volume) | |||
| Import Market Analysis (Import Value, Volume, and Key Supplying Markets) | |||
| Export Market Analysis (Export Value, Volume, and Key Destination Markets) | |||
| Wholesale Price Trend Analysis and Forecast | |||
| Regulatory Framework | |||
| List of Key Players | |||
| Logistics and Infrastructure | |||
| Seasonality Analysis | |||
| Africa | Egypt | Production Analysis (Area Harvested, Yield, and Production Volume) | |
| Consumption Analysis (Consumption Value and Volume) | |||
| Import Market Analysis (Import Value, Volume, and Key Supplying Markets) | |||
| Export Market Analysis (Export Value, Volume, and Key Destination Markets) | |||
| Wholesale Price Trend Analysis and Forecast | |||
| Regulatory Framework | |||
| List of Key Players | |||
| Logistics and Infrastructure | |||
| Seasonality Analysis | |||
| Kenya | Production Analysis (Area Harvested, Yield, and Production Volume) | ||
| Consumption Analysis (Consumption Value and Volume) | |||
| Import Market Analysis (Import Value, Volume, and Key Supplying Markets) | |||
| Export Market Analysis (Export Value, Volume, and Key Destination Markets) | |||
| Wholesale Price Trend Analysis and Forecast | |||
| Regulatory Framework | |||
| List of Key Players | |||
| Logistics and Infrastructure | |||
| Seasonality Analysis | |||
| South Africa | Production Analysis (Area Harvested, Yield, and Production Volume) | ||
| Consumption Analysis (Consumption Value and Volume) | |||
| Import Market Analysis (Import Value, Volume, and Key Supplying Markets) | |||
| Export Market Analysis (Export Value, Volume, and Key Destination Markets) | |||
| Wholesale Price Trend Analysis and Forecast | |||
| Regulatory Framework | |||
| List of Key Players | |||
| Logistics and Infrastructure | |||
| Seasonality Analysis | |||


Key Questions Answered in the Report
What is the projected value of the grapes market by 2031?
The grapes market is forecast to reach USD 132.23 billion by 2031, reflecting a 4.01% compound annual growth rate.
Which region currently holds the largest share in global grape sales?
Asia-Pacific accounts for 36.7% of global value, driven by China’s scale and growing imports of premium seedless varieties.
How are labor shortages affecting grape production?
Declining seasonal labor availability in major producing countries raises wage costs and accelerates mechanization and consolidation among large vineyards.
What technologies are vineyards adopting to reduce water and chemical use?
Artificial-intelligence-enabled precision viticulture leverages sensor networks and satellite imagery to optimize irrigation and targeted fungicide application, cutting inputs up to 30%.
Why are premium seedless cultivars important to retailers?
Proprietary varieties such as Cotton Candy deliver distinctive flavors and longer shelf life, allowing supermarkets to charge 30%-50% price premiums over conventional grapes.
Page last updated on:


