
Market Overview
| Study Period | 2021 - 2031 |
|---|---|
| Market Size (2026) | USD 2.17 Billion |
| Market Size (2031) | USD 2.80 Billion |
| Growth Rate (2026 - 2031) | 5.23 % |
| Fastest Growing Market | Asia Pacific |
| Largest Market | North America |
| Market Concentration | Medium |
Major Players
*Disclaimer: Major Players sorted in no particular order Image © Mordor Intelligence. Reuse requires attribution under CC BY 4.0. |
|
Surge Arrester Market Analysis by Mordor Intelligence
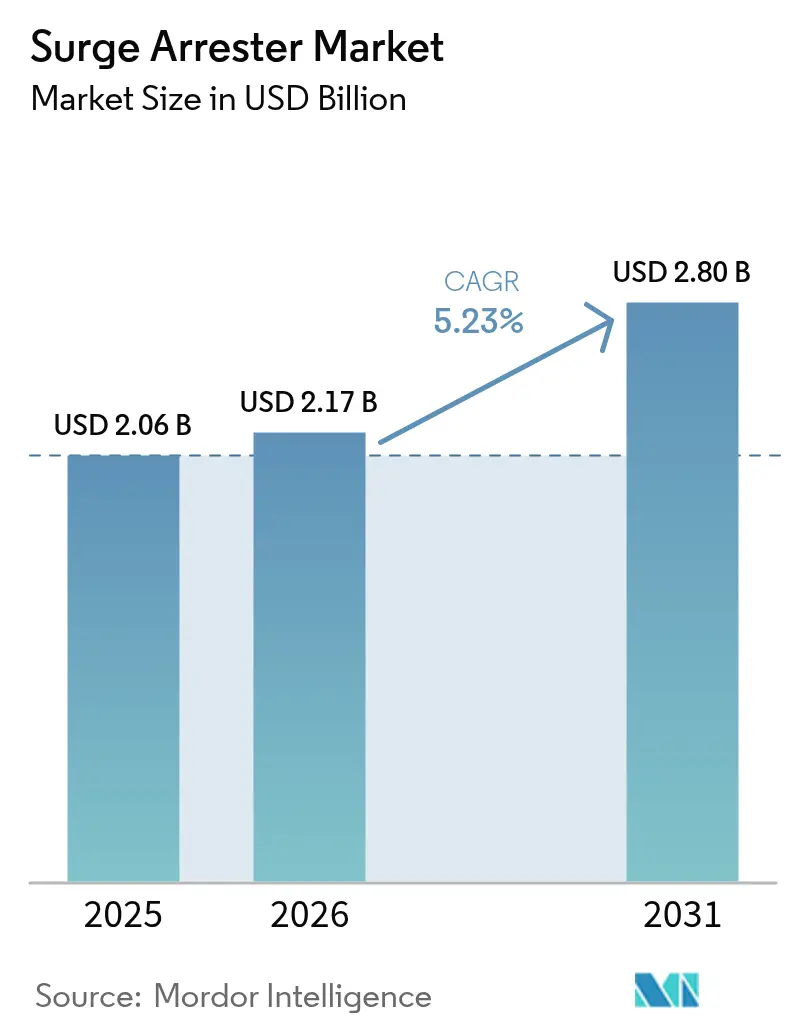
The Surge Arrester market size is expected to grow from USD 2.06 billion in 2025 to USD 2.17 billion in 2026 and is forecast to reach USD 2.8 billion by 2031 at 5.23% CAGR over 2026-2031.
Rising grid modernization investments, aggressive renewable integration, and stricter reliability targets are keeping the Global surge arrester market on a firm expansion path. Digitization trends now require arresters with built-in health monitoring, while supply-chain resilience remains a top-level priority following recent price swings of metal-oxide varistors. Utilities in North America and Europe are adopting digital twin models to optimize replacement cycles, whereas utilities in the Asia-Pacific region are pushing extra- and ultra-high-voltage deployments that stretch product performance envelopes. Competitive moves center on product differentiation, higher energy ratings, compact footprints, and IoT connectivity, yet OEMs must also counter the rising tide of counterfeit devices entering price-sensitive economies.
Key Report Takeaways
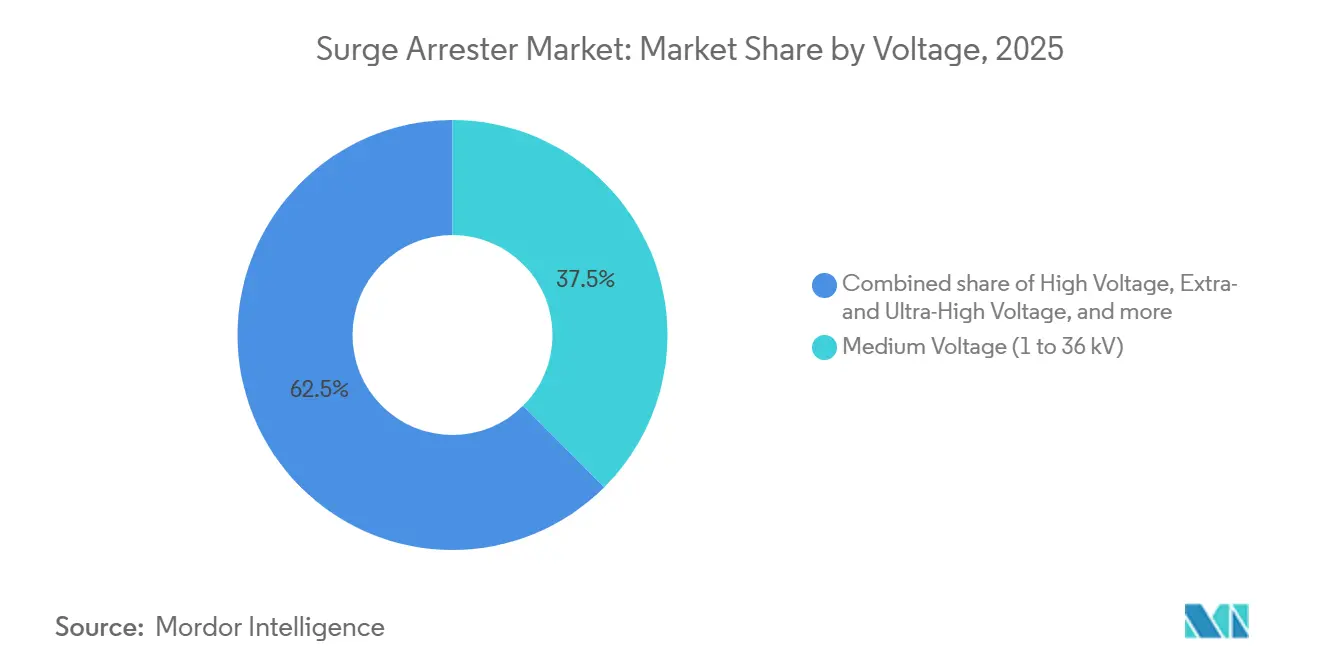
- By voltage rating, medium-voltage arresters held a 37.52% market share of the surge arrester market in 2025. Extra- and ultra-high-voltage arresters are projected to expand at a 6.74% CAGR between 2026-2031.
- By product type, station-class units accounted for a 41.95% revenue share of the surge arrester market size in 2025. Line arresters represent the fastest-growing product category, advancing at a 7.18% CAGR through 2031.
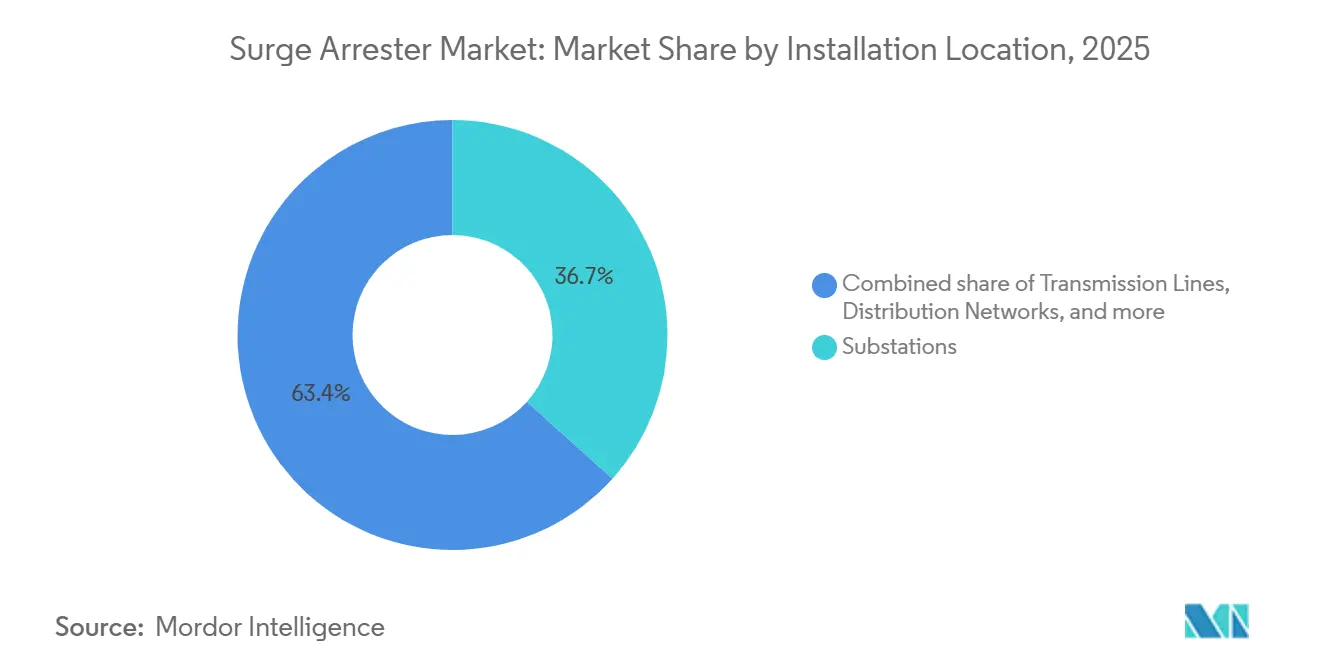
- By installation location, substations accounted for 36.65% of the surge arrester market size in 2025, whereas transmission lines are expected to expand at a 6.92% CAGR.
- By application, the utilities segment captured 53.35% of the surge arrester market size in 2025, while the residential segment is projected to grow at a 6.12% CAGR.
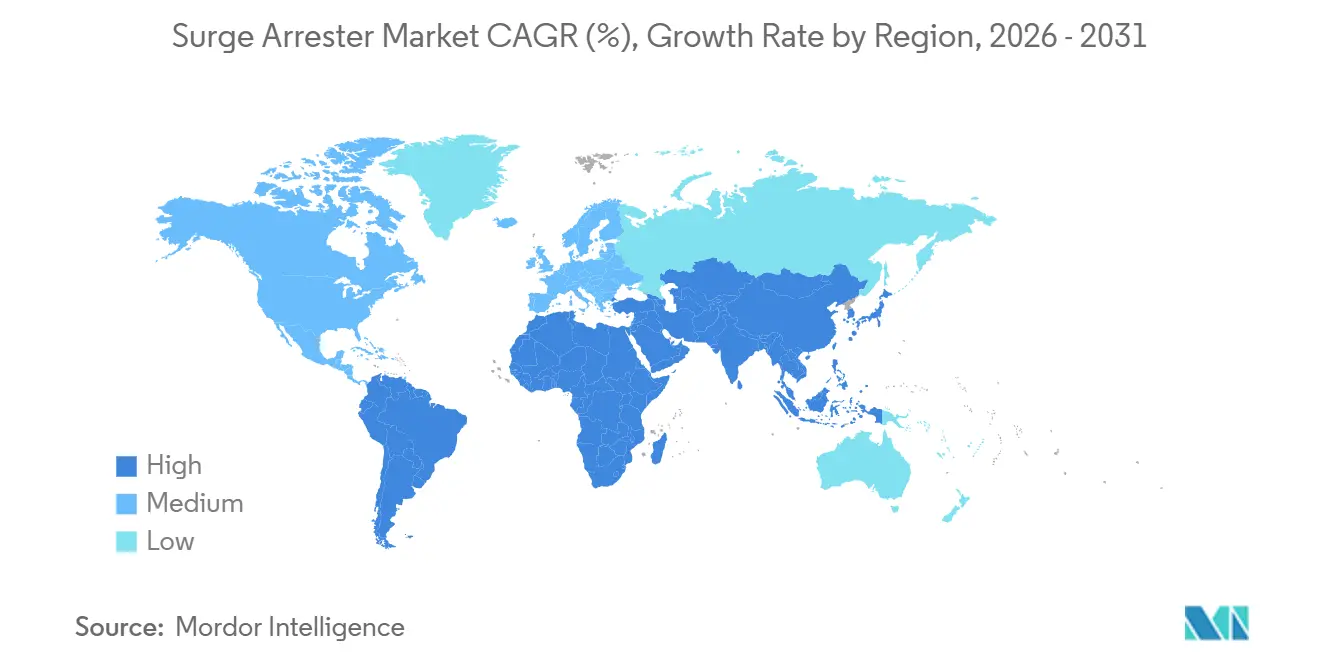
- By geography, the Asia-Pacific region commanded 41.05% of the Global surge arrester market in 2025 and is expected to post a 5.82% CAGR from 2026 to 2031.
Note: Market size and forecast figures in this report are generated using Mordor Intelligence’s proprietary estimation framework, updated with the latest available data and insights as of 2026.
Market Trends and Insights
Drivers Impact Analysis of Surge Arrester Market*
| Driver | (~) % Impact on CAGR Forecast | Geographic Relevance | Impact Timeline |
|---|---|---|---|
| Grid modernisation programmes in North America & EU | 1.20% | North America & EU | Medium term (2-4 years) |
| Utility-scale renewable capacity additions requiring over-voltage protection | 1.00% | Global, concentration in APAC & EU | Long term (≥ 4 years) |
| Electrification of industrial processes in emerging Asia | 0.80% | APAC, spill-over to MEA | Medium term (2-4 years) |
| Rapid build-out of EV fast-charging corridors | 0.60% | Global, early adoption in North America & EU | Short term (≤ 2 years) |
| Surge arrester retrofits in offshore wind substations | 0.40% | North America & EU coastal regions | Medium term (2-4 years) |
| Digital twin-enabled asset-health monitoring boosting replacement demand | 0.30% | Global, led by developed markets | Long term (≥ 4 years) |
| Source: Mordor Intelligence | |||
Grid Modernisation Programmes in North America & EU
Utility regulators across both regions allocate multibillion-dollar budgets to harden aged grids against severe weather, elevating demand for station-class arresters with online condition sensors. Projects such as Entergy Texas’s USD 335 million line-reinforcement scheme pair surge-protection upgrades with federal resilience funding, illustrating how reliability mandates translate directly into purchase orders. Predictive maintenance, powered by leakage-current analytics, now informs arrester replacement schedules, enabling utilities to avoid catastrophic failures while managing capital expenditures. At the same time, the increasing use of renewable interconnections escalates switching-surge frequency, forcing tighter coordination between arresters, breakers, and shunt reactors. As a result, the Global surge arrester market receives a pronounced boost from digital-ready hardware aligned with North American and European grid-code updates.[1]“Entergy Texas Strengthens Lines,” T&D World, tdworld.com
Utility-Scale Renewable Capacity Additions Requiring Over-Voltage Protection
Wind and solar developers specify arresters across collection systems, substations, and export cables to safeguard inverters and transformers from lightning and switching surges. Offshore wind farms pose a heightened risk; measured temporary overvoltages can reach levels that threaten cable insulation unless mitigated. Technical studies show arresters cut those overvoltages by 68.3%, with even greater reductions when paired with pre-insertion resistors, underscoring the need for coordinated protection schemes. As governments double their renewable targets to meet 2030 climate goals, medium-voltage switchgear and the associated surge-protection hardware are experiencing double-digit growth. Consequently, component suppliers scaling high-energy MOV technologies capture an additional share of the Global surge arrester market.[2]B. De Andrade et al., “Temporary Over-Voltage Mitigation in Offshore Wind Farms,” IEEE Access, ieee.org
Electrification of Industrial Processes in Emerging Asia
Manufacturers transitioning from fossil-fuel boilers to electric heaters often encounter frequent voltage fluctuations, resulting in production losses that can exceed USD 25,000 per month for some plants. Surge-protection retrofits, therefore, migrate from optional to critical-path investments. China’s automation push drives demand for medium-voltage arresters that handle high-frequency transients generated by variable-frequency drives, while India’s incentive programs foster electronics clusters that require low-pollution, corrosion-resistant devices. Suppliers able to package arresters with filters and isolation transformers gain an edge. These orders underpin the Global surge arrester market outlook for industrial segments across ASEAN and South Asia.[3]Reinhausen, "Asian industry uses voltage regulation distribution transformers in the fight against fluctuating grids," reinhausen.com
Rapid Build-Out of EV Fast-Charging Corridors
Public DC fast chargers are susceptible to lightning, grid-switching, and internal fault surges on both the AC input and DC output. Standards lag equipment rollouts, giving arrester makers a window to define best practice. Device launches such as Bourns’ 1500 VDC Class I+II modules illustrate product adaptation to higher-voltage DC. Thermal-disconnect designs and compact footprints suit roadside enclosures, aiding safe uptime. As charging-corridor density rises, tailored protection shifts more revenue into the Global surge arrester market.
Restraints Impact Analysis of Surge Arrester Market*
| Restraint | (~) % Impact on CAGR Forecast | Geographic Relevance |
|---|---|---|
| Volatile prices of metal-oxide varistors | -0.80% | Global, concentrated in manufacturing regions |
| Fragmented IEC & IEEE testing standards across regions | -0.50% | Global, affecting multinational manufacturers |
| Project delays in long-distance UHV transmission lines | -0.40% | APAC core, spill-over effects globally |
| Counterfeit low-cost products eroding OEM margins | -0.30% | Emerging markets, particularly Asia & MEA |
| Source: Mordor Intelligence | ||
Volatile Prices of Metal-Oxide Varistors
Zinc oxide accounts for the majority of varistor weight, so fluctuations in mine output and tighter environmental regulations drive cost swings that squeeze margins, especially on low-voltage units sold through competitive tenders. Some OEMs redesign formulations to reduce ZnO content; however, qualification cycles are still lengthy. Short-term volatility, therefore, trims profitability, modestly slowing procurement across the Global surge arrester market.
Fragmented IEC & IEEE Testing Standards Across Regions
Parallel compliance regimes force dual design and test programs. IEC 61643-01 emphasizes lightning-impulse performance, whereas IEEE C62.11 focuses on switching-surge energy ratings. Multinational suppliers often need to maintain duplicate product lines, which inflates costs and extends the time-to-market. Until greater harmonization emerges, this complexity restricts economies of scale within the Global surge arrester market.[4]“Surge Protective Device Standards,” International Electrotechnical Commission, iec.ch
*Our forecasts treat driver/restraint impacts as directional, not additive. The impact forecasts reflect baseline growth, mix effects, and variable interactions.
Surge Arrester Market Segment Analysis
By Voltage:
Driving UHV Technical InnovationExtra- and ultra-high-voltage arresters are projected to grow at the fastest rate, with a 6.74% CAGR, as interregional renewable transfers demand voltages of ±800 kV and above. Medium-voltage devices still anchor 37.52% of the Global surge arrester market in 2025, providing backbone protection for distribution feeders that serve industrial parks and dense urban loads. Complex varistor stacks and silicone housings designed for 330 kV-plus duties continue to trickle down into lower-voltage offerings, improving thermal stability across the board. China’s 1,901 km ±800 kV UHVDC line underscores technical feasibility and stimulates export interest in similar corridors across South Asia and Africa.



By Product Type:
Line Arresters Gain Transmission TractionStation-class arresters delivered 41.95% of the revenue in 2025, while line arresters advanced at a 7.18% CAGR as utilities quantified outage reductions that outweighed the installation cost. Gapless polymer-housed designs, combined with vibration-resistant clamps, speed up retrofit campaigns on existing 220 kV lines. Field data from CIGRE confirms significant lightning-outage cuts, reinforcing the adoption curve across the Global surge arrester market.
By Installation Location:
Transmission Lines Accelerate AdoptionSubstations retained a 36.65% share in 2025, but transmission-line applications expanded at a 6.92% CAGR due to renewed reliability focus. Remote monitoring modules now relay arrester temperature and leakage current via cellular links, enabling helicopter-free inspections on mountain spans. Such advances widen opportunity size within the Global surge arrester market, particularly in regions with long overhead corridors.
By Application:
Residential Segment Powers Smart-Home GrowthUtility networks held a 53.35% share in 2025; nonetheless, residential adoption posted a brisk 6.12% CAGR as smart-home electronics grew. Insurance data highlighting USD 825 million in lightning damage to U.S. households catalyzes code revisions that mandate the use of Type 1 or Type 2 devices at service entrances. That policy backdrop injects fresh momentum into the Global surge arrester market for low-voltage units.
Geography Analysis
APAC Surge Arrester Market
The Asia-Pacific region led with a 41.05% share of the Global surge arrester market in 2025 and is predicted to expand at a 5.82% CAGR. China’s State Grid alone invested over 500 billion yuan in smart-grid rollouts during 2024, with UHV lines absorbing a sizeable arrester budget. India’s electrification drives add medium-voltage demand, while Japan’s long record of 66-1100 kV installations supplies application know-how.
North America Surge Arrester Market
North America registers steady gains as federal-state grid-modernization alliances release funding tranches tied to resilience metrics. Offshore-wind buildouts along the Atlantic spur marine-grade arrester purchases, and Canada’s USD 1.4 trillion grid-upgrade roadmap secures long-term replacement cycles, each reinforcing North America’s contribution to the Global surge arrester market.
EMEA and South America Surge Arrester Market
Europe emphasizes digital monitoring and harmonized protection practices under EN 50539, and Mediterranean offshore wind cables add a challenging salt-spray environment. South America, plus the Middle East & Africa, comprise emerging pockets; mining and petrochemical projects create site-specific surges, but procurement often favors ruggedized, proven models over feature-rich units, moderating yet not negating growth within the Global surge arrester market.

Regulatory Landscape
Compliance in the surge arrester market continues to be shaped by parallel IEC and IEEE frameworks, which keeps qualification and labeling requirements region-specific for multinational suppliers. In Europe, CENELEC published EN IEC 61643-11:2026/A11:2026 (October 2025), aligning low-voltage surge protective device requirements with the Low Voltage Directive 2014/35/EU. Telecom and signaling protection references also advanced with IEC 61643-21:2025 (October 2025) and EN IEC 61643-21:2026 (January 2026).
In China, the State Administration for Market Regulation implemented GB/T 28182-2024 (December 2024) for series gap arresters rated 52 kV and below, replacing the 2011 edition and tightening the baseline for domestic procurement and certification. Technical bodies continue work on harmonizing test approaches across IEC 60099-4 and IEEE C62.11, but suppliers still need dual-path validation where global tenders or export programs require both regimes.
Competitive Landscape
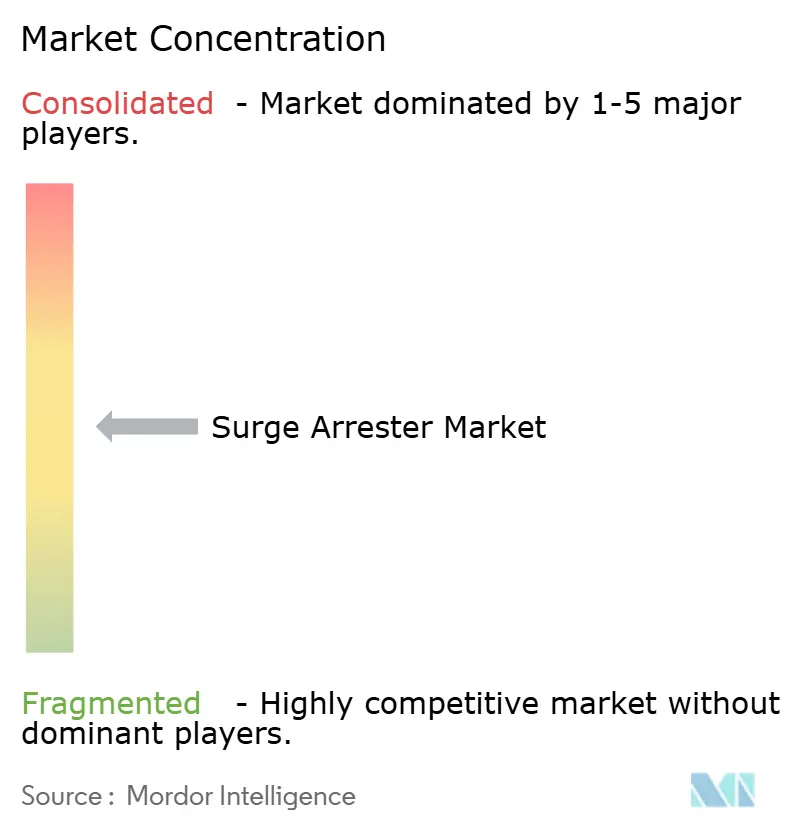
The market remains moderately consolidated. ABB, Siemens Energy, and Hitachi Energy continue to dominate high-voltage niches by pairing deep R&D pipelines with global service fleets. These leaders integrate IoT sensors into polymer-housed arresters to shore up differentiation. Mid-tier players like Eaton and TE Connectivity expand their portfolios through targeted acquisitions: TE’s November 2024 acquisition of Harger adds lightning-grounding breadth that complements its arrester line. Counterfeit proliferation, particularly in certain parts of Asia, pressures pricing at the lower end and compels OEMs to invest in traceability and QR-coded product passports. Strategic alliances between EPC contractors and renewable developers are increasingly influencing contract awards, nudging the Global surge arrester market toward ecosystem-based competition.
Surge Arrester Industry Leaders
-
ABB Ltd
-
Siemens AG
-
Hitachi Energy Ltd.
-
Eaton Corporation plc
-
DEHN SE
- *Disclaimer: Major Players sorted in no particular order
Surge Arrester Market Companies Covered in this Report
- ABB Ltd.
- Siemens Energy AG
- Hitachi Energy Ltd.
- Eaton Corporation plc
- Schneider Electric SE
- Mitsubishi Electric Corp.
- CG Power & Industrial Solutions Ltd.
- General Electric Company
- Raycap Corporation SA
- Legrand SA
- Littelfuse Inc.
- Leviton Manufacturing Co. Inc.
- DEHN SE
- Phoenix Contact GmbH & Co. KG
- CITEL Electronic
- Hakel Spol s r.o.
- Bourns Inc.
- Hubbell Power Systems
- Belkin International Inc.
- Tripp Lite (by Eaton)
- Zhejiang Thor Electric Co. Ltd.
- Advanced Protection Technologies Inc.

Market Opportunities and Future Outlook
Grid hardening and transmission buildouts are translating into clearer specification pull-through for higher-energy and higher-creepage arrester designs, particularly around UHV/HVDC corridors and major transmission reinforcements. This shows up in utility planning and project pipelines such as the California ISO Board-approved 2025-2026 Transmission Plan (May 2026), which identifies 38 transmission projects costing USD 6.7 billion to support long-horizon resource integration. Programs like this expand the installed base of substations and line terminations where station-class and line arrester procurement is built into standard bill-of-materials.
Application-specific protection and digitization are also creating product pull. Condition-based maintenance is increasing the need for embedded diagnostics (leakage-current tracking, thermal indicators, and smarter interfaces), while deployment-driven use cases such as EV fast-charging and distributed metering favor compact, standards-aligned SPDs that simplify installation. On the engineering side, published techno-economic guidance on optimal MV arrester placement (Electric Power Systems Research, May 2026) supports more systematic adoption of transmission line surge arresters, where utilities are targeting measurable lightning and switching-surge performance improvements alongside right-of-way and structure optimization.
Recent Industry Developments in Surge Arrester Market
- May 2026: Phoenix Contact released the FLT-SEC-ZP2-SV combined lightning current and surge arrester with an integrated voltage pick-off designed for smart meter gateway (SMGW) systems. The product is positioned for main power supply system use cases aligned with VDE-AR-N 4100, supporting tighter integration of surge protection into digital metering and monitoring architectures.
- December 2025: DEHN launched the DEHNventil ACI M TNS 264 FM combined arrester (Type 1+2+3) featuring Advanced Circuit Interruption (ACI) technology, removing the need for backup fuses in specified installations. This simplifies panel design and retrofit work, a key purchasing criterion in space-constrained commercial and industrial electrical rooms.
- July 2024: DEHN announced the acquisition of ABB's Current Technology and Joslyn surge protection business brands in the United States. The transaction broadened DEHN's channel access and installed-base reach in North America, strengthening its competitive position across utility, industrial, and building surge protection segments.


Surge Arrester Market Report Scope and Research Methodology
Market Definition and Coverage
This market covers surge arresters used to protect electrical equipment and networks from overvoltage events, including products installed on distribution and transmission systems and within substations. We size the market based on the value of surge arrester units sold for utility, industrial, commercial, and residential uses.
Scope exclusions: Excludes broader surge protection devices that are not surge arresters, as well as unrelated power quality equipment and general electrical accessories.
Segments Covered in This Report
-
By Voltage
- Low Voltage (Up to 1 kV)
- Medium Voltage (1 to 36 kV)
- High Voltage (36 to 330 kV)
- Extra and Ultra High Voltage (Over 330 kV)
-
By Product Type
- Station-Class Arresters
- Distribution-Class Arresters
- Intermediate-Class Arresters
- Line Arresters
-
By Installation Location
- Substations
- Transmission Lines
- Distribution Networks
- Power-Generation Facilities
- Industrial Machinery and Process Plants
-
By Application
- Utilities
- Industrial
- Commercial
- Residential
-
By Geography
-
North America
- United States
- Canada
- Mexico
-
Europe
- Germany
- United Kingdom
- France
- Italy
- Spain
- Russia
- Rest of Europe
-
Asia-Pacific
- China
- India
- Japan
- South Korea
- ASEAN Countries
- Rest of Asia-Pacific
-
South America
- Brazil
- Argentina
- Rest of South America
-
Middle East and Africa
- Saudi Arabia
- United Arab Emirates
- South Africa
- Egypt
- Rest of Middle East and Africa
-
North America
Data Sources, Market Sizing, and Validation
Desk Research
Desk research was used to set the backbone of the model, mainly by aligning the demand pool with grid build and maintenance activity. We referred to public sources such as the International Energy Agency, the World Bank, the United Nations Comtrade database, the US Energy Information Administration, and national grid and energy regulator publications for electricity network indicators.
To translate these signals into market numbers, we also reviewed company annual reports, investor presentations, technical standards notes published by recognized bodies, and reputable trade press that tracks grid upgrades and outage events. For cross-checks, we used paid subscriptions that support company financials and intelligence, news and financials tracking, patent databases, and shipment-level import and export views where available. These source types are illustrative only, and we also used other public and paid references during data collection, validation, and clarification.
Primary Interviews and Surveys
Primary work focused on interviews and structured surveys with manufacturers, distributors, utility procurement teams, EPC and substation contractors, and engineers involved in specification and maintenance. Because this is a global market, we covered demand and pricing patterns across APAC, EMEA, and the Americas so assumptions on replacement cycles, voltage mix, and channel margins could be confirmed and adjusted where needed.
Distribution of primary research fieldwork respondents
| Company type | Respondent position | Region |
|---|---|---|
| Top tier: 30% | CXOs: 12% | APAC: 45% |
| Mid tier: 55% | Functional/Unit leaders: 43% | EMEA: 35% |
| Smaller Players: 15% | Managers: 45% | Americas: 20% |
Market-Sizing & Forecasting
Sizing starts from a top-down build where grid investment signals and installed base activity are converted into a demand pool for arresters by voltage class and installation point (substation versus line). Once the demand pool is created, pricing bands are applied using primary inputs on typical ASP ranges by voltage rating and material type, and then totals are rolled up to regions and the global level.
To keep the results grounded, the topline is corroborated with selective bottom-up approximations, such as rolling up a sample set of supplier revenues tied to arrester lines, distributor channel checks, and simple volume times ASP checks for high-activity grids. Key model inputs include transmission and distribution expansion, substation additions and refurbishments, lightning and switching surge exposure patterns, replacement cycles for aging assets, and the share shift toward polymeric designs in certain climates (these act as practical levers that move volumes and prices together).
For forecasting, we primarily use scenario analysis supported by expert consensus, since grid capex timing and utility procurement cycles can shift year to year. Where data points are thin for smaller countries, gaps are handled by using regional voltage mix proxies and then rebalancing with interview feedback on local procurement practices and import reliance.
Data Validation & Update Cycle
Model outputs are checked against independent signals, such as grid expansion announcements, trade flows for relevant electrical protection categories, and the pace of substation and line upgrades. When a variance looks unusual, the assumptions are re-opened, and follow-up calls are triggered to confirm whether it was caused by pricing, project deferrals, or a change in product mix.
Before sign-off, the work goes through multi-step analyst review, including consistency checks across regions and year-on-year movements by voltage class. Reports are refreshed annually, and interim updates are made when material events occur, such as large grid stimulus programs or sharp currency moves affecting imported components. Right before delivery, a final pass is completed so clients receive the latest updated view.
Mordor Intelligence's Surge Arresters Market Size Compared With Other Published Estimates
Published market sizes for surge arresters often do not match because the scope and the counting rules differ, and those differences are not always clearly stated. In our checks, the largest swings usually come from what is included around low-voltage protection, the assumed replacement cycle, and how prices are converted across regions.
Surge protection devices used inside buildings (like panel-mounted SPDs) sit outside Mordor Intelligence's scope for this surge arrester market, which is one reason some published values look higher even when growth rates are similar. Differences also show up when an estimate leans heavily on a single base year, uses aggressive grid upgrade timing, or applies one blended ASP without reflecting the voltage mix between distribution and transmission demand.
Benchmark comparison
| Source | Market Size | Gaps in Research Methodology |
|---|---|---|
| Mordor Intelligence | USD 2.17 B (2026) | |
| Global Consultancy A | USD 1.94 B (2025) | Uses an earlier base year and a shorter forecast window, and the scope description suggests a voltage-rating split that may not fully capture transmission line and substation installation differences in the same way. |
| Industry Publisher B | USD 1.94 B (2025) | Leans on broad segment buckets (by voltage, class, and material) with limited visibility on how replacement cycles and regional pricing are normalized, which can compress totals when high-voltage projects are underweighted. |
The table shows that most of the spread is explainable once inclusion rules and the voltage and installation mix are made explicit. By tying demand to grid build and refurbishment activity, and then validating pricing and replacement logic through field feedback, the final number remains traceable to clear inputs and can be repeated when assumptions change.


Key Questions Answered in the Report
What is the current size of the Global surge arrester market?
The market reached USD 2.17 billion in 2026 and is forecast to grow to USD 2.8 billion by 2031.
Which region leads surge arrester demand?
Asia-Pacific held 41.05% share in 2025, driven by China’s ultra-high-voltage projects and India’s distribution upgrades.
Which product segment is expanding fastest?
Line arresters are projected to grow at 7.18% CAGR through 2031 owing to their effectiveness in cutting lightning-induced outages.
How will renewable energy integration influence arrester purchases?
Utility-scale wind and solar sites require extensive over-voltage protection, adding roughly 1.0 percentage point to overall market CAGR.
Why are counterfeit surge arresters a concern?
They erode OEM pricing power and pose safety risks, especially in emerging markets, trimming expected market growth by an estimated 0.3 percentage point.
Page last updated on:


 Your data is secure and never sold or shared.


