
Well Testing Services Market Size and Share
Market Overview
| Study Period | 2021 - 2031 |
|---|---|
| Market Size (2026) | USD 9.36 Billion |
| Market Size (2031) | USD 12.44 Billion |
| Growth Rate (2026 - 2031) | 5.88 % |
| Fastest Growing Market | Middle East and Africa |
| Largest Market | North America |
| Market Concentration | Medium |
Major Players *Disclaimer: Major Players sorted in no particular order Image © Mordor Intelligence. Reuse requires attribution under CC BY 4.0. | |
Well Testing Services Market Analysis by Mordor Intelligence
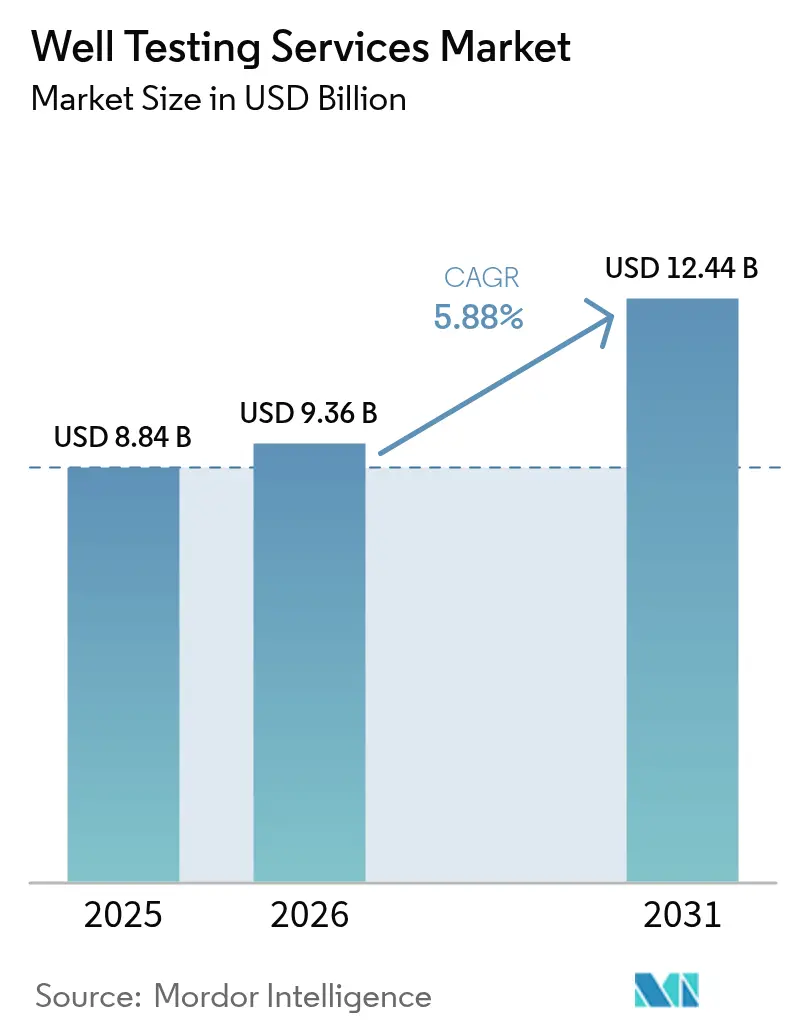
Well Testing Services Market size in 2026 is estimated at USD 9.36 billion, growing from 2025 value of USD 8.84 billion with 2031 projections showing USD 12.44 billion, growing at 5.88% CAGR over 2026-2031.
A push to optimize mature reservoirs, combined with higher-risk frontier drilling in deep and ultra-deep water, underpins sustained demand for formation evaluation, clean-up, and production testing services. Integrated service packages that embed digital analytics and real-time monitoring are increasingly replacing discrete, one-off tests, allowing operators to shorten decision cycles and reduce non-productive time. National oil companies (NOCs) in the Middle East, Brazil, and Africa are making forward commitments, while North American shale activity and Norway’s record 2025 capital approvals are expected to add near-term volumes. At the same time, geothermal and carbon-capture projects are opening ancillary avenues where specialized test protocols confirm injectivity and reservoir integrity.
Key Report Takeaways
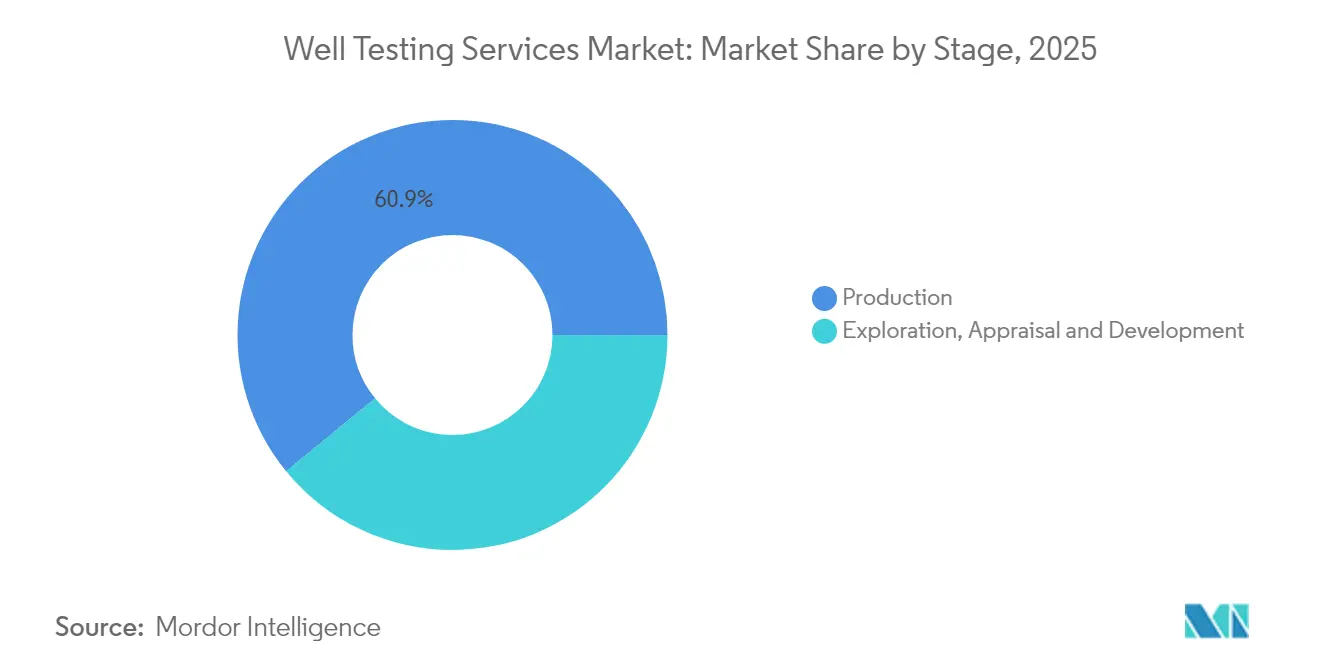
- By stage, production activities held 60.92% of the well testing services market share in 2025, whereas exploration and development work streams are projected to register a 7.35% CAGR to 2031.
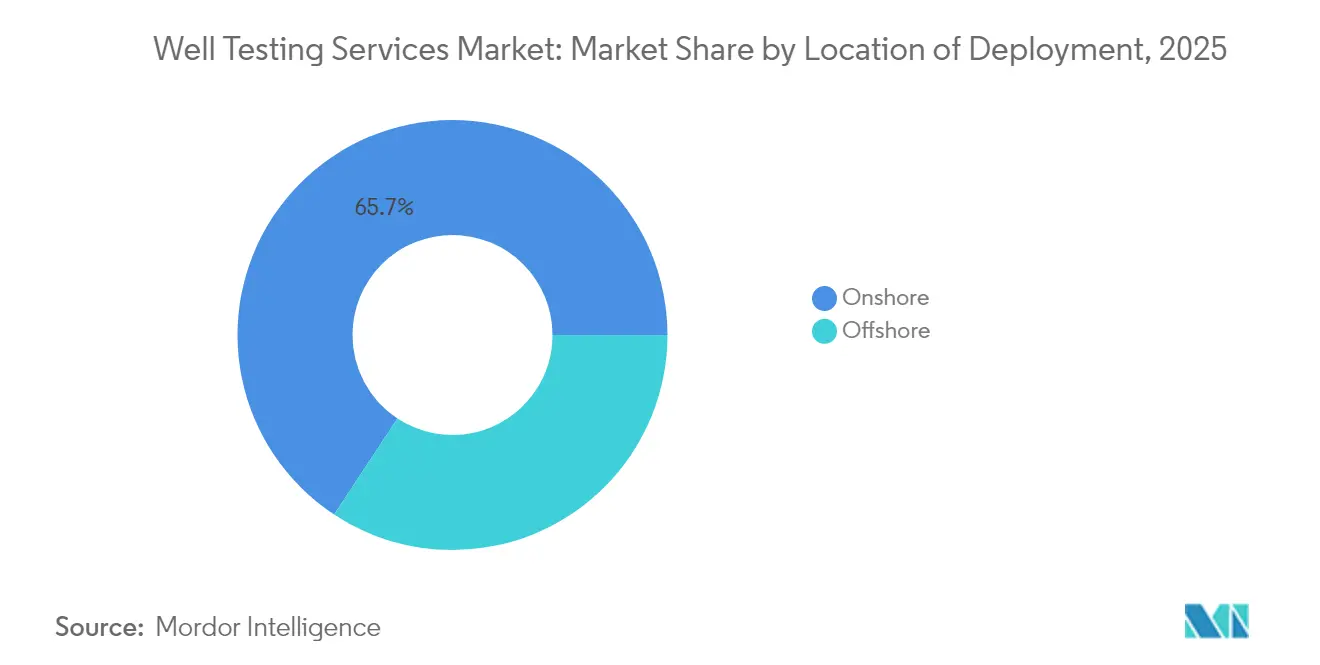
- By deployment location, onshore operations accounted for 65.72% of the well testing services market size in 2025, while offshore testing demand is set to expand at a 7.12% CAGR through 2031.
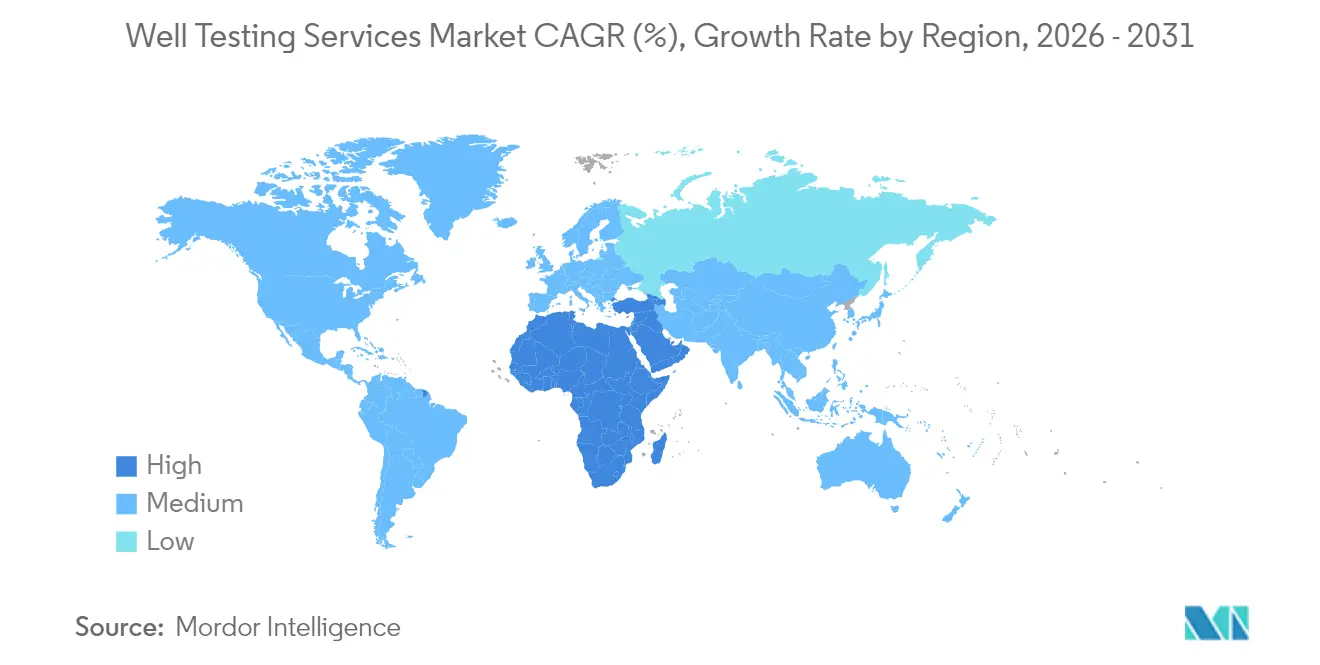
- By geography, North America dominated with 37.45% revenue share in 2025; the Middle East and Africa region is on course for the fastest growth at a 6.63% CAGR over 2026-2031.
Note: Market size and forecast figures in this report are generated using Mordor Intelligence’s proprietary estimation framework, updated with the latest available data and insights as of 2026.
Market Trends and Insights
Drivers Impact Analysis of Well Testing Services Market*
| Driver | (~) % Impact on CAGR Forecast | Geographic Relevance | Impact Timeline |
|---|---|---|---|
| Upturn in global rig count & drilling activity | +1.20% | North America, Middle East, Brazil | Medium term (2-4 years) |
| Aging fields driving production optimization | +1.80% | North Sea, Gulf of Mexico, mature Middle East | Long term (≥4 years) |
| Offshore deep- & ultra-deepwater developments | +1.10% | Brazil, Guyana, West Africa, Gulf of Mexico | Long term (≥4 years) |
| NOC push to maximize domestic output | +0.90% | Middle East, Africa, Latin America | Medium term (2-4 years) |
| Digital real-time well-testing analytics | +0.70% | North America, Europe | Short term (≤2 years) |
| Geothermal & CCS injection well testing | +0.40% | Europe, North America, select Asia-Pacific markets | Long term (≥4 years) |
| Source: Mordor Intelligence | |||
Upturn in Global Rig Count & Drilling Activity
A 15% year-over-year rise in active rigs has lifted baseline demand for testing, because every new well must undergo clean-up and flow evaluation before completion hand-off.(1)Baker Hughes, “Worldwide Rig Count February 2025,” bakerhughes.com Integrated contractors bundle drill-stem testing with wireline and data analytics, enabling operators to consolidate vendors and reduce logistics in high-cost deepwater theaters. Unconventional shale laterals, geothermal pilot wells, and the first wave of commercial carbon-storage injectors all follow similar protocols, expanding the serviceable footprint beyond traditional hydrocarbon targets. Companies that leverage rig-site digital twins to simulate pressure-transient behavior can shorten testing windows and reduce flaring volumes, thereby improving ESG metrics in capital-intensive basins.
Aging Fields Driving Production Optimization
Roughly 70% of global output now comes from fields more than 15 years on stream, where water cut and declining pressures threaten forecast curves.(2)OnePetro, “Decline Mitigation in Mature Fields,” onepetro.org Operators deploy multi-phase flow meters, periodic pressure-build-up tests, and permanent downhole gauges to uncover bypassed pay and recalibrate artificial-lift programs. Enhanced-oil-recovery schemes in the North Sea and the Gulf of Mexico rely on CO₂ or polymer floods, each of which requires baseline injectivity and tracer tests. Continuous testing data, stitched into asset dashboards, supports closed-loop optimization that boosts recovery factors without large redevelopment CAPEX. Providers offering analytics-as-a-service command price premiums because they convert raw pressure data into actionable production tactics.
Offshore Deep- & Ultra-Deepwater Developments
Water depths exceeding 1,500 m impose stringent hardware requirements, including high-pressure/high-temperature (HPHT) tools and landing strings rated to 20,000 psi. SLB’s USD 800 million Petrobras award underscores the value operators place on experienced testing contractors able to execute flawlessly in hostile environments. Pre-salt reservoirs exhibit heterogeneous carbonate facies, so formation testers must capture pristine fluid samples to calibrate PVT models before a USD 100 million-plus completion campaign. AI-enabled drilling aboard projects, such as Trion in Mexico, feed real-time petrophysics to testing crews, who adapt the flow-period duration on the fly to refine reserve estimates and reduce costly rig standby time.
NOC Push to Maximize Domestic Output
Petrobras, Saudi Aramco, and Kuwait Oil Company collectively earmarked more than USD 230 billion for upstream programs through 2030, with well testing nested inside larger drilling and completion scopes. Long-term framework contracts tie service rates to field performance, steering NOCs toward providers that can verify incremental barrels through meticulous flow and build-up analysis. Carbon capture pilots in the Middle East mandate injectivity tests to secure pore space, broadening the traditional hydrocarbon book. Because procurement rules favor local content, international service majors adopt partnership models with domestic tool manufacturers to preserve market access and comply with in-country value policies.
Restraints Impact Analysis of Well Testing Services Market*
| Restraint | (~) % Impact on CAGR Forecast | Geographic Relevance | Impact Timeline |
|---|---|---|---|
| Oil-price volatility affecting E&P budgets | -1.40% | North America shale, marginal offshore projects | Short term (≤2 years) |
| Stricter flaring / HSE regulations | -0.80% | Europe, North America, select emerging markets | Medium term (2-4 years) |
| Service-pricing pressure from operators | -0.60% | Global, pronounced in mature basins | Short term (≤2 years) |
| Permanent downhole gauges reducing surface tests | -0.50% | Technologically advanced assets worldwide | Medium term (2-4 years) |
| Source: Mordor Intelligence | |||
Oil-Price Volatility Affecting E&P Budgets
The International Energy Agency warns of a potential crude surplus of up to 1.4 million bpd in 2025, injecting uncertainty into capital allocation for discretionary test programs. Shale producers in the U.S. pivot rapidly from growth to free-cash-flow mode, shelving extended-flow tests and formation-fluid sampling campaigns. Deepwater appraisal wells in marginal projects see shortened test durations or compression into drill-stem runs to cut day-rate exposure. Although baseline safety and regulatory tests remain non-negotiable, value-added reservoir characterization phases typically occur later in the field life, compressing near-term revenue for service suppliers.
Stricter Flaring / HSE Regulations
Revised methane-emissions rules in the United States require periodic leak-detection surveys and restrict routine flaring during flowback.(3)U.S. EPA, “Methane Regulations for Oil and Gas 2024,” epa.gov European regulators mandate closed-loop well testing, forcing contractors to add choke manifolds, vapor-recovery units, and on-site tankage. Compliant packages can raise capital expenditures by as much as 25%, prompting smaller independents to seek price concessions from vendors. Providers that cannot field low-carbon solutions risk exclusion from licensing rounds in Norway, the Netherlands, and the United Kingdom, eroding potential order books.
*Our forecasts treat driver/restraint impacts as directional, not additive. The impact forecasts reflect baseline growth, mix effects, and variable interactions.
Well Testing Services Market Segment Analysis
By Stage:
Production-Focused Testing Sustains Volume GrowthProduction-phase work captured 60.92% of the well testing services market share in 2025, reflecting industry reliance on data-driven reservoir surveillance to offset natural decline. This dominant slice accounted for USD 5.39 billion of the well testing services market size, supported by field-wide campaigns in the Gulf of Mexico and the North Sea. Advanced wireline formation testers and multi-phase flow meters enable granular inflow mapping, underpinning artificial-lift tuning and conformance control decisions. Over the forecast horizon, exploration and development testing is poised for a 7.35% CAGR, catalyzed by deepwater finds in Brazil and Namibia and by U.S. Gulf appraisal drilling. Integration is blurring historical boundaries: service majors now embed formation testing, production logging, and permanent monitoring within a single life-of-well scope, thereby capturing annuity-style revenue streams.
As digital twins mature, production-phase data analytics underpin predictive interventions that can curtail water breakthrough and gas coning. Operators lean on structured well-test campaigns to recalibrate nodal-analysis models, avoiding costly recompletions. Continuous-read instrumentation does not eliminate the need for occasional flowbacks; instead, it flags deviations that trigger targeted testing. Consequently, production-oriented demand remains durable even as sensor penetration rises. Exploration-and-appraisal teams, meanwhile, deploy modular separator packages that shorten rig time and expedite regulatory approvals for early production systems, reinforcing a balanced growth outlook across all life-cycle stages.



By Location of Deployment:
Offshore Testing Gains MomentumOnshore programs accounted for 65.72% of the well testing services market size in 2025, generating USD 5.81 billion in revenues, primarily driven by U.S. shale basins, Middle East fields, and Chinese land rigs. Quick-move truck-mounted units and local supplier ecosystems keep service costs low, sustaining high activity turnover. Offshore demand, however, is forecast to accelerate at a 7.12% CAGR to 2031, propelled by Petrobras' pre-salt wells, Guyana's Liza development, and Equinor's North Sea tie-backs. Deepwater projects command day rates up to four times higher than land operations, so incremental offshore volume amplifies overall revenue growth.
Ultra-deepwater wells need extended clean-up periods and full-bore formation testing to validate carbonate heterogeneity and compositional gradients. Remote-operated subsea test trees and managed-pressure drilling kits ensure environmental compliance by curbing venting during flowback. Floating production, storage, and offloading (FPSO) units then receive stabilized hydrocarbons for early cash flow. Onshore contractors emulate the digital rigor of offshore peers by adding fiber-optic pressure/temperature cables and automating choke controls, fostering convergence in best practices. Nevertheless, the geographic spread of land rigs guarantees a stable base load, while high-value offshore scopes swing incremental upside for service majors.
Geography Analysis
North America Well Testing Services Market
North America anchored 37.45% of 2025 revenue thanks to shale infill drilling, enhanced oil recovery pilots, and steady Gulf of Mexico deepwater work. Operators in the Permian Basin schedule routine drill-stem and production tests to verify completion recipes and assess the efficacy of spacer fluid clean-up. Mexico’s deepwater Trion project adds USD 600 million in well construction and testing commitments through 2028. Digital adoption rates are highest in the United States, where cloud-connected pressure gauges provide real-time data to dashboards that expedite choke management and sand-control decisions. Canada’s oil sands rely on cyclic steam stimulation tests to optimize steam-oil ratios, widening the service envelope.
MEA Well Testing Services Market
The Middle East and Africa region is set to grow at a 6.63% CAGR, driven by Saudi Aramco’s Unconventional Resources Program, Kuwait’s Jurassic gas appraisal, and Angola’s ultra-deep Kaombo expansion. National budgets earmark multiyear scopes that blend wireline formation testing, build-up surveys, and production logging, delivering predictable backlog for integrated contractors. Emerging CCS pilots in the UAE require injection-well step-rate tests to verify seal integrity, thereby extending the market beyond traditional oil targets.
Europe and APAC Well Testing Services Market
Europe combines mature asset management with decarbonization imperatives. Norway approved more than NOK 250 billion in upstream projects in 2025, many of which incorporated dual-objective test programs that measure flow performance and emissions baselines concurrently. North Sea operators partner with service firms to retrofit closed-flare systems onto mobile test packages. Continental Europe sees geothermal pilot wells in Germany and France, where high-temperature formation testers ascertain drawdown response and induced-fracture propagation. Asia-Pacific rounds out the global map: China’s Bohai Bay expansion and India’s deepwater KG Basin spur demand, while Australia’s Browse gas field and Indonesia’s Andaman II exploration push specialist HPHT testing skills into emerging basins. The diversity of rock types and pressure regimes across the Asia-Pacific region compels contractors to maintain versatile equipment fleets that can transition from low-pressure coal seam methane to 18,000 psi carbonate tests within weeks.

Regulatory Landscape
Well testing services operate under increasingly prescriptive offshore safety, reporting, and emissions-control rules, with requirements differing by basin but converging around tighter documentation and standardization. In the United States Gulf of Mexico, the Bureau of Safety and Environmental Enforcement (BSEE) requires operators to notify the District Manager at least 24 hours before commencing a well test (30 CFR 250.460) and to file a Well Potential Test Report (Form BSEE-0126) within 15 days after the test period for well-flow potential tests. This raises the importance of auditable data capture and standardized workflows for service providers.
Canada adds another layer through provincial directives and offshore frameworks. The Alberta Energy Regulator (AER) updated Directive 040 (Pressure and Deliverability Testing Oil and Gas Wells), effective June 2025, tightening expectations around how deliverability and pressure tests are executed and documented in the province. Offshore Canada also requires integrity-focused testing, including formation leak-off or integrity tests to verify cement adequacy and safe drilling pressures under the Newfoundland and Labrador offshore area petroleum operations framework regulations (SOR/2024-25). In the United States, BSEE also finalized a rule (published June 2026, effective August 10, 2026) that incorporates certain production measurement and safety industry standards by reference, increasing the compliance burden to track referenced standard revisions that affect test methods, equipment, and documentation.
Competitive Landscape
Three Tier-1 service companies—SLB, Halliburton, and Baker Hughes—controlled more than USD 2 billion of contract awards in 2024-2025, reflecting a moderate concentration in the well testing services market. SLB’s USD 7.8 billion acquisition of ChampionX strengthened its artificial-lift and reservoir-chemical portfolio, enabling cross-selling into testing scopes that hinge on flow-assurance management. Halliburton emphasizes integrated well intervention packages that combine testing, coiled tubing, and plug-and-abandonment, securing life-of-asset contracts across Petrobras’s pre-salt acreage. Baker Hughes leverages its industrial-turbomachinery arm to bundle test separators with flare gas recovery units, winning sustainability-driven tenders in Norway and Qatar.
Mid-cap challengers such as Expro and Core Laboratories focus on specialty services—ultra-high-rate separator packages, reservoir fluid analysis, and laboratory PVT modeling—that complement major-service spreads. Niche players in geothermal and CCS testing, including Welltec and TGT Diagnostics, gain footholds through patent-protected temperature-resilient tools and acoustic pulse diagnostics. Competitive differentiation hinges on digital workflows, where AI-assisted pressure-transient interpretation shortens turnaround from days to hours, unlocking premium pricing. Intellectual property filings for machine-learning algorithms applied to flow-after-flow data increased by 24% in 2024, signaling an accelerated pace of technology development among incumbents. Operators increasingly award outcome-based contracts pegged to production uplift, incentivizing suppliers to assume greater reservoir performance risk in exchange for a share of the upside.
Well Testing Services Industry Leaders
Schlumberger Limited
Halliburton Company
China Oilfield Services Limited
Weatherford International Plc.
Baker Hughes Company
- *Disclaimer: Major Players sorted in no particular order

Well Testing Services Market Companies Covered in this Report
- Schlumberger Limited
- Halliburton Company
- Baker Hughes Company
- Weatherford International Plc
- Expro Group Holdings NV
- TETRA Technologies Inc.
- SGS SA
- Core Laboratories
- CETCO Energy Services
- Petrofac Ltd
- TechnipFMC plc
- Superior Energy Services
- Oil States International Inc.
- National Oilwell Varco (NOV)
- FTS International
- TestWells Ltd
- Northstar Downhole Specialists
- Archer Ltd
- Seadrill Ltd
- KCA Deutag

Market Opportunities and Future Outlook
Unconventional gas programs and national oil company upstream agendas are expanding the addressable scope for well testing and flowback services, particularly where complex reservoirs and high service intensity favor integrated offerings. Recent contract activity reflects this shift: Expro secured a two-year unconventional well testing and flowback contract in the UAE (June 2026), and Aramco awarded Halliburton a multi-year integrated stimulation and completion services contract for unconventional gas development at Jafurah (reported July 2026). These programs increase demand for end-to-end packages that combine clean-up, rate management, sand handling, and fast-turn interpretation, while also raising the bar for local execution models in the Middle East.
Digital well testing operations management is emerging as a differentiator beyond surface equipment alone. Daleel Oilfield commissioned a digital well-testing management solution across 1,000 producing wells (May 2026), integrating SCADA real-time data, multiphase flowmeters, and automated switching to improve scheduling and reporting discipline at scale. Product-side innovation also reinforces this direction: Halliburton launched its Xaminer Deep Testing service (May 2026) to deliver deep-reading reservoir insights and boundary identification in single-run operations for complex reservoirs, supporting operator efforts to shorten decision cycles and reduce non-productive time. In parallel, geothermal and other non-hydrocarbon subsurface projects are using adapted well testing systems for reservoir characterization, illustrated by Expro's geothermal well testing work for Vulcan Energy's Lionheart project in Germany (March 2026).
Recent Industry Developments in Well Testing Services Market
- July 2026: Aramco awarded Halliburton a multi-year integrated stimulation and completion services contract to support unconventional gas development at Jafurah in Saudi Arabia. The scope includes digital integration and automation, reinforcing the market shift toward bundled service delivery where testing and evaluation work streams sit inside broader completion execution.
- May 2026: Halliburton launched the Xaminer Deep Testing logging service to improve deep-reading reservoir insight and boundary identification in complex reservoirs. The launch supports faster reservoir characterization in fewer runs, aligning with operator efforts to compress wellsite time while still capturing pressure-transient and formation evaluation data needed for completion decisions.
- March 2026: Expro introduced Solus, a shear-and-seal in-riser valve system for well intervention validated to API Std 17G. The equipment strengthens well control and operational assurance during intervention and related well operations, supporting service providers executing testing and flow-related activities in higher-risk offshore environments.


Well Testing Services Market Report Scope and Research Methodology
Market Definition and Coverage
This market is defined as revenue earned from contracted well testing work that measures well flow and pressure behavior to support reservoir understanding and production decisions across oil and gas wells, delivered onshore and offshore.
Scope exclusions: It excludes drilling rigs, permanent production equipment, and lab-only fluid analysis when it is sold separately from a well test service.
Segments Covered in This Report
- Stage
- Exploration, Appraisal and Development
- Production
- Location of Deployment
- Onshore
- Offshore
- Geography
- North America
- United States
- Canada
- Mexico
- Europe
- United Kingdom
- Norway
- Russia
- Italy
- Rest of Europe
- Asia Pacific
- China
- India
- ASEAN Countries
- Australia
- Rest of Asia Pacific
- South America
- Brazil
- Argentina
- Rest of South America
- Middle East and Africa
- Saudi Arabia
- United Arab Emirates
- Qatar
- Turkey
- Nigeria
- Angola
- Algeria
- Egypt
- Rest of Middle East and Africa
- North America
Data Sources, Market Sizing, and Validation
Desk Research
For desk research, we started by mapping demand drivers that are observable in public data, and then connected them back to well testing activity and pricing. Sources used include official energy statistics such as the US EIA and IEA, upstream and production releases from national regulators (for example NPD-type bodies), and petroleum ministry updates where field development plans are disclosed. We also reviewed reporting from trade associations such as IADC and SPE, plus peer reviewed papers that discuss test duration, tooling, and operational practices.
To shape the revenue model, we incorporated company annual reports, investor presentations, and reputable industry press on contracting trends, utilization, and service mix shifts. Select paid subscriptions were used only for company financials and news screening, along with patent databases to track tool and workflow changes that affect job design and realized pricing. This desk list is not exhaustive, and we reviewed additional public sources for data collection, cross-checking, and clarification.
Primary Interviews and Surveys
Primary work focused on validating how test intensity varies by basin and by offshore complexity. We then grounded typical job duration, crew day rates, and equipment spreads used in commercial quotes. Interviews covered upstream operators, well services managers, and field engineers across APAC, EMEA, and the Americas, so we could adjust assumptions on activity, utilization, and pricing to match reported contracting behavior.
Distribution of primary research fieldwork respondents
| Company type | Respondent position | Region |
|---|---|---|
| Top tier: 35% | CXOs: 14% | APAC: 47% |
| Mid tier: 51% | Functional/Unit leaders: 34% | EMEA: 34% |
| Smaller Players: 14% | Managers: 52% | Americas: 19% |
Market-Sizing & Forecasting
Sizing was built using a top-down approach where upstream activity and production and development plans are translated into a testable well population, and then converted into service spend using typical test frequency and job economics. In practice, the model uses inputs such as onshore versus offshore well counts, share of wells in production versus development stages, offshore deepwater project timing, average test duration, and regional day-rate ranges that shift with utilization.
After the first build, we checked totals using selective bottom-up approximations. These included sampled price-per-job ranges from interviews, channel checks on tender activity, and a limited supplier roll-up where public revenue splits were available. Where data gaps appeared, especially for smaller private providers, we used capacity and footprint indicators to bound their contribution rather than forcing a full revenue build.
For forecasting, scenario analysis was used around oil price expectations and project sanction cycles. The scenarios were then aligned to interview consensus on offshore growth and onshore maintenance testing. The final forecast reflects how the input variables move together, before the growth rate is applied to the revenue pool.
Data Validation & Update Cycle
Validation is done through multiple passes that compare model outputs with independent signals, including regional upstream capex direction, project start timing, and production trends that typically pull testing demand with them. If a region shows an unusual jump, the driver chain is rechecked, and assumptions on duration, pricing, and utilization are revisited, followed by a second analyst review before sign-off.
The report is refreshed each year, and interim updates are triggered when material events occur, such as major project sanctions, sharp service-cost inflation, or sustained changes in offshore activity. Before delivery, a final review pass is completed so clients receive the most current view available at that time.
Mordor Intelligence's Well Testing Services Market Size Compared With Other Published Estimates
Published market sizes for well testing services can differ even when the topic name looks identical, because the counted services, year definitions, and activity proxies are not always the same. Differences also come from how firms treat offshore project timing, how they move pricing over time, and whether estimates are rechecked against real field and contracting signals.
Tender cadence, offshore project commissioning timelines, and production-stage well activity are the checks that keep Mordor Intelligence's estimate tied to testing demand that is actually executed, not just implied by drilling headlines. When other publishers use a different base year, fold adjacent oilfield services into the scope, or apply a faster price progression without utilization checks, the resulting totals can land higher or lower.
Benchmark comparison
| Source | Market Size | Gaps in Research Methodology |
|---|---|---|
| Mordor Intelligence | USD 9.36 B (2026) | |
| Industry Publisher A | USD 8.01 B (2024) | Uses an earlier base year and a longer horizon, and the press-style estimate does not clearly show how offshore project timing and test duration assumptions are validated, which can shift the implied revenue per well. |
| Market Analytics Group B | USD 7.90 B (2024) | Focuses on a 2024 current size and a shorter forecast window, and the approach appears to lean more on high-level application splits with limited visibility on regional pricing and utilization steps that can lift or compress totals. |
The table shows that year choice and service boundary decisions explain much of the spread across published figures. By keeping the demand pool tied to observable upstream activity and then stress-testing pricing and utilization in interviews, our estimate stays traceable to clear variables that can be revisited when conditions change.


Key Questions Answered in the Report
What is the current size of the global well testing services market?
The market was valued at USD 9.36 billion in 2026.
What compound annual growth rate (CAGR) is forecast for the market through 2031?
Industry revenue is projected to expand at a 5.88% CAGR over 2026-2031.
Which life-cycle stage captures the largest revenue share?
Production-phase work held 60.92% of 2025 spending, reflecting operators’ focus on mature-field optimization.
Which region is growing fastest in well testing demand?
The Middle East and Africa market is expected to post a 6.63% CAGR during 2026-2031, outpacing all other regions.
What principal factors are driving market growth?
Higher rig counts, aging reservoir management needs, and expansion of deep- and ultra-deepwater projects are the main growth catalysts.
How are digital technologies reshaping well testing services?
Service providers increasingly bundle real-time analytics and AI-enabled monitoring with traditional tests to cut decision cycles and reduce emissions.
Page last updated on:





