Size and Share of Digital Transformation Market In The Oil And Gas Industry
Market Overview
| Study Period | 2020 - 2031 |
|---|---|
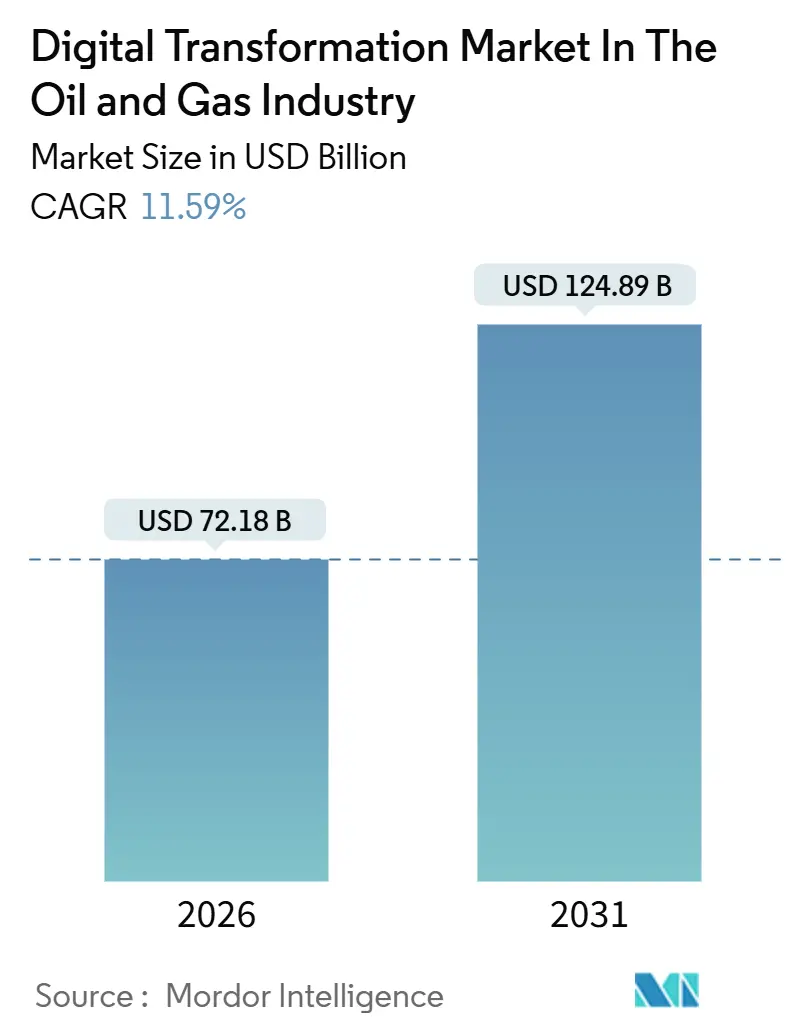
| Market Size (2026) | USD 72.18 Billion |
| Market Size (2031) | USD 124.89 Billion |
| Growth Rate (2026 - 2031) | 11.59% CAGR |
| Fastest Growing Market | Asia Pacific |
| Largest Market | North America |
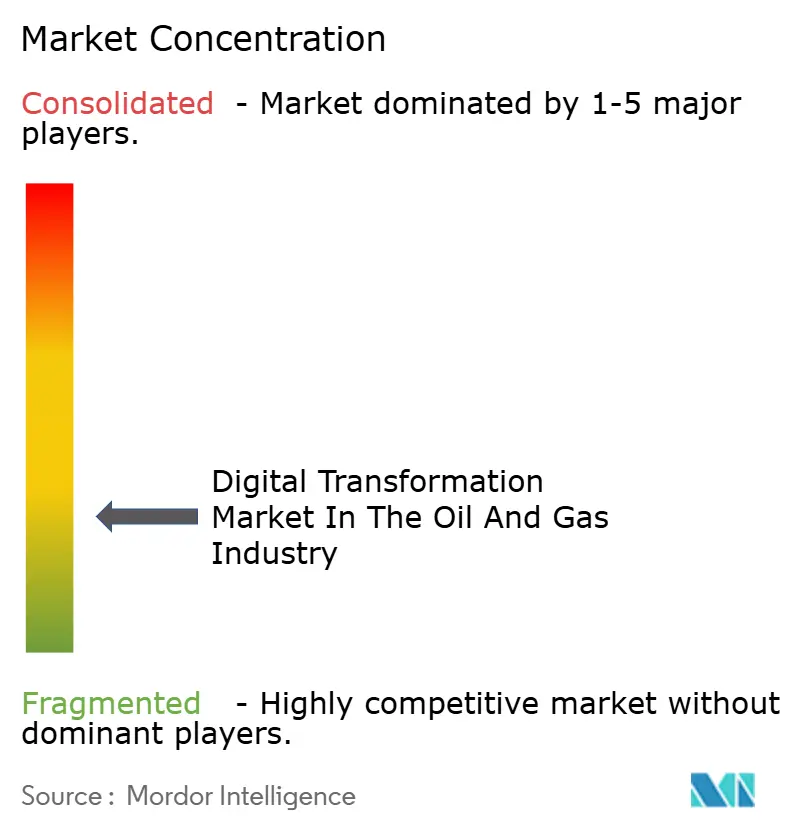
| Market Concentration | Low |
Major Players *Disclaimer: Major Players sorted in no particular order Image © Mordor Intelligence. Reuse requires attribution under CC BY 4.0. | |
Analysis of Digital Transformation Market In The Oil And Gas Industry by Mordor Intelligence
The digital transformation market in the oil and gas industry reached a market size of USD 72.18 billion in 2026 and is projected to climb to USD 124.89 billion by 2031, advancing at an 11.59% CAGR during the forecast period. Operators are accelerating investment in artificial intelligence, industrial Internet of Things, and cloud-native architectures to reduce breakeven costs, extend mature‐field life, and comply with tightening emissions-disclosure rules. Software remained the single largest spending category in 2025, yet a steep rise in integration, cybersecurity, and change-management outsourcing is shifting wallet share toward services. Internet of Things deployments formed the telemetry backbone for most initiatives, but the fastest budget growth is flowing to autonomous drilling pilots and predictive maintenance programs that trim non-productive time by double digits. Regionally, North America still commands more than one-third of spending thanks to shale operators’ data-driven completion designs, while Asia-Pacific is the quickest riser as national oil companies modernize infrastructure to meet liquefied natural gas export schedules and power-sector decarbonization targets.
Key Report Takeaways
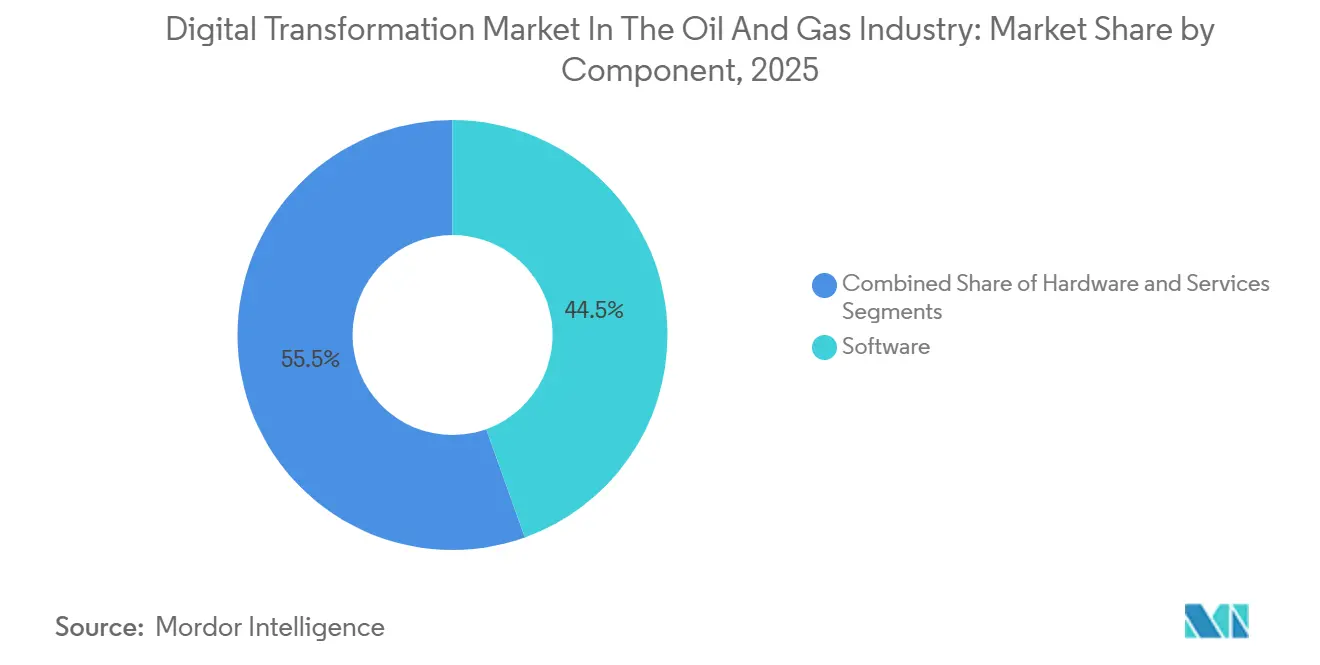
- By component, software led with a 44.53% revenue share in 2025, while services are expanding at a 12.62% CAGR through 2031.
- By technology, Internet of Things captured 26.37% of digital transformation market share in 2025, and artificial intelligence and machine learning solutions are scaling at a 13.01% CAGR to 2031.
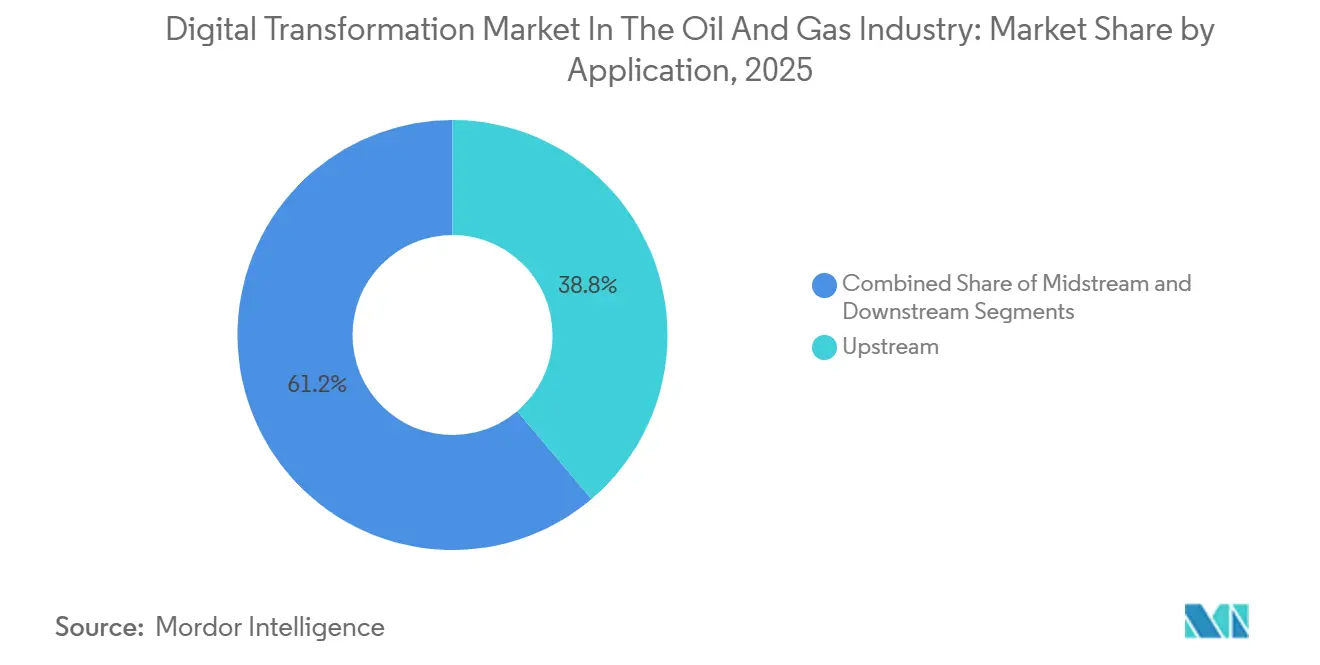
- By application, upstream operations held 38.81% of spending in 2025, whereas downstream refining and petrochemicals are forecast to grow at a 12.23% CAGR through 2031.
- By deployment mode, on-premise infrastructure accounted for 61.54% of digital transformation market size in 2025, while cloud deployments are projected to rise at an 11.91% CAGR to 2031.
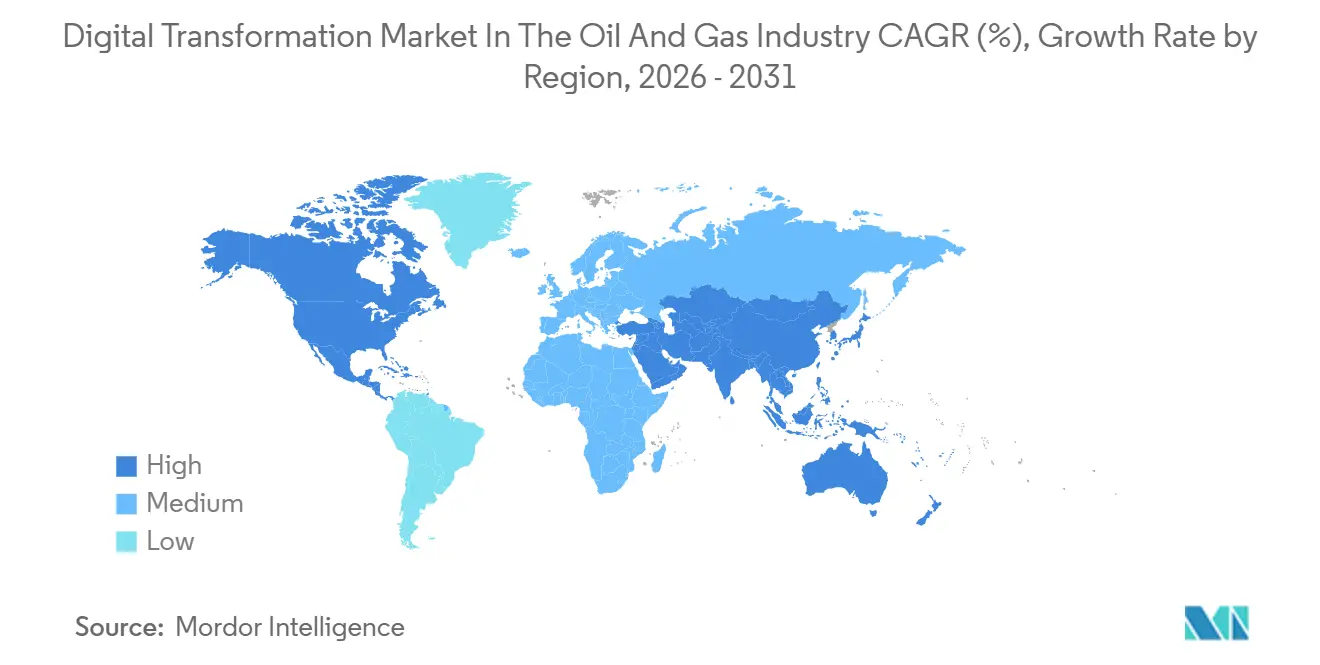
- By geography, North America represented 33.53% of spending in 2025; Asia-Pacific is advancing at a 12.68% CAGR between 2026 and 2031.
Note: Market size and forecast figures in this report are generated using Mordor Intelligence’s proprietary estimation framework, updated with the latest available data and insights as of January 2026.
Insights and Trends of Digital Transformation Market In The Oil And Gas Industry
Drivers Impact Analysis*
| Driver | (~) % Impact on CAGR Forecast | Geographic Relevance | Impact Timeline |
|---|---|---|---|
| Artificial Intelligence And Machine Learning Adoption For Predictive Maintenance And Autonomous Operations | +3.2% | Global, Early Concentration In North America And Middle East | Medium Term (2–4 Years) |
| Industrial Internet Of Things And Edge Computing For Real-Time Asset Monitoring | +2.8% | Global, Particularly Offshore And Remote Onshore Fields | Short Term (≤ 2 Years) |
| Cloud Migration Enabling Scalable Data Integration And Advanced Analytics | +2.4% | North America And Europe Lead, Asia-Pacific Accelerating | Medium Term (2–4 Years) |
| Energy Transition Mandates Driving Emissions Monitoring And Carbon-Intensity Optimization | +2.1% | Europe And North America Pressure, Voluntary Uptake In Asia-Pacific And Middle East | Long Term (≥ 4 Years) |
| Digital Twins For Process Debottlenecking And Energy-Efficiency Gains | +1.9% | Global, Strongest Activity In Middle East And Asia-Pacific Refineries | Medium Term (2–4 Years) |
| Workforce Reskilling And Change-Management Programs Accelerating Technology Adoption | +1.5% | Global, With Significant Initiatives In North America And Europe | Long Term (≥ 4 Years) |
| Source: Mordor Intelligence | |||
Artificial Intelligence And Machine Learning Adoption For Predictive Maintenance And Autonomous Operations
Machine learning is reshaping drilling economics by compressing subsurface-modeling cycles from months to weeks and by enabling closed-loop control of weight on bit and rotary speed that lowers cost per well.[1]BP, “Breaking New Ground: Wells, AI and the Automated Upstream,” bp.com SLB and Equinor demonstrated autonomous directional drilling off Brazil, trimming drilling duration by 15% and signaling the next phase of automation maturity. Predictive maintenance delivers equally compelling payback as electric submersible pump algorithms preempt failure signatures, adding hundreds of thousands of barrels in annual output. Saudi Aramco’s artificial intelligence infrastructure, recognized by the World Economic Forum’s Global Lighthouse Network, cut greenhouse-gas intensity at Yanbu Refinery by 23% and maintenance cost at Khurais by 30%. These results prove that artificial intelligence produces dual benefits of lower operating cost and reduced emissions, outcomes that will become mandatory as carbon-price schemes spread to new regions.
Industrial Internet Of Things And Edge Computing For Real-Time Asset Monitoring
Thousands of sensor nodes now blanket wellheads, compressors, and pipeline segments, streaming data to local edge servers that execute anomaly-detection models even when satellite links drop. The Khurais smart field achieved an 18% cut in power use and a 40% reduction in inspection time once always-on Industrial Internet of Things monitoring replaced manual rounds. Coupling drones and wearables with edge analytics slashes inspection duration by up to 90%, freeing skilled labor for higher-value tasks. Edge architectures also underpin methane-leak detection grids that respond to satellite alerts in near real time, a capability becoming critical as new detection rules take effect. Adoption is accelerating because ISO 15926-6:2024 data-exchange compliance now guarantees that sensor telemetry can feed multi-vendor digital twins without custom integration.
Cloud Migration Enabling Scalable Data Integration And Advanced Analytics
Replatforming legacy systems to cloud infrastructure eliminates decades-old data silos, providing elastic compute that shortens reservoir simulation cycles and speeds application rollouts.[2]Deloitte, “Cloud Migration in Oil, Gas and Chemicals,” deloitte.comExxonMobil’s partnership with Cerebre built a cloud-native data fabric that unifies operational and enterprise streams into a single source of truth, enabling predictive maintenance at global scale. TotalEnergies leverages cloud platforms to train large language models on engineering documents, giving engineers generative assistants that retrieve troubleshooting procedures in seconds. Hybrid architectures leave latency-sensitive logic on-premise while exporting analytics workloads to public cloud, satisfying both security and scalability demands in highly regulated markets. As more nations impose data-sovereignty rules, operators are adopting federated-learning techniques that train models without exporting raw subsurface data.
Energy Transition Mandates Driving Emissions Monitoring And Carbon-Intensity Optimization
standards are forcing operators to install continuous-monitoring systems and integrate carbon data into financial reporting.[3]International Energy Agency, “Energy and AI,” iea.org Digital twins at Yanbu Refinery tune furnace firing patterns and minimize flaring, cutting greenhouse-gas output without sacrificing throughput. Process-simulation twins allow refiners to test hydrogen co-firing, carbon-capture retrofits, and steam electrification before committing capital, turning compliance into a margin-protection lever. Integrated carbon-accounting platforms connect operational data to sustainability-reporting frameworks, automating disclosures that investors increasingly demand. As carbon pricing spreads into Asia-Pacific and North America, emissions-optimization software will shift from optional to essential.
Restraints Impact Analysis*
| Restraint | (~) % Impact On CAGR Forecast | Geographic Relevance | Impact Timeline |
|---|---|---|---|
| Cybersecurity Vulnerabilities In Operational Technology And Information Technology Convergence | -1.3% | Global, Acute On Offshore Platforms And Aging Onshore Assets | Short Term (≤ 2 Years) |
| Legacy System Integration Complexity And High Upfront Costs | -0.9% | North America And Europe Brownfield Sites, Emerging In Asia-Pacific | Medium Term (2–4 Years) |
| Workforce Resistance And Skill Gaps Hindering Digital Rollouts | -0.7% | Global, Particularly In Mature Brownfield Operations | Medium Term (2–4 Years) |
| Capital-Allocation Constraints And Stringent Payback Expectations | -0.5% | Global, With Heightened Scrutiny In Cost-Sensitive Shale And Deepwater Projects | Short Term (≤ 2 Years) |
| Source: Mordor Intelligence | |||
Cybersecurity Vulnerabilities In Operational Technology And Information Technology Convergence
Many distributed-control and supervisory-control systems were engineered before network connectivity existed, leaving them without authentication, encryption, or intrusion detection. The National Institute of Standards and Technology’s SP 800-82 offers mitigation guidance, but retrofitting air-gapped platforms requires capital that smaller producers lack. Satellite links on offshore facilities widen the attack surface, letting adversaries manipulate safety interlocks or disrupt production at distance. Regulators now urge zero-trust architectures that authenticate every device, yet these frameworks demand joint governance by information-technology and operational-technology teams. Until companies close this gap, boards will scrutinize any project that connects production assets to cloud analytics, slowing rollouts that would otherwise lift efficiency.
Legacy System Integration Complexity And High Upfront Costs
Brownfield refineries often run control logic on hardware no longer supported by vendors, making sensor retrofits risky without unplanned shutdowns. Data silos force operators to build costly middleware and manually cleanse historian archives before analytics models can learn. Capital-allocation trade-offs further limit budgets because many chief financial officers demand paybacks under two years. Bain and Company recommends sequencing pilots to self-fund broader modernization, but this stretches enterprise-wide transformation across multiple budget cycles. [4]Bain and Company, “Digital Oil and Gas,” bain.com Workforce skepticism about algorithmic recommendations also slows adoption, requiring visible executive sponsorship and extensive change-management programs.
*Our forecasts treat driver/restraint impacts as directional, not additive. The impact forecasts reflect baseline growth, mix effects, and variable interactions.
Segment Analysis
By Component: Services Drive Implementation Excellence
Services revenue is expanding at a 12.62% CAGR, surpassing software in growth because implementation success hinges on system integration, cybersecurity hardening, and workforce training. Software still led with 44.53% digital transformation market share in 2025, reflecting ongoing demand for reservoir simulators, digital twins, and Internet of Things middleware. Yet operators discovered that licenses alone do not yield value without domain specialists who contextualize data and remodel workflows. The growing complexity of hybrid cloud and edge architectures intensifies the requirement for managed services that monitor infrastructure, recalibrate models, and respond to cyber incidents. Hardware spending remains necessary for ruggedized sensors and high-performance compute clusters, but growth moderates as scalable cloud platforms displace on-premise data centers. As transformation programs scale, vendors blending advisory, implementation, and outcome-based managed services will capture a rising portion of budgets, positioning services to continue outpacing software for the remainder of the forecast window.
Longer term, the services-to-software spending ratio is set to widen because operators treat transformation as a continuous journey rather than a finite program. Performance-based contracts that peg fees to production-uplift or emissions-cut targets align vendor incentives with operator outcomes, deepening strategic relationships. These factors suggest that the digital transformation market size for services could approach parity with software spending before 2031. System integrators and oilfield-services majors are therefore acquiring niche software firms to lock in domain expertise and secure annuity revenue streams once hardware procurement flattens. The shift elevates organizational change-management and process re-engineering to board-level priorities.


By Technology: Artificial Intelligence Overtakes Internet Of Things As Value Migrates Up The Stack
Internet of Things deployments delivered 26.37% of 2025 spending, but the largest value migration is shifting toward artificial intelligence and machine learning, which are growing at 13.01% per year. Routine dashboarding is giving way to predictive and prescriptive analytics that automate decision-making across drilling, production, and refining. Generative artificial intelligence assistants now parse decades of engineering documents to propose troubleshooting steps within seconds, a leap that reduces mean-time-to-repair and lifts uptime. Blockchain and distributed ledgers remain niche, limited to commodity trading and joint-venture accounting use cases. Big-data platforms, though foundational, are increasingly bundled inside higher-value artificial intelligence offerings instead of being deployed as standalone solutions. As operators master data governance, artificial intelligence’s share will expand because its algorithms learn continuously, exploiting every new sensor stream and domain dataset. The surge confirms that digital transformation market size growth is now anchored in cognition and automation rather than connectivity alone.
Market dynamics favor vendors with pre-trained models that embed physics-based constraints, reducing the data required for accurate predictions in sparse environments. Those models gain further advantage when coupled with edge computing, enabling safety-critical decisions such as automatic well shut-ins to occur locally without cloud latency. Over the next five years, autonomous operations will become standard on high-cost offshore assets where incremental recovery has oversized impact on project economics. Consequently, artificial intelligence is expected to absorb an ever-greater slice of budgets, overtaking Internet of Things as the primary engine of value.
By Application: Downstream Refineries Accelerate Digital Twin Uptake
Upstream remained the largest spender with 38.81% of 2025 outlays, driven by drilling-optimization and reservoir-management analytics that directly influence recovery factors. However, downstream facilities are racing ahead on growth, expanding at 12.23% annually as digital twins uncover capacity bottlenecks and optimize furnace firing for both margin and emissions. Saudi Aramco lifted refinery capacity by 100,000 barrels per day after deploying an Aspen Technology twin, illustrating downstream’s late-mover advantage in harnessing mature twin frameworks. Refiners also use scenario-based twins to simulate hydrogen blending, carbon-capture integration, and electrification, shortening engineering cycles for major decarbonization projects. Midstream players trail in spending because pipelines operate at thinner margins and with simpler process profiles, yet leak-detection mandates and flow-optimization analytics are beginning to nudge budgets upward. As fuel margins tighten and carbon-cost pass-through constraints grow, downstream digital spending is poised to outpace upstream, cementing process digital twins as a core tool for profitability and compliance.
Increasing electric-vehicle penetration and biofuel blending targets put additional pressure on refiners to squeeze every basis point of yield. Digital twins that assimilate live data from distributed-control systems empower operators to shift cut points, tweak catalyst ratios, and manage energy consumption in real time. This capability is critical for meeting scope-1 emissions targets without sacrificing output. Consequently, downstream’s share of the digital transformation market in the oil and gas industry will keep rising through 2031 as refineries embrace twin-driven operational excellence.
By Deployment Mode: Hybrid-Cloud Architectures Tip Momentum Toward Cloud
On-premise solutions controlled 61.54% of 2025 spend because air-gapped environments underpin safety-critical controls. Yet cloud deployments are gaining ground at an 11.91% CAGR as hybrid architectures separate latency-sensitive logic from compute-intensive analytics. Operators now replicate historian data to public-cloud lakes where large-scale simulations run on demand, slashing time-to-insight while respecting control-system isolation. Data-sovereignty rules in China and India prompt national oil companies to adopt “local cloud” regions or anonymized federated-learning approaches that keep sensitive data behind sovereign firewalls. Edge computing rounds out the architecture by executing first-line anomaly detection on the asset, then synchronizing results to cloud once connectivity allows. As confidence in cloud security and performance grows, its share of digital transformation market size will rise steadily, especially for upstream analytics and customer-facing applications where elasticity and continuous delivery matter more than millisecond response.
Cloud hyperscalers are sweetening the proposition with industry accelerators: pre-built data models, reservoir-simulation engines, and emissions-reporting templates that shorten deployment cycles. Concurrently, operators find that pay-per-use economics better align with volatile drilling programs than fixed on-premise capital expenditures. Together, these factors point toward a tipping point around 2028 when cloud overtakes on-premise for new digital workloads, though mission-critical control layers will likely remain physically isolated.
Geography Analysis
North America retained the largest slice of 2025 spending at 33.53%, propelled by shale operators that rely on data-driven completion designs and oil-sands producers optimizing steam-assisted gravity drainage. Adoption momentum benefits from deep pools of digital talent, ready availability of cloud regions, and financial markets that reward efficiency gains. The region’s capital discipline pushes operators to embrace predictive maintenance and autonomous drilling to sustain output in a cost-inflation environment. United States federal methane rules also accelerate uptake of emissions-monitoring software, intertwining compliance and profitability considerations.
Asia-Pacific, registering the fastest 12.68% CAGR, is undergoing a structural modernization wave as national oil companies in China, India, and Southeast Asia revamp legacy assets to meet liquefied natural gas export schedules and expanding power-sector decarbonization pledges. Governments encourage domestic cloud alternatives, but partnerships with global hyperscalers still flourish through joint ventures that localize data. Regional talent gaps spur system integrators to bundle turnkey solutions that include workforce training. Rising cyber-threat awareness and the need to document carbon intensity before shipping cargoes to Europe further lift digital budgets. Collectively, these factors will elevate Asia-Pacific’s share of digital transformation market size over the next five years.
Europe directs a sizable portion of spend toward emissions-optimization because of stringent trading-scheme costs and dwindling North Sea production. Operators deploy predictive-maintenance suites and reservoir-optimization artificial intelligence to stretch asset life. Meanwhile, Middle Eastern giants such as Saudi Aramco and Abu Dhabi National Oil Company treat digital transformation as national-diversification strategy, embedding Fourth Industrial Revolution technologies in flagship projects and earning Global Lighthouse Network recognition. South America and Africa presently contribute smaller shares, but Brazil’s deepwater campaign and West Africa’s frontier acreage rely heavily on autonomous operations to cut development cost. Overall, competitive dynamics and regulatory pressure ensure that every region will deepen digital investment, with Asia-Pacific narrowing the gap on North America fastest.

Competitive Landscape
Competition is moderate and multi-layered, encompassing oilfield-services majors, independent software vendors, cloud hyperscalers, system integrators, and niche cybersecurity specialists. SLB, Halliburton, and Baker Hughes tie digital offerings to their equipment portfolios, turning hardware pull-through into software annuity streams. SLB’s 2025 agreement to purchase RESMAN Energy Technology brings parts-per-trillion tracer surveillance into its production suite, increasing switching costs for customers who adopt its integrated diagnostics. Independent vendors such as Cognite, Aspen Technology, and Emerson secure multi-year platform agreements with Aker BP, TotalEnergies, and Shell, embedding their digital twins and industrial artificial intelligence into core workflows. Cloud providers Amazon Web Services, Microsoft Azure, and Google Cloud intensify rivalry by releasing pre-built accelerators that shrink time-to-value.
Cross-industry interest is growing: Intercontinental Exchange’s pursuit of Enverus at a USD 6 billion valuation shows financial-market recognition of energy data platforms. Private equity and corporate buyers alike now treat digital capability as a strategic asset, as evidenced by EY’s 2025 CEO survey highlighting generative artificial intelligence integration in merger-and-acquisition pipelines. Cybersecurity for operational technology remains an under-served niche where specialized vendors gain traction because mainstream tools lack protocol awareness for Modbus, OPC, or proprietary control buses. Emissions-monitoring software and carbon-accounting platforms represent another growth pocket, propelled by emerging disclosure regimes. Vendors that comply with ISO 15926-6:2024 data-exchange and NIST SP 800-82 control-system security guidelines gain competitive edge by easing integration risk.
Strategic alliances are equally important. ExxonMobil’s partnership with Cerebre to build a digital backbone illustrates the gravitation toward collaborative ecosystems rather than single-vendor lock-ins. At the same time, oilfield-services firms are investing in start-ups through corporate venturing arms to capture upside while retaining optionality. Competitive intensity will heighten as pilots move into scaled deployment, but differentiation will rest on proven domain expertise, cybersecurity rigor, and change-management capability rather than purely on technology features.
Leaders of Digital Transformation Market In The Oil And Gas Industry
IBM Corporation
Microsoft Corporation
Cognizant Technology Solutions
Hewlett Packard Enterprise
SAP SE
- *Disclaimer: Major Players sorted in no particular order

Recent Industry Developments
- January 2026: Deloitte highlighted that 86% of corporate and private-equity leaders now embed generative artificial intelligence into merger-and-acquisition workflows, underscoring the rising value of digital capability in deal evaluation.
- November 2025: BP published its automated upstream strategy detailing machine-learning-guided drilling that lowers well cost and non-productive time.
- November 2025: Saudi Aramco’s five Global Lighthouse Network facilities achieved 23% greenhouse-gas cuts at Yanbu Refinery and 30% maintenance savings at Khurais.
- April 2025: SLB and Shell broadened their partnership to deploy AI deepwater drilling solutions across multiple basins.
- September 2025: SLB agreed to acquire RESMAN Energy Technology, adding wireless tracer diagnostics to its production portfolio.


Scope of Report on Digital Transformation Market In The Oil And Gas Industry
The Digital Transformation Market in the Oil and Gas Industry Report is Segmented by Component (Software, Services, Hardware), Technology (Internet of Things, Artificial Intelligence and Machine Learning, Big Data Analytics, Blockchain, Cloud Computing), Application (Upstream, Midstream, Downstream), Deployment Mode (On-Premise, Cloud), and Geography (North America, Europe, Asia-Pacific, Middle East and Africa, South America). The Market Forecasts are Provided in Terms of Value (USD).
| Hardware |
| Software |
| Services |
| Analytics |
| Artificial Intelligence and Machine Learning |
| Internet of Things |
| Cloud and Edge Computing |
| Industrial Robotics |
| Cybersecurity |
| Other Technologies |
| Upstream |
| Midstream |
| Downstream |
| On-Premise |
| Cloud |
| North America | United States |
| Canada | |
| Mexico | |
| South America | Brazil |
| Argentina | |
| Rest of South America | |
| Europe | United Kingdom |
| Norway | |
| Germany | |
| Rest of Europe | |
| Asia-Pacific | China |
| India | |
| Japan | |
| South Korea | |
| Rest of Asia-Pacific | |
| Middle East | United Arab Emirates |
| Saudi Arabia | |
| Rest of Middle East | |
| Africa | South Africa |
| Kenya | |
| Rest of Africa |
| By Component | Hardware | |
| Software | ||
| Services | ||
| By Technology | Analytics | |
| Artificial Intelligence and Machine Learning | ||
| Internet of Things | ||
| Cloud and Edge Computing | ||
| Industrial Robotics | ||
| Cybersecurity | ||
| Other Technologies | ||
| By Application | Upstream | |
| Midstream | ||
| Downstream | ||
| By Deployment Mode | On-Premise | |
| Cloud | ||
| By Geography | North America | United States |
| Canada | ||
| Mexico | ||
| South America | Brazil | |
| Argentina | ||
| Rest of South America | ||
| Europe | United Kingdom | |
| Norway | ||
| Germany | ||
| Rest of Europe | ||
| Asia-Pacific | China | |
| India | ||
| Japan | ||
| South Korea | ||
| Rest of Asia-Pacific | ||
| Middle East | United Arab Emirates | |
| Saudi Arabia | ||
| Rest of Middle East | ||
| Africa | South Africa | |
| Kenya | ||
| Rest of Africa | ||


Key Questions Answered in the Report
How large is the digital transformation market in the oil and gas industry today?
The market reached USD 79.84 billion in 2026 and is on track to hit USD 138.18 billion by 2031.
What is the expected CAGR for digital investments by oil and gas companies?
Spending is forecast to rise at an 11.59% CAGR between 2026 and 2031.
Which region is growing fastest in adopting digital solutions?
Asia-Pacific leads with a 12.68% CAGR as national oil companies modernize assets and expand liquefied natural gas infrastructure.
Why are services outpacing software growth?
Integration complexity, cybersecurity requirements, and workforce-change needs drive demand for consulting, implementation, and managed services that expand at 12.62% annually.
What technology area is attracting the most incremental dollars?
Artificial intelligence and machine learning are growing 13.01% per year as operators move beyond dashboards to predictive maintenance and autonomous operations.
How are emissions regulations influencing digital spending?
Operators invest in continuous monitoring, digital twins, and carbon-accounting platforms to meet new methane and carbon-intensity disclosure rules, turning compliance into a margin-protection lever.
Page last updated on:


