Surface Disinfectant Market Size and Share
Market Overview
| Study Period | 2020 - 2031 |
|---|---|
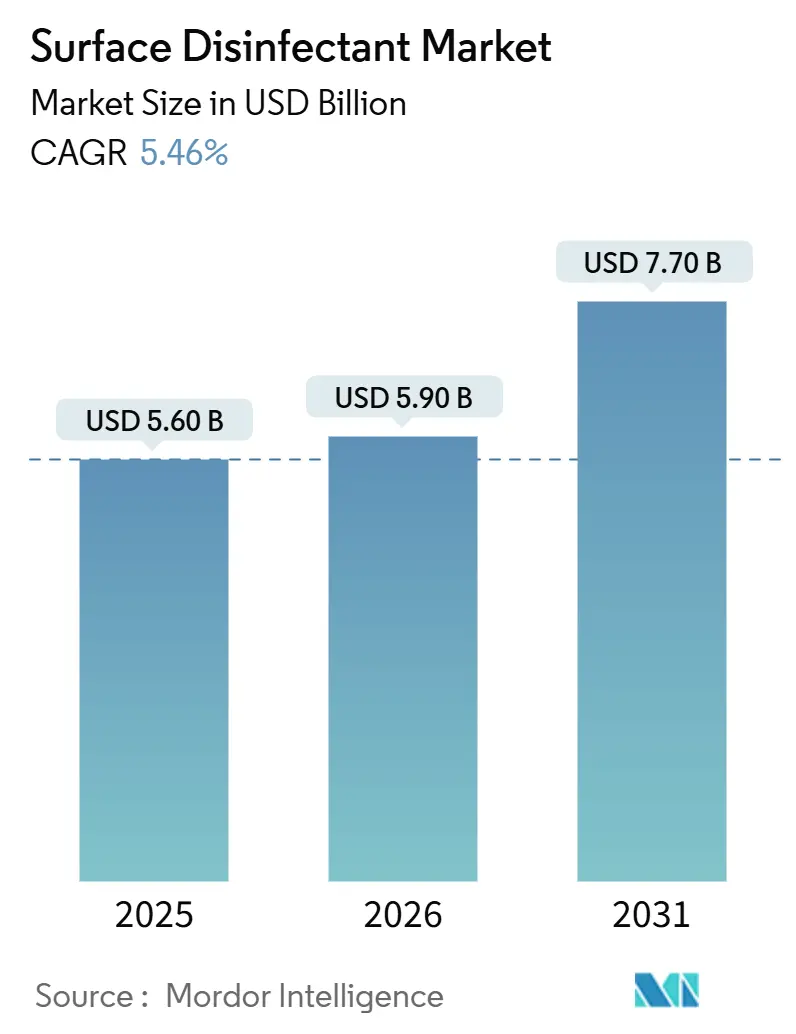
| Market Size (2026) | USD 5.90 Billion |
| Market Size (2031) | USD 7.70 Billion |
| Growth Rate (2026 - 2031) | 5.46% CAGR |
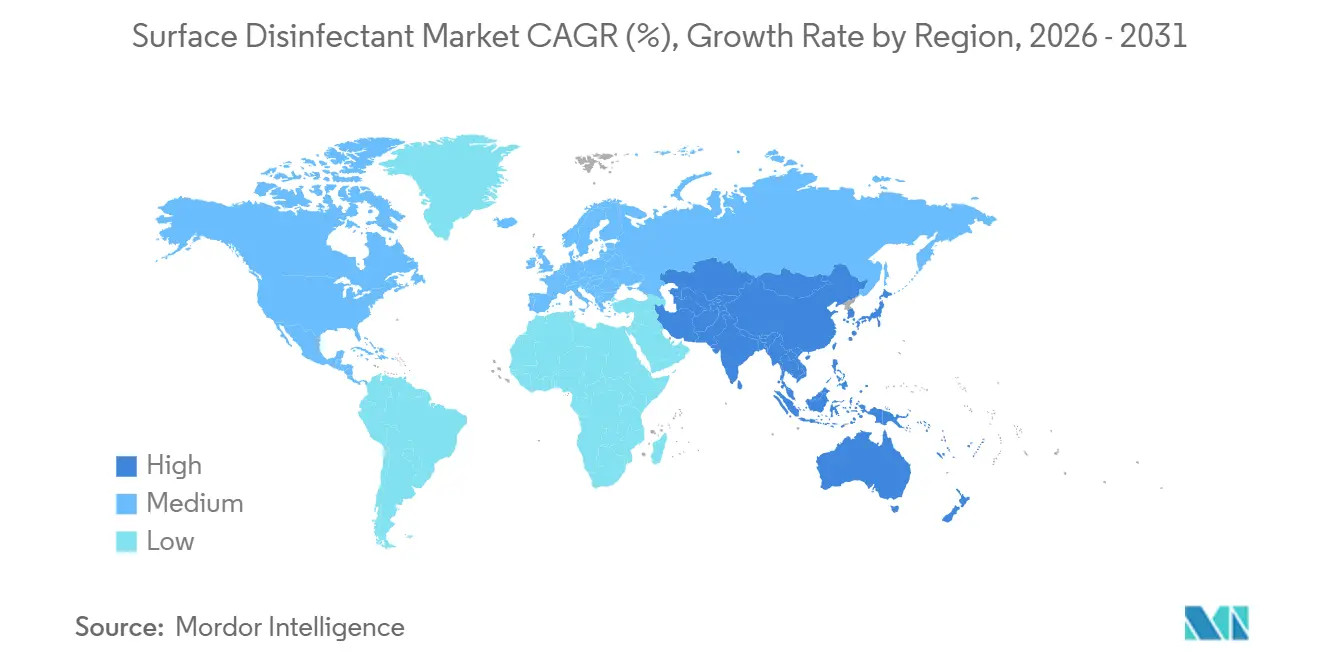
| Fastest Growing Market | Asia Pacific |
| Largest Market | North America |
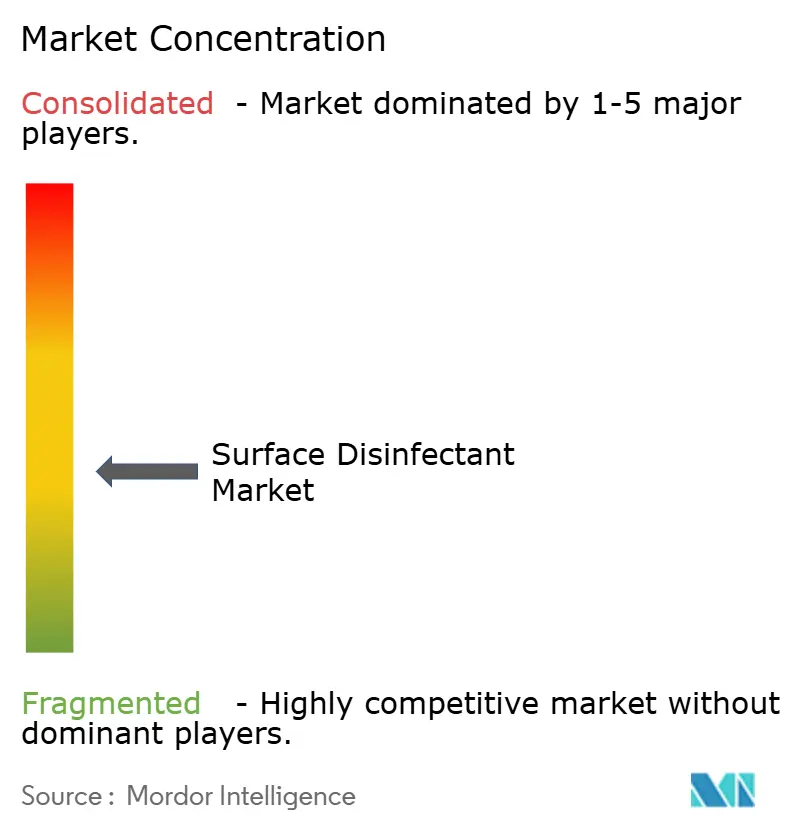
| Market Concentration | Medium |
Major Players *Disclaimer: Major Players sorted in no particular order Image © Mordor Intelligence. Reuse requires attribution under CC BY 4.0. | |
Surface Disinfectant Market Analysis by Mordor Intelligence
The Surface Disinfectant Market size is expected to increase from USD 5.60 billion in 2025 to USD 5.90 billion in 2026 and reach USD 7.70 billion by 2031, growing at a CAGR of 5.46% over 2026-2031.
The surface disinfectant market continues to benefit from heightened infection-control vigilance, rising surgical volumes, and the shift toward residue-free chemistries that satisfy both regulatory and sustainability benchmarks. Alcohol-based formulations remain the revenue cornerstone because they dry fast and need no rinse, yet peroxide systems are capturing incremental adoption as hospitals and pharmaceutical plants look for broad-spectrum kill without quaternary ammonium (QAC) disclosure risk. Payers are steering elective procedures into outpatient centers, so procurement managers in those sites are buying higher-end wipes and foams that mirror inpatient performance, while subscription e-commerce contracts lock in replenishment cycles and enable transparent price benchmarking across multi-site portfolios. Suppliers are also embedding Internet-of-Things (IoT) sensors in dispensers, turning chemistry compliance data into an audit tool that justifies premium pricing in cost-sensitive environments.
Key Report Takeaways
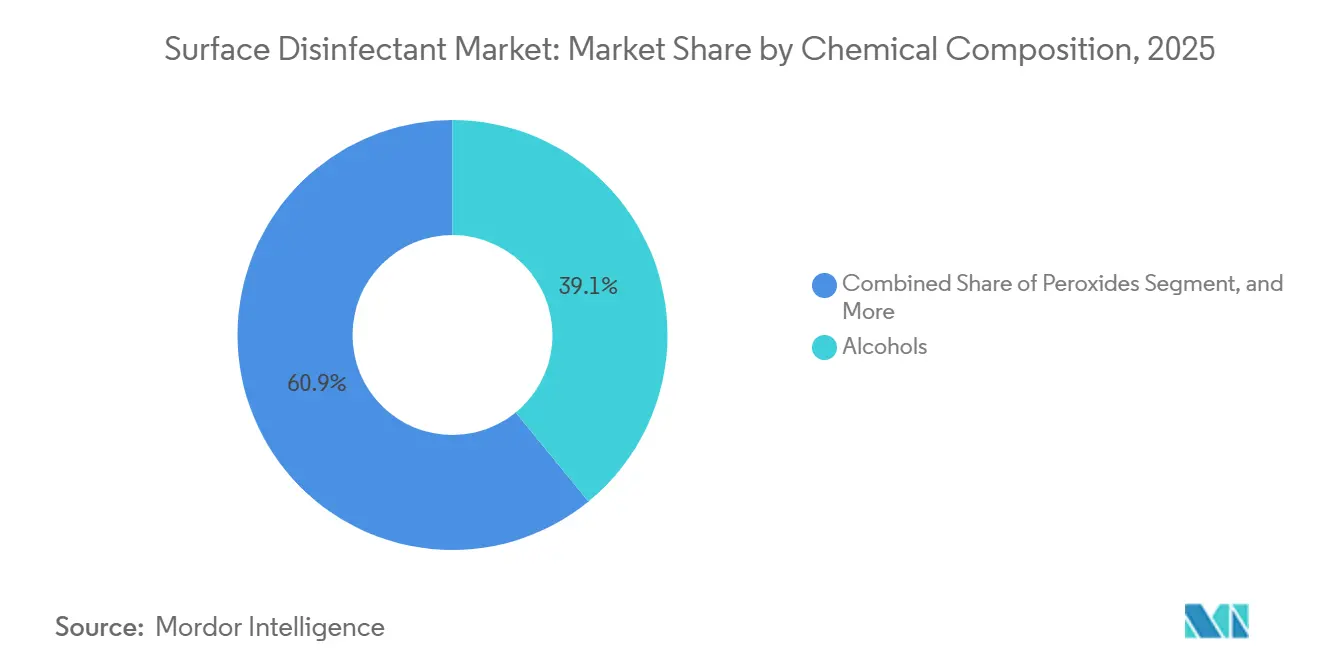
- By chemical composition, alcohols led with 39.10% of the surface disinfectant market share in 2025. Peroxide chemistries are projected to expand at a 7.80% CAGR between 2026 and 2031.
- By form, liquid concentrates accounted for 43.2% of the surface disinfectants market in 2025, whereas sprays and aerosols are advancing at an 8.5% CAGR to 2031.
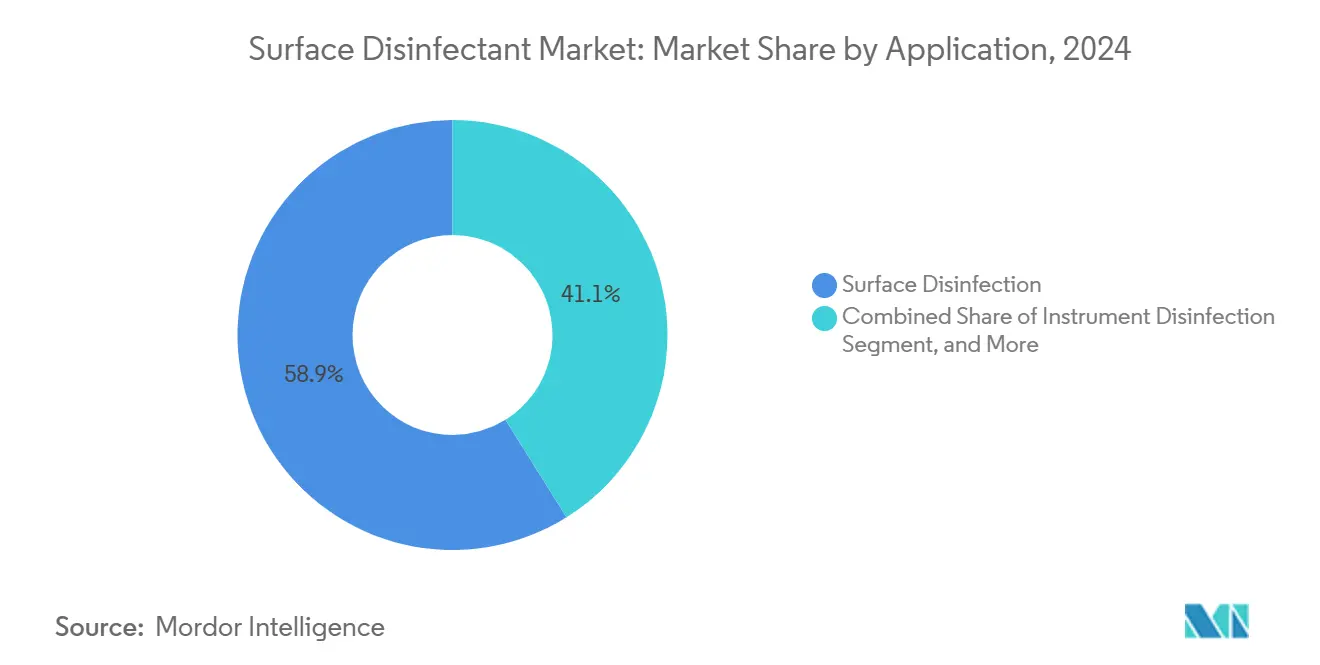
- By application, surface disinfection accounted for 58.90% of revenue in 2025, whereas instrument disinfection is forecast to grow at a 7.05% CAGR through 2031.
- By end user, hospitals and clinics retained a 25.05% end-user share in 2025, while ambulatory centers are advancing at a 6.67% CAGR over 2026-2031.
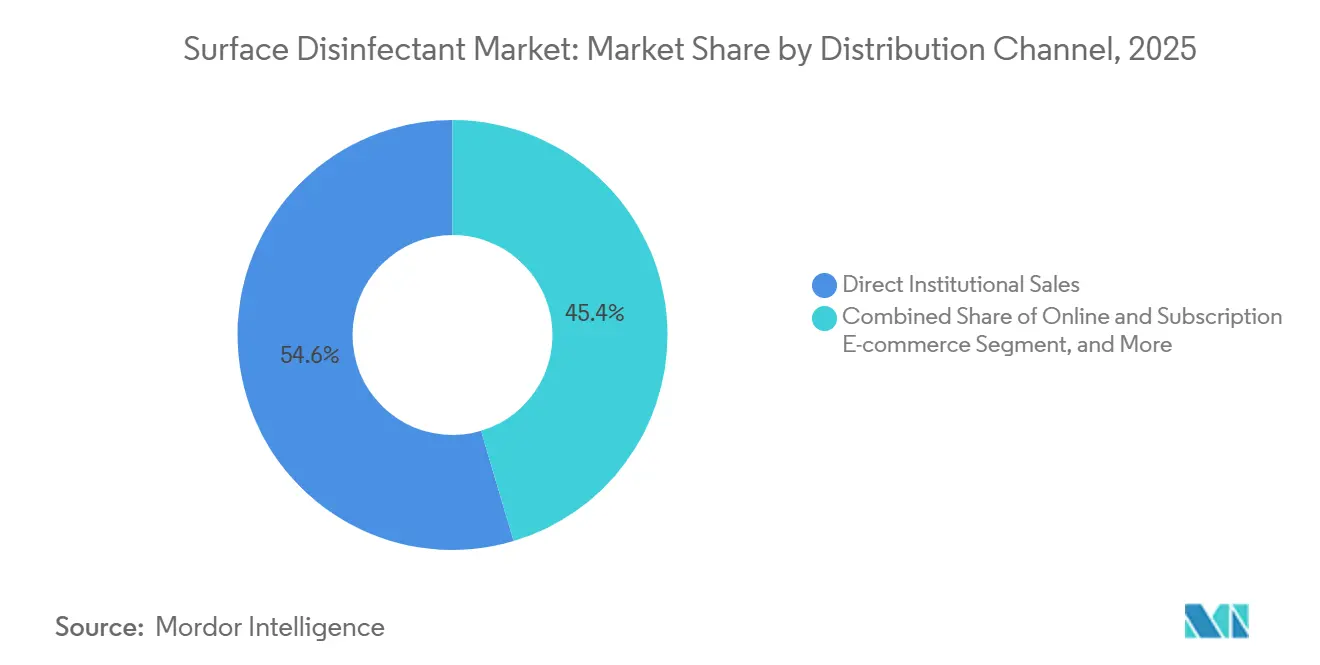
- By distribution channel, direct institutional sales accounted for 54.6% of the surface disinfectants market share in 2025, with online and e-commerce channels forecast to grow at a 10.6% CAGR through 2031.
- North America accounted for 34.70% of global revenue in 2025; Asia-Pacific is tracking the fastest expansion at an 8.90% CAGR through 2031.
Note: Market size and forecast figures in this report are generated using Mordor Intelligence’s proprietary estimation framework, updated with the latest available data and insights as of January 2026.
Global Surface Disinfectant Market Trends and Insights
Drivers Impact Analysis*
| DRIVER | (~) % IMPACT ON CAGR FORECAST | GEOGRAPHIC RELEVANCE | IMPACT TIMELINE |
|---|---|---|---|
| Rising incidence of hospital-acquired infections | +1.2% | Global, acute in North America & Europe | Medium term (2-4 years) |
| Growth in surgical procedures & chronic-care admissions | +0.9% | Global, led by Asia-Pacific & North America | Long term (≥ 4 years) |
| Stringent infection-control regulations in emerging markets | +0.8% | China, India, Brazil, Middle East | Medium term (2-4 years) |
| Post-pandemic hygiene-budget normalization at elevated baseline | +0.7% | Global | Short term (≤ 2 years) |
| Adoption of IOT-enabled smart-disinfection compliance systems | +0.4% | North America & Europe | Long term (≥ 4 years) |
| Subscription-based replenishment models | +0.3% | North America & Europe, emerging Asia-Pacific | Medium term (2-4 years) |
| Source: Mordor Intelligence | |||
Rising Incidence of Hospital-Acquired Infections
Hospitals globally face ongoing pressure to reduce infections associated with central lines, catheters, and surgical sites. These infections impose an annual financial burden of USD 28 to 45 billion on the U.S. healthcare system. In 2024, surveillance data indicated a 9% decline in central-line infections and a 10% reduction in catheter-related infections. However, surgical-site infections following abdominal hysterectomies increased by 8%, highlighting that generalized QAC protocols may fail to address procedure-specific infection vectors.[1]Centers for Disease Control and Prevention, “National HAI Progress Report,” cdc.gov Patients in low- and middle-income countries experience infection risks up to 20 times higher than those in wealthier nations. As a result, peroxide and alcohol blends dominate high-income markets, while hypochlorite solutions maintain cost leadership in other regions. Additionally, Medicare penalizes hospitals in the highest infection quartile by withholding up to 3% of payments, making infection prevention a critical factor in protecting revenue and justifying investments in premium disinfectants. These factors collectively drive the surface disinfectant market's sustained growth trajectory.
Growth in Surgical Procedures & Chronic-Care Admissions
By 2030, global surgical volumes are expected to surpass 400 million annually, driven by aging populations and expanded healthcare access in key markets such as China and India. In the United States, minimally invasive techniques now account for over 60% of elective abdominal procedures. In the Asia-Pacific region, hospital admissions for chronic conditions, including diabetes, cardiovascular, and pulmonary diseases, are increasing by 4-5% annually. This trend is extending hospital stays and driving higher chemistry consumption per bed-day. In 2024, outpatient centers in the United States performed 28 million procedures, up from 23 million in 2020.[2]Organisation for Economic Co-operation and Development, “Health Statistics 2024,” oecd.org These facilities are required to comply with the same Joint Commission protocols as inpatient wards, further expanding the market for surface disinfectants.
Stringent Infection-Control Regulations in Emerging Markets
In 2024, China implemented regulations requiring quarterly surface sampling for hospital infections and introduced fines for exceeding colony-forming unit thresholds. This policy shift transforms infection control from a recommended practice to a financial responsibility, driving consistent demand from the country's 36,000 hospitals. Similarly, India’s 2025 guidelines aim to enhance procurement standards by mandating that district hospitals maintain chemical inventory logs subject to audit, creating opportunities for global suppliers. In Brazil, updated accreditation standards in 2024 now link disinfectant protocols to licensing, triggering increased spending in private clinics that previously lacked adequate equipment.
Post-Pandemic Hygiene-Budget Normalization at Elevated Baseline
Although panic stockpiling due to COVID-19 has subsided, facility budgets for disinfectants remain 15-20% higher than 2019 levels, driven by the impact of visible cleaning on patient satisfaction scores. In 2024, the NHS finalized contracts worth USD 4.4 billion, covering cleaning consumables and ensuring multi-year volume stability for suppliers. Additionally, a survey indicated that 68% of facility managers intend to maintain or increase disinfectant spending through 2026, despite the stabilization of office occupancy rates.
Restraints Impact Analysis*
| RESTRAINT | (~) % IMPACT ON CAGR FORECAST | GEOGRAPHIC RELEVANCE | IMPACT TIMELINE |
|---|---|---|---|
| Toxicity & environmental scrutiny of chlorine & QAC chemistries | −0.6% | North America & Europe, spreading to Asia-Pacific | Medium term (2-4 years) |
| Tariff volatility & raw-material supply disruptions | −0.4% | Global, ethanol & QAC feedstocks | Short term (≤ 2 years) |
| Emergence of disinfectant-tolerant microbial strains | −0.5% | High-use healthcare & food sites | Long term (≥ 4 years) |
| Surface-compatibility issues with sensitive electronics & finishes | −0.3% | Pharma, electronics plants | Short term (≤ 2 years) |
| Source: Mordor Intelligence | |||
Toxicity & Environmental Scrutiny of Chlorine & QAC Chemistries
In 2024, the U.S. EPA proposed restrictions on 14 QAC pesticide products due to violations related to aquatic toxicity. At the same time, California introduced requirements for front-label disclosures of QACs, accelerating the transition toward alternatives like hydrogen peroxide and peracetic acid. In 2025, European regulators are set to review benzalkonium and didecyldimethylammonium chloride, with potential EU-wide concentration limits anticipated by 2027.[3]European Chemicals Agency, “Restriction Dossier for QACs 2025,” echa.europa.eu Furthermore, peer-reviewed studies in 2024 identified QAC-resistance genes in hospital wastewater, driving committees to adopt more frequent rotations of chemical formulations.
Emergence of Disinfectant-Tolerant Microbial Strains
Research demonstrates that sub-lethal exposure to QACs (Quaternary Ammonium Compounds) drives efflux-pump mutations, which also contribute to antibiotic resistance. This trend reduces the operational lifespan of single-chemistry protocols. Additionally, biofilms on high-touch surfaces can decrease disinfectant penetration by up to 1,000 times, resulting in real-world performance that often falls short of labeled claims. This gap leads to over-application, which accelerates the development of tolerance. Moreover, carbapenem-resistant Enterobacteriaceae isolates from intensive care units are now exhibiting increased minimum inhibitory concentrations of QACs, emphasizing the importance of adopting multi-chemistry rotation strategies.
*Our forecasts treat driver/restraint impacts as directional, not additive. The impact forecasts reflect baseline growth, mix effects, and variable interactions.
Segment Analysis
By Chemical Composition: Peroxide Chemistries Gain on Alcohol Dominance
Hydrogen peroxide and peracetic acid solutions are expanding at a 7.80% CAGR, the swiftest among actives, and are on track to capture USD 2.55 billion of the surface disinfectant market size by 2031. Alcohols remained the revenue leader in 2025 because they offer quick kill and no rinse, but flammability and surface-drying concerns limit penetration in electronics and food plants. Quaternary ammonium compounds still dominate cost-sensitive geographies because they undercut peroxide prices by 30-50%, although rising regulatory scrutiny is nudging North American and European buyers toward peroxide and alcohol blends.


By Form: Sprays & Foams Outpace Traditional Liquids
In 2025, liquid concentrates commanded a 43.2% share of the Surface Disinfectants market, making them the largest formulation segment by market size, thanks to their cost-to-coverage efficiency. Facilities prefer liquids for floor-mopping systems and central dilution stations because dosing precision supports audit compliance. A side benefit is that large packs reduce packaging disposal volumes, aligning with healthcare sustainability pledges and indirectly limiting landfill surcharges. By retaining liquids as the baseline, vendors secure predictable raw-material purchasing, a factor that cushions margin volatility. Sprays and aerosols are projected to grow at an 8.5% CAGR through 2031, making them the fastest-growing formulation segment within the Surface Disinfectants industry.
By Application: Instrument Disinfection Accelerates Amid Surgical Volume Growth
Instrument disinfection is advancing at a 7.05% CAGR as reusable endoscopes and robotic-assisted ports require rapid high-level disinfection between patients. Peracetic acid and ortho-phthalaldehyde solutions that kill spores in under 12 minutes protect capital equipment while meeting modern throughput targets. Surface disinfection still captured 58.90% of 2025 revenue, but commoditization compresses margins, pushing vendors to add digital audit trails, staff training, and pathogen-mapping analytics as service layers to defend pricing.
By End-User: Ambulatory Centers Drive Fastest Adoption
Ambulatory surgery centers are expanding at a 6.67% CAGR because insurers push elective orthopedic, ophthalmic, and GI cases to lower-cost settings that must still meet Joint Commission benchmarks. These sites install hospital-grade dispensers and buy branded, one-minute-kill wipes to reduce liability risk, even though procedure volume per site is lower than that of tertiary hospitals. Hospitals and clinics accounted for 25.05% of 2025 revenue but negotiate multi-year contracts that bundle chemistry, dispensers, and IoT analytics to secure volume discounts.
By Distribution Channel: E-Commerce Disrupts Institutional Procurement
Subscription e-commerce is growing at 10.60% CAGR, the fastest of any segment, as buyers automate reorders and benchmark prices across networks, trimming procurement cycle time by up to 40%. Direct institutional sales accounted for only 54.60% of 2025 revenue, but retain higher gross margins because suppliers can embed switching costs through hardware leasing and on-site training bundles. Specialty distributors remain dominant among mid-size hospitals and commercial buildings, yet their share is slipping as platform operators overlay logistics with analytics dashboards that small suppliers can leverage to penetrate integrated delivery networks.
Geography Analysis
By Geography: North America Leads the Market
North America retained a 34.7% share of the surface disinfectants market in 2025, with reimbursement rules tying infection-prevention metrics to funding levels, effectively institutionalising demand. Hospital purchasing groups increasingly issue tenders that bundle liquid concentrates, ready-to-use wipes, and electrostatic sprayer fluids under a single contract, an arrangement that favours suppliers offering complete portfolios. The region is also a first mover in adopting hydrogen peroxide vapour decontamination for isolation rooms, thereby increasing the average revenue per disinfected square metre. Suppliers notice that state procurement teams now request carbon-footprint disclosures alongside efficacy data, signalling that environmental metrics may soon influence bid scoring as strongly as price.
Asia-Pacific is projected to deliver an 8.9% CAGR between 2025 and 2030, the fastest regional pace in the Surface Disinfectants market. Government incentives supporting new hospital construction in China, India, and Indonesia are translating into early-stage framework agreements with disinfectant vendors, embedding long-run revenue visibility. Local producers leverage familiarity with fragmented distribution networks to win tenders in secondary cities, yet premium international brands still dominate tertiary-level facilities. Because construction codes now specify built-in disinfection storage and dispensing systems, upfront chemical specifications are being locked in during architectural tendering, a nuance that reorders sales cycles. Incremental demand from pharmaceutical cleanrooms and medical-device factories adds a parallel industrial revenue stream, allowing suppliers to amortise formulation R&D across both end markets.
Europe remains a regulatory bellwether, guiding ingredient restrictions and efficacy testing protocols that often prefigure global norms. Regional emphasis on circular packaging has spurred concentrated refills and cardboard canisters, practices that later migrate to North America once proven viable. Southern and Eastern European hospitals, facing tighter capital budgets, opt for mixed approaches that combine legacy chlorine solutions for non-critical areas with peroxide wipes in intensive care units, demonstrating how cost-tiering strategies shape vendor portfolios. In March 2024, the European Chemicals Agency advanced proposals to reclassify quaternary ammonium compounds, a move that could accelerate product reformulation cycles and spur demand for alternative actives. The continent’s variable reimbursement structures, from single-payer to mixed systems, create a patchwork market that rewards suppliers adept at tailoring value propositions by country.

Competitive Landscape
The Surface Disinfectants industry is moderately consolidated, with the top five companies accounting for a significant but not dominating portion of global revenue, leaving room for regional challengers. Market leaders increasingly compete on integrated solutions that pair chemicals with IoT-enabled dispensers, elevating switching costs while generating usage data that lengthens renewal cycles. Larger players lock in innovation pipelines by operating both basic-chemistry plants and formulation centres, ensuring supply continuity even during periods of feedstock volatility. This upstream control became a differentiator during recent solvent shortages, earning customer goodwill and reinforcing premium pricing positions.
Strategic acquisitions illustrate how incumbents seek vertical and horizontal coverage. Medline’s USD 950 million purchase of Ecolab’s surgical solutions unit in April 2024 provided immediate access to operating-room specialists, demonstrating that portfolio breadth can be bought faster than organically built. Such deals often include technical-service teams, which are critical for on-site protocol optimisation and create entrenched relationships that newcomers struggle to displace. However, transaction integration risks exist, as overlapping sales forces can confuse hospital buyers unless account mapping is carefully managed.
Technology disruptors focused on UV-C and electrostatic platforms exert competitive pressure by making chemical-reduction claims that are attractive to sustainability-minded clients. Incumbent chemical brands counter by launching private-label devices or acquiring minority stakes in hardware innovators, signalling a convergence of product categories. An unstated but observable trend is that venture-backed start-ups license patented nozzle geometries or wavelength-specific UV-C emitters to larger distributors, using royalty income to fund next-generation prototypes. The resulting ecosystem blurs traditional boundaries, making future Surface Disinfectants market-share calculations contingent on how analysts classify hybrid offerings.
Surface Disinfectant Industry Leaders
Ecolab Inc.
3M Company
Reckitt Benckiser Group plc
STERIS plc
The Clorox Company
- *Disclaimer: Major Players sorted in no particular order

Recent Industry Developments
- February 2026: EnvirOx introduced OxiGenesis Hyper-Concentrate, a four-dilution solution that eliminates 99% of facility cleaning and disinfection SKUs, with no PPE needed at use-dilution.
- January 2026: Harrison launched a professional wet-wipes line manufactured in Great Britain for industrial cleaning applications.
- January 2026: Ultraviolet Devices Inc. debuted its V-MIX upper-room air disinfection unit at the AHR Expo in Las Vegas.
- October 2025: Metrex released CaviCide HP, a one-minute contact hydrogen-peroxide surface disinfectant covering 70 pathogens.
- September 2025: Wipro Consumer Care rolled out MaxKleen 2-in-1 Floor Cleaner in India, combining disinfectant action with insect repellence.


Research Methodology Framework and Report Scope
Market Definitions and Key Coverage
Our study defines the surface disinfectant market as the global sales value of chemical or bio-based formulations, liquids, wipes, powders, sprays, and aerosols, applied to inert surfaces in healthcare, commercial, and household settings to inactivate bacteria, fungi, and viruses.
Scope Exclusion: Products meant solely for skin antisepsis or instrument sterilization units are outside this market's boundary.
Segmentation Overview
- By Chemical Composition
- Quaternary Ammonium Compounds
- Hypochlorite
- Alcohols
- Aldehydes
- Peroxides (Hydrogen & Peracetic Acid)
- Phenolic Compounds
- Iodine Compounds
- By Form
- Liquids (Dilutable & RTU)
- Wipes
- Sprays & Foams
- Tablets & Powdered Concentrates
- By Application
- Surface Disinfection
- Instrument Disinfection
- Air & Room Decontamination
- Food-Contact Surface Sanitization
- By End-User
- Hospitals & Clinics
- Outpatient & Ambulatory Surgical Centers
- Diagnostic Laboratories
- Pharmaceutical & Biotechnology Manufacturing
- Food & Beverage Processing Facilities
- Commercial & Institutional Buildings
- Residential / Household
- By Distribution Channel
- Direct Institutional Sales
- Specialty Distributors
- Retail (Super/Hypermarkets)
- Online & Subscription E-commerce
- By Geography
- North America
- United States
- Canada
- Mexico
- Europe
- Germany
- United Kingdom
- France
- Italy
- Spain
- Rest of Europe
- Asia-Pacific
- China
- India
- Japan
- Australia
- South Korea
- Rest of Asia-Pacific
- Middle East and Africa
- GCC
- South Africa
- Rest of Middle East and Africa
- South America
- Brazil
- Argentina
- Rest of South America
- North America
Detailed Research Methodology and Data Validation
Primary Research
Mordor analysts interviewed infection-control nurses, facilities managers, distributors, and raw-material suppliers across North America, Europe, and Asia Pacific. These conversations verified average selling prices, typical usage rates per surgery suite, and regional procurement cycles, letting us close data gaps spotted in desk work.
Desk Research
We began with public domain datasets such as the CDC's National Healthcare Safety Network on hospital-acquired infections, UN Comtrade shipment codes for disinfectant HS categories, Eurostat production indices, and WHO hospital bed density statistics. Trade association releases from the American Cleaning Institute, peer-reviewed articles in the Journal of Hospital Infection, and annual reports filed with the SEC added company-level benchmarks. Subscription resources like D&B Hoovers and Dow Jones Factiva supplied revenue splits and recent product launches. This list is illustrative; many further sources informed data checks and clarifications.
Market-Sizing & Forecasting
A top-down reconstruction anchored on 2024 surface disinfectant production, trade flows, and average consumption per occupied hospital bed was built. It was then cross-checked with bottom-up snapshots from sampled manufacturer revenues and e-commerce channel volumes. Key variables include surgical procedure counts, HAI incidence, healthcare capital spending, raw-material price indices, seasonality in influenza outbreaks, and regulatory approvals of novel chemistries. Forecasts rely on multivariate regression layered with scenario analysis, with elasticities vetted by primary experts. Where supplier data were patchy, we applied regional penetration rates derived from facility audits before adjusting totals to balance the model.
Data Validation & Update Cycle
Outputs pass three-layer reviews: automated variance flags, peer analyst scrutiny, and research manager sign-off. Reports refresh yearly, and interim updates trigger when material events or price shocks occur. A final sense-check is completed just before publication to ensure clients receive the freshest view.
Why Our Surface Disinfectant Baseline Commands Reliability
Published figures often diverge because firms pick different product mixes, price bases, and refresh cadences.
Key gap drivers in this space include whether wipes sold through retail are counted, how average selling prices are derived in inflationary quarters, and the frequency with which hospital usage ratios are recalibrated for post-pandemic traffic shifts. Mordor's model uses current regional ASPs and an annual refresh, whereas some sources keep pre-COVID assumptions or rely on single-country proxies.
Benchmark comparison
| Market Size | Anonymized source | Primary gap driver |
|---|---|---|
| USD 5.60 B (2025) | Mordor Intelligence | - |
| USD 3.04 B (2025) | Global Consultancy A | Retail wipes excluded; conservative ASP sourced from 2021 contracts |
| USD 6.18 B (2024) | Trade Journal B | Forecast baseline dated; hospital bed growth not re-benchmarked post-pandemic |
| USD 5.85 B (2023) | Industry Source C | Volume extrapolated from North America to global without regional modifiers |
Taken together, the comparison shows that when scope, price base, and refresh cadence are harmonized, Mordor's balanced middle-path estimate offers decision-makers a dependable, traceable starting point that avoids both aggressive inflation and outdated undercounts.


Key Questions Answered in the Report
How large will the surface disinfectant market be by 2031?
It is projected to reach USD 7.70 billion by 2031 under a 5.46% CAGR.
Which chemical category is growing fastest?
Peroxide formulations are rising at a 7.80% CAGR as hospitals and pharma plants favor residue-free, low-toxicity options.
Why is Asia-Pacific attracting the highest growth?
China and India are adding thousands of new hospital beds under public-insurance expansion, and both countries have tightened infection-control rules that require certified disinfectants.
What channel is disrupting institutional procurement?
Subscription-based e-commerce platforms are growing at 10.60% CAGR by automating reorder cycles and offering price transparency.
Which end-user group is expanding quickest?
Ambulatory surgery centers lead with a 6.67% CAGR because payers shift elective procedures to lower-cost, outpatient settings that must still follow hospital-grade protocols.
How are regulators affecting QAC use?
The U.S. EPA and European agencies are reviewing or restricting certain QACs for environmental toxicity, prompting a shift toward peroxide and alcohol chemistry.
Page last updated on:


