Sugar Beet Market Size and Share
Sugar Beet Market Analysis by Mordor Intelligence
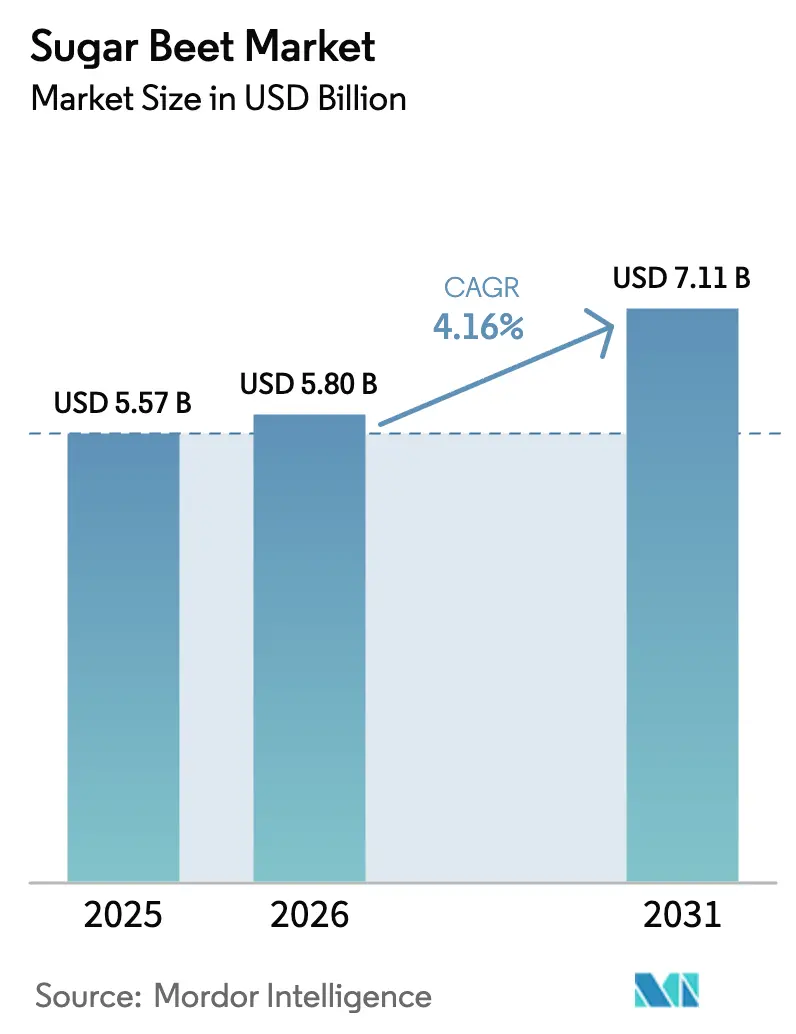
The sugar beet market size was valued at USD 5.57 billion in 2025 and estimated to grow from USD 5.80 billion in 2026 to reach USD 7.11 billion by 2031, at a CAGR of 4.16% during the forecast period (2026-2031). Demand growth now centers on extracting greater value from existing acreage rather than expanding cropland, as processors deploy precision agriculture and advanced seed technologies to raise sucrose recovery rates[1]Source: European Commission, “A Vision for Agriculture and Food,” europa.eu . Robust biofuel mandates and yield-boosting genetic technology are sustaining revenue growth even as cane sugar retains a structural cost edge. Rising demand from confectionery manufacturers, expanding biofuel mandates, and broader sustainability goals further underpin the expansion of the sugar beet market. European producers continue to modernize processing lines and shift pulp into advanced ethanol, unlocking higher per-metric-ton margins while reducing exposure to volatile refined-sugar prices. Asia-Pacific growers, led by China and India, are experimenting with cold-tolerant hybrids, opening new northern acreage and diversifying domestic sugar supply. Meanwhile, North American cooperatives shield growers with loan-rate support while still expanding planted area by co-locating ethanol units that monetize molasses streams. Capital-intensive factories limit new entrants, so incumbent processors leverage data analytics and precision agronomy to compress cost curves and defend regional share. Competitive pressure from duty-free Ukrainian imports, however, is eroding European Union producer margins and hastening a pivot toward higher-value product lines.
Key Report Takeaways
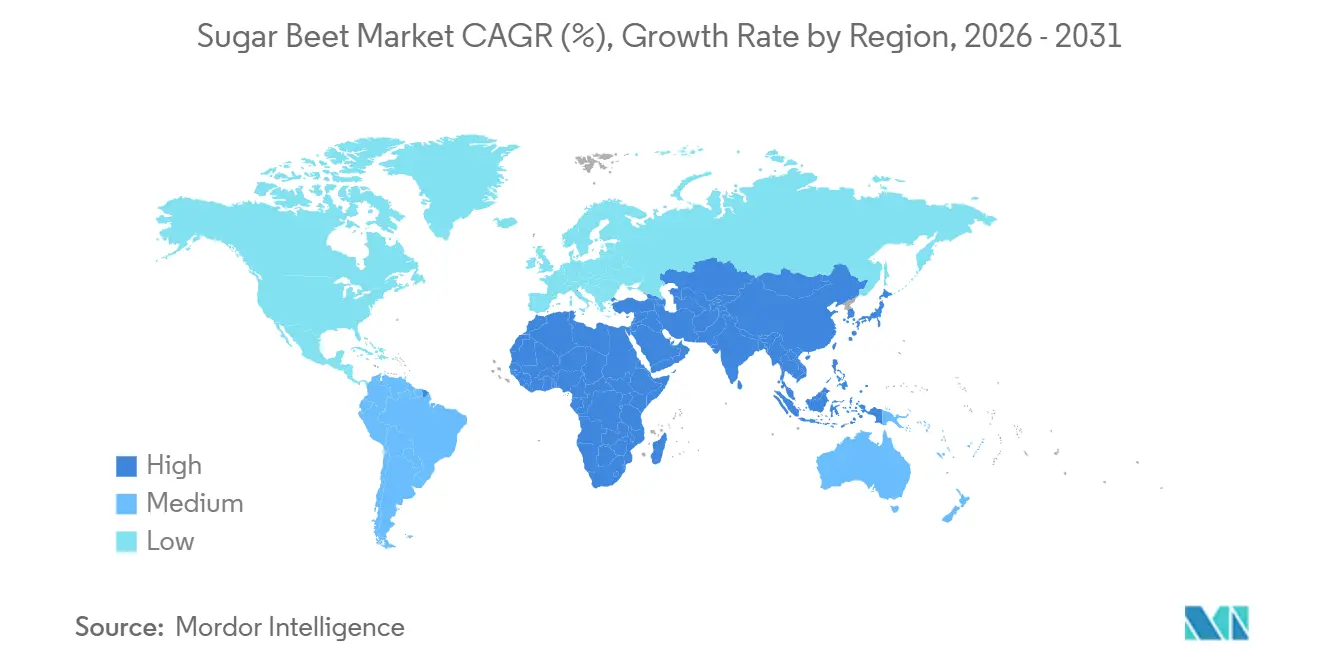
- By geography, Europe held 37% of the sugar beet market share in 2025, while Asia-Pacific is forecast to expand at a 6.3% CAGR through 2031.
Note: Market size and forecast figures in this report are generated using Mordor Intelligence’s proprietary estimation framework, updated with the latest available data and insights as of January 2026.
Global Sugar Beet Market Trends and Insights
Drivers Impact Analysis*
| Driver | (~) % Impact on CAGR Forecast | Geographic Relevance | Impact Timeline |
|---|---|---|---|
| Government biofuel blending mandates | +0.8% | Europe, North America, Asia-Pacific pilot programs | Medium term (2-4 years) |
| Expanding global demand for confectionery sugar | +0.6% | Global, strongest in Europe and North America | Long term (≥ 4 years) |
| Adoption of high-yield hybrid and GMO beet seeds | +0.9% | Europe and North America, trials in China | Short term (≤ 2 years) |
| Direct cultivation subsidies in the European Union | +0.7% | France, Germany, Poland and other member states | Medium term (2-4 years) |
| Rising use of beet pulp in high-fiber animal feed | +0.5% | Europe dairy belts, United States cattle feedlots | Long term (≥ 4 years) |
| Proliferation of micro-ethanol distilleries using beet feedstock | +0.4% | Europe and North America, pilot projects in Turkey | Short term (≤ 2 years) |
| Source: Mordor Intelligence | |||
Government biofuel blending mandates
Blending policies are reshaping demand as regulators tie energy security to decarbonization efforts. The United States Renewable Fuel Standard keeps ethanol output near 1.05 million barrels per day, anchoring the economics of beet-derived ethanol. Canada’s Clean Fuel Regulations pushed 2024 ethanol use 43% above 2021 levels, extending a stable outlet for beet processors. France’s E10 gasoline reached 52% retail share in 2025, absorbing an extra 180,000 metric tons of beet ethanol. In India, a 20% blend target set for 2025-2026 remains despite temporary cane-use limits, which are increasing interest in beet feedstock. Demonstration plants in California have validated low-carbon beet ethanol pathways that post attractive carbon intensity scores. Collectively, mandates create a price floor that shields growers when food sugar demand softens.
Expanding global demand for confectionery sugar
Urbanization and higher disposable incomes in emerging markets are driving rapid growth in confectionery, especially in the Asia-Pacific region, where India alone is projected to consume 31 million metric tons of sugar in 2025. China’s confectionery consumption rose 4.2% in 2024, and Inner Mongolia beet sugar met 12% of industrial demand, shielding manufacturers from tariff volatility. Beet sugar’s consistent quality profile is prized for premium chocolate and bakery items that require tight color and purity specifications. European processors have responded by introducing specialized grades, and Tate and Lyle Sugars posted 57% revenue growth in 2023-2024, partly from this higher-margin portfolio. Egypt’s plan to operate a 900,000 metric tons beet sugar complex illustrates how demographic expansion galvanizes new capacity to meet confectionery demand.
Adoption of high-yield hybrid and GMO beet seeds
Biotech advances are lifting yields and reducing costs. Roughly 95% of United States acreage already uses herbicide-tolerant genetically modified (GMO) traits that simplify weed control and reduce pesticide use. Breeders expect multi-trait seeds by 2026 to add disease resistance and higher sugar content, potentially lifting output 10-15%. Russian research institutes have cut breeding cycles to five years using in-vitro propagation, speeding the release of climate-ready cultivars. Drone-based phenotyping programs in Belgium and the Netherlands match new varieties to micro-climate zones, further optimizing field performance. Herbicide-tolerant and virus-resistant genetics are narrowing the yield gap between top and median growers.
Direct cultivation subsidies in the European Union
The Common Agricultural Policy cushions growers against price swings through income support and coupled payments. The Commission’s 2025 vision paper reaffirmed its commitment to targeted aid for strategic crops, including sugar beet. The Common Agricultural Policy 2023-2027 earmarks EUR 387 billion (USD 410 billion) for farm supports, and 10 member states channel coupled payments to sugar beet producers. France pays EUR 60 per hectare (USD 64 per hectare) for eco-schemes such as cover crops that raise organic matter and lift beet yields 4%. Tereos raised beet purchase prices to EUR 48.16 per metric ton (USD 52.98) in 2024 to retain grower loyalty, a hike partly enabled by subsidy frameworks. Premiums are even higher in France’s small organic beet segment, where prices average EUR 80 (USD 88) per metric ton. Subsidies, therefore, remain vital to sustaining EU acreage amid international competition.
Restraints Impact Analysis*
| Restraint | (~) % Impact on CAGR Forecast | Geographic Relevance | Impact Timeline |
|---|---|---|---|
| Competition from lower-cost sugarcane | -0.6% | Europe, Asia-Pacific cane regions | Long term (≥ 4 years) |
| Volatile global sugar price cycles | -0.5% | Global | Short term (≤ 2 years) |
| Shrinking skilled farm labor in core European regions | -0.4% | France, Germany, Poland | Medium term (2-4 years) |
| Stricter water-use regulations in semi-arid beet belts | -0.3% | Spain, Italy, Turkey, northern China | Medium term (2-4 years) |
| Source: Mordor Intelligence | |||
Competition from lower-cost sugarcane
Tropical producers enjoy structural cost advantages that intensify trade pressure on temperate beet operations. Brazil produced 42.56 million metric tons of cane sugar in 2024/25 at USD 0.12 per pound, pricing 30% below European beet sugar and prompting safeguard petitions when quarterly imports exceed 1.3 million metric tons[2]Source: UNICA, “2024/25 Harvest Data,” unica.com.br. Liberalized trade broadens access to this cheaper supply, eroding beet margins, particularly in Asia, where cane output is expanding. Nevertheless, beet remains competitive in climates unsuited to cane and offers rotations that improve soil health in mixed-crop systems.
Volatile global sugar price cycles
Sugarcane’s structural advantages, including higher yields and lower production costs, put pressure on European sugar beet producers. Cane mills benefit from cogeneration systems that reduce energy costs, while beet refineries face higher expenses for purchased fuel. Intercontinental Exchange (ICE) raw sugar averaged 19.48 cents per pound in January 2025, down from a March 2024 peak of 23.7 cents as the market flipped to a 3.2 million-metric-ton surplus. The short beet harvesting season concentrates fixed costs into a limited timeframe, intensifying margin volatility. Government support in cane-growing regions further cushions producers from price fluctuations, which heavily impact beet farmers. Climate change may widen the cane’s competitive edge, increasing risks for beet growers in traditional regions, connecting structural advantages with market dynamics.
*Our forecasts treat driver/restraint impacts as directional, not additive. The impact forecasts reflect baseline growth, mix effects, and variable interactions.
Geography Analysis
Europe continues to anchor the sugar beet market with a 37% share in 2025, as acreage stabilizes and environmental regulations tighten. France harvested 30.5 million metric tons of roots in 2024 on 405,000 hectares at 80.5 metric tons per hectare, maintaining profitability via minimum pricing contracts that offset a spring drought in Hauts-de-France. The sugar beet market in Europe benefits from ethanol diversification, as demonstrated by Sudzucker’s Offstein plant, which now dedicates 25 million liters of molasses to fuel. Investments such as Tereos’s EUR 800 million (USD 880 million) in 2024, decarbonization roadmap also underscore the sector’s commitment to climate goals.
Asia-Pacific offers the most dynamic momentum at 6.3% CAGR. In India, two-thirds of districts face drought risk that challenges cane, making tropical beet varieties attractive for double-cropping systems and ethanol diversification. China’s northern provinces yield near 19 metric tons per hectare, while global leaders yield above 70 metric tons, leaving a wide technology adoption runway. Rising urban demand and supportive policy frameworks are anticipated to raise regional beet acreage through 2030. Japan, South Korea, and several members of the Association of Southeast Asian Nations rely almost entirely on sugar imports, making them potential candidates for adopting temperate beet cultivation if land-use policies were to change. Regional processors are small, so partnerships with European technology providers could accelerate scale and widen the sugar beet market.
North America will experience steady growth during the coming years. Cooperative models ensure alignment between growers and processors, and satellite imagery partnerships enable near-real-time crop monitoring across thousands of farms. The 2024 campaign achieved record yields of 79.57 metric tons per hectare in the Red River Valley, though plant closures, such as the Spreckels site in California, highlight regional cost disparities. Canada’s clean fuel standard adds incremental demand for beet-based ethanol, while water-use constraints in western states drive adoption of drip irrigation and drought-resistant genetics. Climate variability remains a major point, though irrigation infrastructure in Idaho and Colorado buffers yield swings better than the rain-fed European belts.


Competitive Landscape
Seed genetics are highly concentrated, while processing remains regionally entrenched. KWS SAAT, Strube, SESVanderHave, and Florimond Desprez control the majority of European and North American beet seed sales, with KWS’s CONVISO SMART platform alone capturing a major part of German demand in 2024 after demonstrating single-pass weed control that saved growers USD 127 per hectare. The European Patent Office granted KWS a patent in 2024 that stacks nematode resistance and bolting tolerance, strengthening its intellectual property moat through 2038[3]Source: European Patent Office, “Patent EP3420104 Grant,” epo.org. Processing is moderately concentrated, with Tereos, Nordzucker, Südzucker, and Pfeifer and Langen accounting for more than half of European crush capacity but facing thin margins because factories are geographically locked in and expensive to repurpose. Tereos showed ethanol contributed 18% of sugar-division EBITDA in 2024, illustrating how fuel diversification boosts return on capital.
Asia-Pacific remains fragmented, with 12 Inner Mongolia processors averaging a significant amount of annual capacity and lacking integrated ethanol or feed-pellet lines, which present joint-venture opportunities for European incumbents and equipment suppliers. Gene-editing collaborations, such as British Sugar’s work with Tropic Biosciences in 2023, bypass genetically modified organism regulations and could shorten the time to commercialize traits to 3 years, delivering 18% yield gains without fungicides. In February 2024, the partnership secured EUR 660 thousand (USD 714.2 thousand) in United Kingdom government funding for this research. Precision-agriculture vendors add competitive pressure with John Deere’s Operations Center integrated sugar-beet yield mapping and variable-rate nitrogen in 2024, securing 6% fertilizer savings and 4% yield gains in French trials. Smaller seed firms are losing ground.
Processors and traders are increasingly pivoting toward high-value by-product valorization to insulate themselves from fluctuating raw sugar prices. Global giants such as Südzucker AG, Tereos Group, and Nordzucker AG have transitioned from traditional sugar millers into diversified bioeconomy firms, converting beet pulp and molasses into bioethanol, biogas, and animal feed. Trading activities remain largely regional due to these logistical constraints, though major commodity traders such as Louis Dreyfus Company and Wilmar International maintain significant influence over the international movement of refined beet sugar and specialty derivatives. Upstream suppliers are driving market evolution through technological innovation in seeds and processing equipment. Leading companies such as Syngenta and Nordzucker are prioritizing R&D in precision agriculture, drought-resistant varieties, and energy-efficient extraction technologies. As consumer demand for "clean-label" and non-GMO products rises in 2026, these suppliers are critical in enabling processors to offer certified organic and sustainably sourced beet products that meet tightening global regulatory standards.
Recent Industry Developments
- December 2025: The Circular Bio-based Europe Joint Undertaking (CBE JU) has announced a funding package of EUR 170.7 million (USD 184.7 million) for 2026 to support 13 new bio-based innovation projects. The 2026 work programme emphasizes the development of biorefineries and the diversification of feedstock, including initiatives to valorize agricultural residues such as sugar beet side streams.
- April 2025: Southern Minnesota Beet Sugar Cooperative, based in the United States, began decommissioning its Spreckels Sugar facility in California after sustained losses despite upgrades.
- October 2024: Planet Labs and SatAgro signed a contract with American Crystal Sugar Company for advanced satellite-based crop monitoring for American Crystal Sugar Company's sugar beet crops in the Red River Valley. The contract utilizes PlanetScope data to analyze crop health, growth, and harvest progression.


Global Sugar Beet Market Report Scope
The sugar beet (Beta vulgaris) is a cultivated root crop with high sucrose content. It is grown in temperate climates and serves as a primary source of refined white sugar, second only to sugarcane. The Sugar Beet Market Report is Segmented by Geography (North America, Europe, Asia-Pacific, and More). The Report Includes Production Analysis (Volume), Consumption Analysis (Value and Volume), Export Analysis (Value and Volume), Import Analysis (Value and Volume), Wholesale Price Trend Analysis and Forecast, A List of Key Players, Regulatory Framework, Logistics and Infrastructure, and Seasonality Analysis. The Market Forecasts are Provided in Terms of Value (USD) and Volume (Metric Tons).
| North America | United States | Production Analysis (Area Harvested, Yield, and Production Volume) |
| Consumption Analysis (Consumption Value and Volume) | ||
| Import Market Analysis (Import Value, Volume, and Key Supplying Markets) | ||
| Export Market Analysis (Export Value, Volume, and Key Destination Markets) | ||
| Wholesale Price Trend Analysis and Forecast | ||
| Regulatory Framework | ||
| List of Key Players | ||
| Logistics and Infrastructure | ||
| Seasonality Analysis | ||
| Canada | Production Analysis (Area Harvested, Yield, and Production Volume) | |
| Consumption Analysis (Consumption Value and Volume) | ||
| Import Market Analysis (Import Value, Volume, and Key Supplying Markets) | ||
| Export Market Analysis (Export Value, Volume, and Key Destination Markets) | ||
| Wholesale Price Trend Analysis and Forecast | ||
| Regulatory Framework | ||
| List of Key Players | ||
| Logistics and Infrastructure | ||
| Seasonality Analysis | ||
| South America | Brazil | Production Analysis (Area Harvested, Yield, and Production Volume) |
| Consumption Analysis (Consumption Value and Volume) | ||
| Import Market Analysis (Import Value, Volume, and Key Supplying Markets) | ||
| Export Market Analysis (Export Value, Volume, and Key Destination Markets) | ||
| Wholesale Price Trend Analysis and Forecast | ||
| Regulatory Framework | ||
| List of Key Players | ||
| Logistics and Infrastructure | ||
| Seasonality Analysis | ||
| Mexico | Production Analysis (Area Harvested, Yield, and Production Volume) | |
| Consumption Analysis (Consumption Value and Volume) | ||
| Import Market Analysis (Import Value, Volume, and Key Supplying Markets) | ||
| Export Market Analysis (Export Value, Volume, and Key Destination Markets) | ||
| Wholesale Price Trend Analysis and Forecast | ||
| Regulatory Framework | ||
| List of Key Players | ||
| Logistics and Infrastructure | ||
| Seasonality Analysis | ||
| Europe | Russia | Production Analysis (Area Harvested, Yield, and Production Volume) |
| Consumption Analysis (Consumption Value and Volume) | ||
| Import Market Analysis (Import Value, Volume, and Key Supplying Markets) | ||
| Export Market Analysis (Export Value, Volume, and Key Destination Markets) | ||
| Wholesale Price Trend Analysis and Forecast | ||
| Regulatory Framework | ||
| List of Key Players | ||
| Logistics and Infrastructure | ||
| Seasonality Analysis | ||
| France | Production Analysis (Area Harvested, Yield, and Production Volume) | |
| Consumption Analysis (Consumption Value and Volume) | ||
| Import Market Analysis (Import Value, Volume, and Key Supplying Markets) | ||
| Export Market Analysis (Export Value, Volume, and Key Destination Markets) | ||
| Wholesale Price Trend Analysis and Forecast | ||
| Regulatory Framework | ||
| List of Key Players | ||
| Logistics and Infrastructure | ||
| Seasonality Analysis | ||
| Germany | Production Analysis (Area Harvested, Yield, and Production Volume) | |
| Consumption Analysis (Consumption Value and Volume) | ||
| Import Market Analysis (Import Value, Volume, and Key Supplying Markets) | ||
| Export Market Analysis (Export Value, Volume, and Key Destination Markets) | ||
| Wholesale Price Trend Analysis and Forecast | ||
| Regulatory Framework | ||
| List of Key Players | ||
| Logistics and Infrastructure | ||
| Seasonality Analysis | ||
| Asia-Pacific | China | Production Analysis (Area Harvested, Yield, and Production Volume) |
| Consumption Analysis (Consumption Value and Volume) | ||
| Import Market Analysis (Import Value, Volume, and Key Supplying Markets) | ||
| Export Market Analysis (Export Value, Volume, and Key Destination Markets) | ||
| Wholesale Price Trend Analysis and Forecast | ||
| Regulatory Framework | ||
| List of Key Players | ||
| Logistics and Infrastructure | ||
| Seasonality Analysis | ||
| India | Production Analysis (Area Harvested, Yield, and Production Volume) | |
| Consumption Analysis (Consumption Value and Volume) | ||
| Import Market Analysis (Import Value, Volume, and Key Supplying Markets) | ||
| Export Market Analysis (Export Value, Volume, and Key Destination Markets) | ||
| Wholesale Price Trend Analysis and Forecast | ||
| Regulatory Framework | ||
| List of Key Players | ||
| Logistics and Infrastructure | ||
| Seasonality Analysis | ||
| Middle East | Turkey | Production Analysis (Area Harvested, Yield, and Production Volume) |
| Consumption Analysis (Consumption Value and Volume) | ||
| Import Market Analysis (Import Value, Volume, and Key Supplying Markets) | ||
| Export Market Analysis (Export Value, Volume, and Key Destination Markets) | ||
| Wholesale Price Trend Analysis and Forecast | ||
| Regulatory Framework | ||
| List of Key Players | ||
| Logistics and Infrastructure | ||
| Seasonality Analysis | ||
| Saudi Arabia | Production Analysis (Area Harvested, Yield, and Production Volume) | |
| Consumption Analysis (Consumption Value and Volume) | ||
| Import Market Analysis (Import Value, Volume, and Key Supplying Markets) | ||
| Export Market Analysis (Export Value, Volume, and Key Destination Markets) | ||
| Wholesale Price Trend Analysis and Forecast | ||
| Regulatory Framework | ||
| List of Key Players | ||
| Logistics and Infrastructure | ||
| Seasonality Analysis | ||
| Africa | Egypt | Production Analysis (Area Harvested, Yield, and Production Volume) |
| Consumption Analysis (Consumption Value and Volume) | ||
| Import Market Analysis (Import Value, Volume, and Key Supplying Markets) | ||
| Export Market Analysis (Export Value, Volume, and Key Destination Markets) | ||
| Wholesale Price Trend Analysis and Forecast | ||
| Regulatory Framework | ||
| List of Key Players | ||
| Logistics and Infrastructure | ||
| Seasonality Analysis | ||
| South Africa | Production Analysis (Area Harvested, Yield, and Production Volume) | |
| Consumption Analysis (Consumption Value and Volume) | ||
| Import Market Analysis (Import Value, Volume, and Key Supplying Markets) | ||
| Export Market Analysis (Export Value, Volume, and Key Destination Markets) | ||
| Wholesale Price Trend Analysis and Forecast | ||
| Regulatory Framework | ||
| List of Key Players | ||
| Logistics and Infrastructure | ||
| Seasonality Analysis | ||
| By Geography | North America | United States | Production Analysis (Area Harvested, Yield, and Production Volume) |
| Consumption Analysis (Consumption Value and Volume) | |||
| Import Market Analysis (Import Value, Volume, and Key Supplying Markets) | |||
| Export Market Analysis (Export Value, Volume, and Key Destination Markets) | |||
| Wholesale Price Trend Analysis and Forecast | |||
| Regulatory Framework | |||
| List of Key Players | |||
| Logistics and Infrastructure | |||
| Seasonality Analysis | |||
| Canada | Production Analysis (Area Harvested, Yield, and Production Volume) | ||
| Consumption Analysis (Consumption Value and Volume) | |||
| Import Market Analysis (Import Value, Volume, and Key Supplying Markets) | |||
| Export Market Analysis (Export Value, Volume, and Key Destination Markets) | |||
| Wholesale Price Trend Analysis and Forecast | |||
| Regulatory Framework | |||
| List of Key Players | |||
| Logistics and Infrastructure | |||
| Seasonality Analysis | |||
| South America | Brazil | Production Analysis (Area Harvested, Yield, and Production Volume) | |
| Consumption Analysis (Consumption Value and Volume) | |||
| Import Market Analysis (Import Value, Volume, and Key Supplying Markets) | |||
| Export Market Analysis (Export Value, Volume, and Key Destination Markets) | |||
| Wholesale Price Trend Analysis and Forecast | |||
| Regulatory Framework | |||
| List of Key Players | |||
| Logistics and Infrastructure | |||
| Seasonality Analysis | |||
| Mexico | Production Analysis (Area Harvested, Yield, and Production Volume) | ||
| Consumption Analysis (Consumption Value and Volume) | |||
| Import Market Analysis (Import Value, Volume, and Key Supplying Markets) | |||
| Export Market Analysis (Export Value, Volume, and Key Destination Markets) | |||
| Wholesale Price Trend Analysis and Forecast | |||
| Regulatory Framework | |||
| List of Key Players | |||
| Logistics and Infrastructure | |||
| Seasonality Analysis | |||
| Europe | Russia | Production Analysis (Area Harvested, Yield, and Production Volume) | |
| Consumption Analysis (Consumption Value and Volume) | |||
| Import Market Analysis (Import Value, Volume, and Key Supplying Markets) | |||
| Export Market Analysis (Export Value, Volume, and Key Destination Markets) | |||
| Wholesale Price Trend Analysis and Forecast | |||
| Regulatory Framework | |||
| List of Key Players | |||
| Logistics and Infrastructure | |||
| Seasonality Analysis | |||
| France | Production Analysis (Area Harvested, Yield, and Production Volume) | ||
| Consumption Analysis (Consumption Value and Volume) | |||
| Import Market Analysis (Import Value, Volume, and Key Supplying Markets) | |||
| Export Market Analysis (Export Value, Volume, and Key Destination Markets) | |||
| Wholesale Price Trend Analysis and Forecast | |||
| Regulatory Framework | |||
| List of Key Players | |||
| Logistics and Infrastructure | |||
| Seasonality Analysis | |||
| Germany | Production Analysis (Area Harvested, Yield, and Production Volume) | ||
| Consumption Analysis (Consumption Value and Volume) | |||
| Import Market Analysis (Import Value, Volume, and Key Supplying Markets) | |||
| Export Market Analysis (Export Value, Volume, and Key Destination Markets) | |||
| Wholesale Price Trend Analysis and Forecast | |||
| Regulatory Framework | |||
| List of Key Players | |||
| Logistics and Infrastructure | |||
| Seasonality Analysis | |||
| Asia-Pacific | China | Production Analysis (Area Harvested, Yield, and Production Volume) | |
| Consumption Analysis (Consumption Value and Volume) | |||
| Import Market Analysis (Import Value, Volume, and Key Supplying Markets) | |||
| Export Market Analysis (Export Value, Volume, and Key Destination Markets) | |||
| Wholesale Price Trend Analysis and Forecast | |||
| Regulatory Framework | |||
| List of Key Players | |||
| Logistics and Infrastructure | |||
| Seasonality Analysis | |||
| India | Production Analysis (Area Harvested, Yield, and Production Volume) | ||
| Consumption Analysis (Consumption Value and Volume) | |||
| Import Market Analysis (Import Value, Volume, and Key Supplying Markets) | |||
| Export Market Analysis (Export Value, Volume, and Key Destination Markets) | |||
| Wholesale Price Trend Analysis and Forecast | |||
| Regulatory Framework | |||
| List of Key Players | |||
| Logistics and Infrastructure | |||
| Seasonality Analysis | |||
| Middle East | Turkey | Production Analysis (Area Harvested, Yield, and Production Volume) | |
| Consumption Analysis (Consumption Value and Volume) | |||
| Import Market Analysis (Import Value, Volume, and Key Supplying Markets) | |||
| Export Market Analysis (Export Value, Volume, and Key Destination Markets) | |||
| Wholesale Price Trend Analysis and Forecast | |||
| Regulatory Framework | |||
| List of Key Players | |||
| Logistics and Infrastructure | |||
| Seasonality Analysis | |||
| Saudi Arabia | Production Analysis (Area Harvested, Yield, and Production Volume) | ||
| Consumption Analysis (Consumption Value and Volume) | |||
| Import Market Analysis (Import Value, Volume, and Key Supplying Markets) | |||
| Export Market Analysis (Export Value, Volume, and Key Destination Markets) | |||
| Wholesale Price Trend Analysis and Forecast | |||
| Regulatory Framework | |||
| List of Key Players | |||
| Logistics and Infrastructure | |||
| Seasonality Analysis | |||
| Africa | Egypt | Production Analysis (Area Harvested, Yield, and Production Volume) | |
| Consumption Analysis (Consumption Value and Volume) | |||
| Import Market Analysis (Import Value, Volume, and Key Supplying Markets) | |||
| Export Market Analysis (Export Value, Volume, and Key Destination Markets) | |||
| Wholesale Price Trend Analysis and Forecast | |||
| Regulatory Framework | |||
| List of Key Players | |||
| Logistics and Infrastructure | |||
| Seasonality Analysis | |||
| South Africa | Production Analysis (Area Harvested, Yield, and Production Volume) | ||
| Consumption Analysis (Consumption Value and Volume) | |||
| Import Market Analysis (Import Value, Volume, and Key Supplying Markets) | |||
| Export Market Analysis (Export Value, Volume, and Key Destination Markets) | |||
| Wholesale Price Trend Analysis and Forecast | |||
| Regulatory Framework | |||
| List of Key Players | |||
| Logistics and Infrastructure | |||
| Seasonality Analysis | |||


Key Questions Answered in the Report
What is the current size of the sugar beet market?
The sugar beet market size is USD 5.8 billion in 2025.
How fast will the sugar beet market grow to 2031?
The market is projected to grow at a CAGR of 4.13%, reaching USD 7.1 billion by 2031.
Which region leads sugar beet output today?
Europe commands 37% of global share and benefits from efficient factories and stable grower contracts.
Why do beet processors invest in animal-feed lines?
Beet pulp delivers prebiotic fiber that boosts livestock performance, letting processors earn higher margins by pelletizing residue into premium feed.
Page last updated on:


