Stem Toys Market Size and Share
Market Overview
| Study Period | 2021 - 2031 |
|---|---|
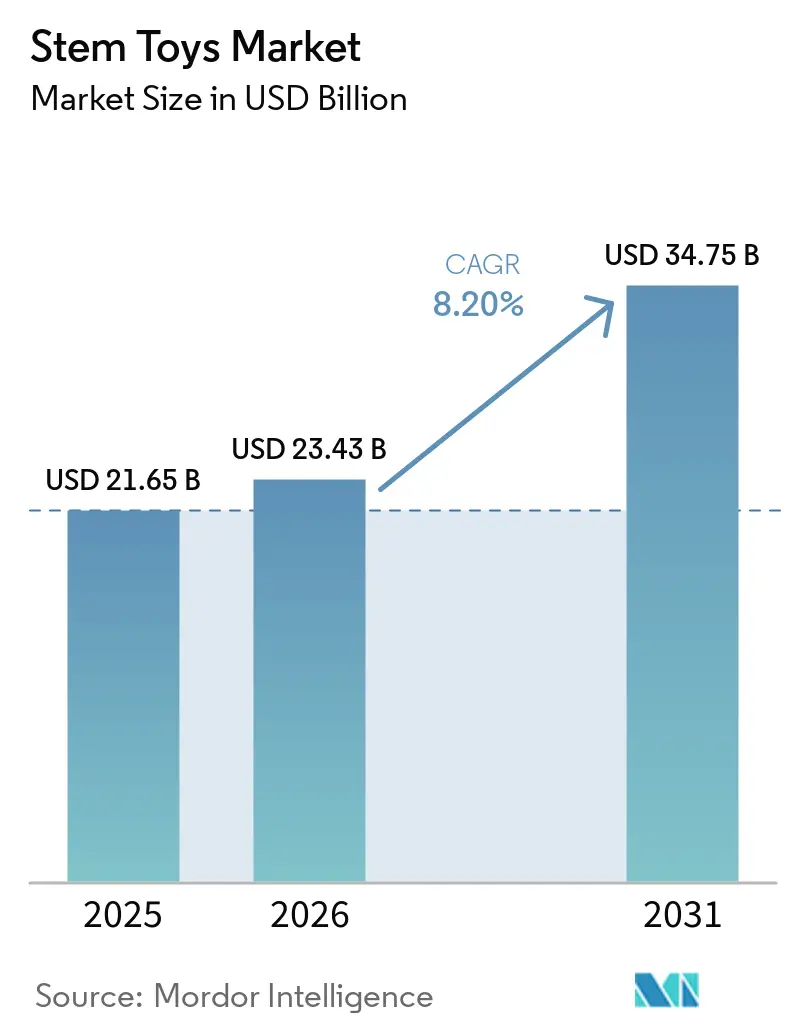
| Market Size (2026) | USD 23.43 Billion |
| Market Size (2031) | USD 34.75 Billion |
| Growth Rate (2026 - 2031) | 8.20% CAGR |
| Fastest Growing Market | Middle East and Africa |
| Largest Market | Asia Pacific |
| Market Concentration | Medium |
Major Players *Disclaimer: Major Players sorted in no particular order Image © Mordor Intelligence. Reuse requires attribution under CC BY 4.0. | |
Stem Toys Market Analysis by Mordor Intelligence
The STEM toy market size was valued at USD 21.65 billion in 2025 and is estimated to grow from USD 23.43 billion in 2026 to reach USD 34.75 billion by 2031, at a CAGR of 8.2% during the forecast period (2026-2031). Expanding K-12 mandates, parental concerns about passive screen time, and the falling cost of AI-enabled learning components are driving spending away from conventional toys toward hands-on robotics and coding kits. Governments are reinforcing this shift: India’s Union Budget 2026 allocated INR 3,200 crore (USD 384 million) to scale Atal Tinkering Labs across 15,000 schools, while the United States National Science Foundation’s 2026-2030 plan prioritizes STEM workforce development. Institutional demand is therefore rising even outside traditional holiday seasons [1]Source: LEGO Group, “LEGO Education CS & AI,” LEGO.com. Rapid AI commoditization, helped by open-source vision-language-action models such as Xiaomi-Robotics-0, now lets mid-tier manufacturers integrate adaptive features once reserved for premium lines.
Key Report Takeaways
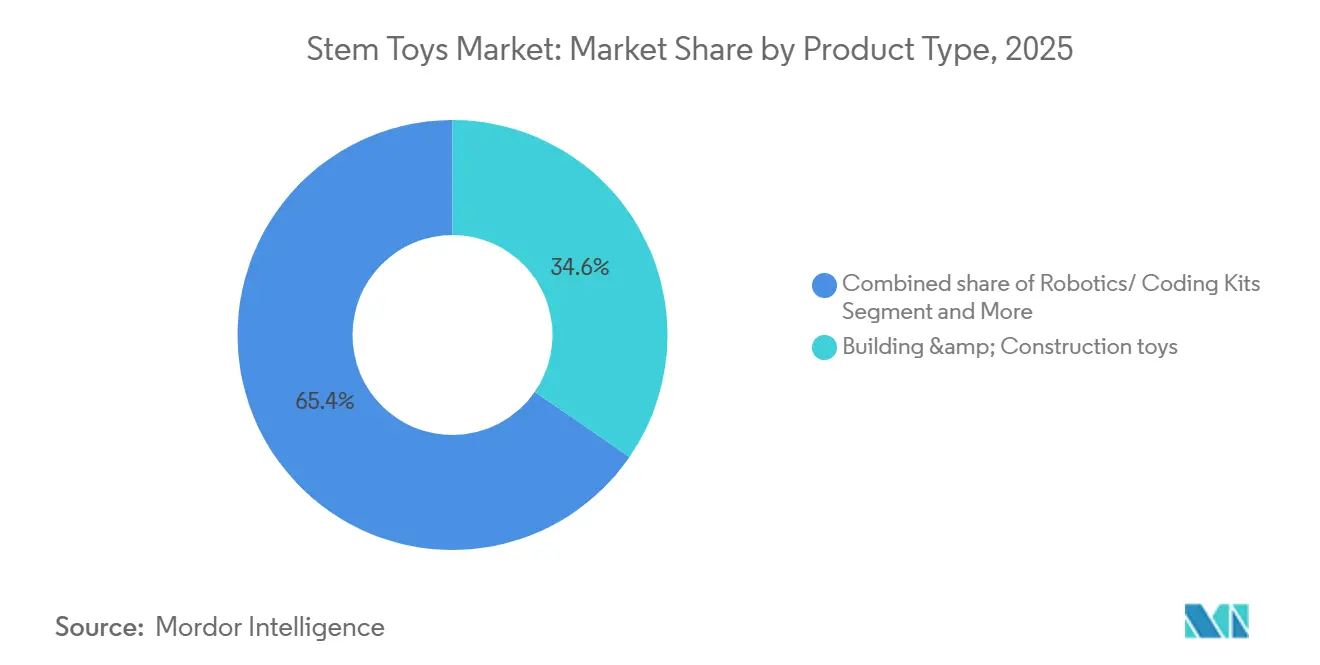
By product type, building and construction sets held 34.6% of the stem toy market share in 2025, while robotics and coding kits are advancing at an 11.1% CAGR through 2031.
By technology integration, non-electronic traditional toys accounted for 48.1% of 2025 revenue, yet AI-enabled smart toys are forecast to post a 10.9% CAGR to 2031.
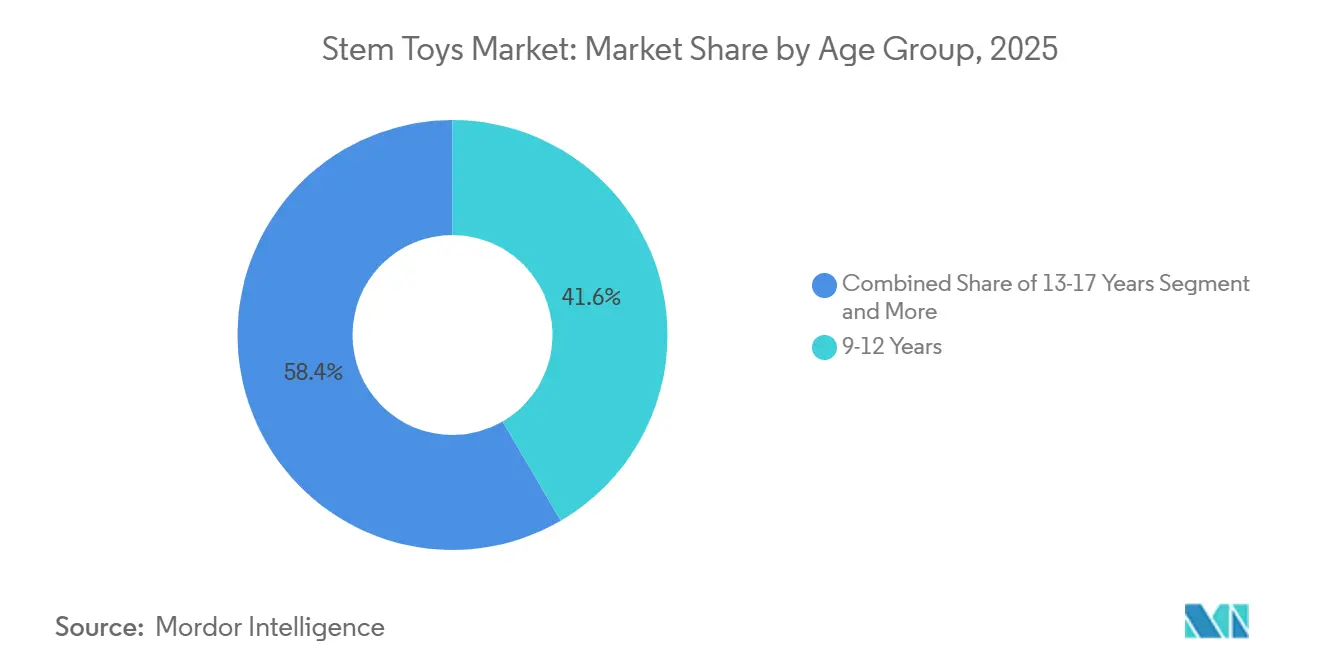
By age group, the 9-12 age group contributed 41.6% of 2025 sales, whereas the 13-17 cohort is projected to grow at 9.9% CAGR on the back of competitive robotics leagues
By distribution channel, Online retail captured 39.7% of distribution in 2025 and is expected to rise at 10.3% CAGR to 2031
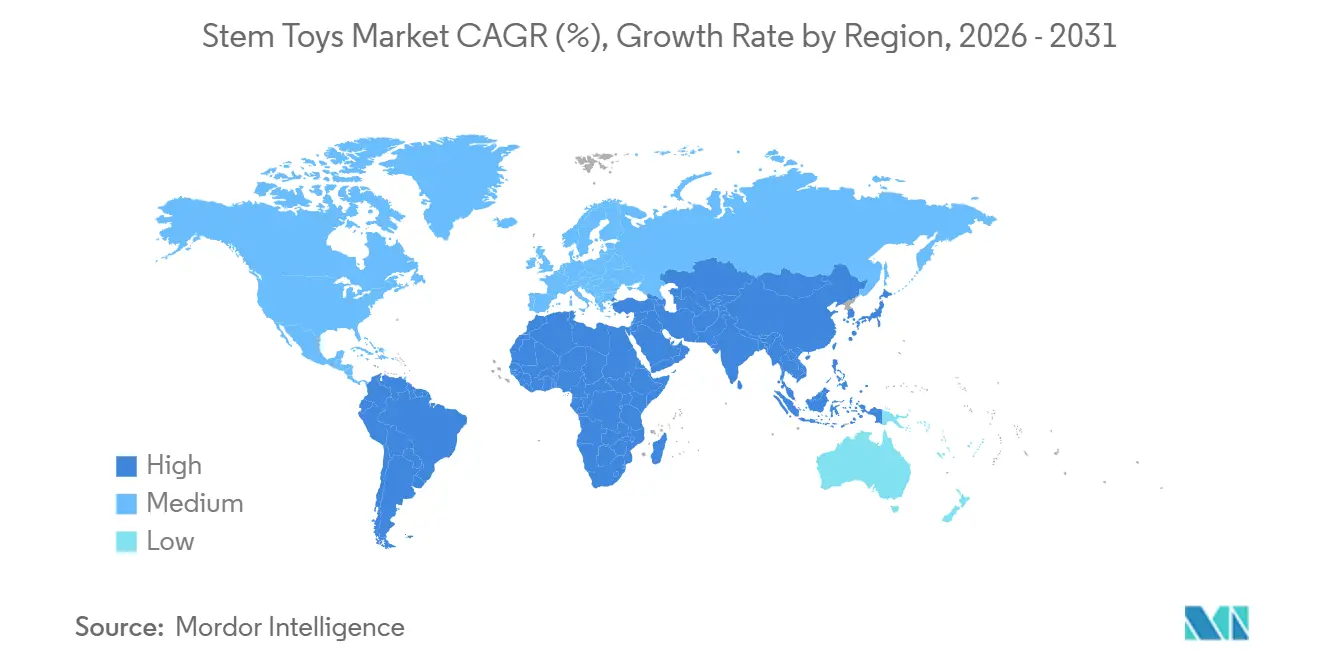
By geography, Asia-Pacific commanded 43.1% of 2025 revenue; the Middle East and Africa segment is the fastest-growing geography at 9.7% CAGR to 2031
Note: Market size and forecast figures in this report are generated using Mordor Intelligence’s proprietary estimation framework, updated with the latest available data and insights as of January 2026.
Global Stem Toys Market Trends and Insights
Drivers Impact Analysis*
| Driver | % Impact on CAGR Forecast | Geographic Relevance | Impact Timeline |
|---|---|---|---|
| Increasing parental focus on STEM-based education | +1.8% | Global, with early gains in North America, EU, Asia-Pacific | Medium term (2-4 years) |
| Government initiatives promoting STEM education and funding support | +2.1% | National, with early gains in China, UAE, Saudi Arabia, US | Long term (≥ 4 years) |
| Rising disposable incomes in emerging economies | +1.2% | APAC core, spill-over to MEA | Medium term (2-4 years) |
| Integration of robotics and coding into K–12 education systems | +1.9% | Global, with concentration in developed markets | Long term (≥ 4 years) |
| Advancement of AI-enabled adaptive learning features in toys | +0.9% | North America & EU, expanding to APAC | Short term (≤ 2 years) |
| Growing preference for screen-free and hands-on experiential learning toys | +0.4% | Global, with premium market focus | Short term (≤ 2 years) |
| Source: Mordor Intelligence | |||
Increasing Parental Focus on STEM-Based Education
Parental demand for STEM toys is being shaped less by abstract educational philosophy and more by tangible workforce anxiety, as families observe automation displacing routine cognitive tasks and governments publish skills-gap forecasts that emphasize computational thinking. LEGO Education's 2025 survey of 1,800 teachers and administrators across the United States, Germany, South Korea, and Australia found that 69% agree AI literacy is now critical for K-8 students, yet 40% report their schools lack the resources to teach it responsibly [2]Source: LEGO Group, “Young Builders at Home with New STEM Sets,” LEGO.com. This readiness gap is pushing parents to supplement formal curricula with at-home STEM kits, creating a parallel market for consumer-grade robotics and coding toys that mirror classroom tools. Moose Toys and CrunchLabs leverage this trend by integrating Mark Rober’s videos with each kit, transforming the unboxing experience into a structured, guided experimentation process.
Government Initiatives Promoting STEM Education and Funding Support
Public-sector STEM investments are no longer confined to university research grants; they now extend to primary and secondary infrastructure, creating sustained procurement cycles for educational robotics. India's Union Budget 2026 earmarked Rs 3,200 crore (USD 384 million) to scale Atal Tinkering Labs to 15,000 schools, while the Vigyan Dhara scheme allocated Rs 1,425 crore (USD 171 million) for science education infrastructure. Japan's Ministry of Education increased its KAKENHI competitive research grants by 6.7% in 2026, with a portion directed toward university-led K-12 STEM outreach programs. In sub-Saharan Africa, the African Union's Innovation and Entrepreneurship Awards distributed USD 50,000 grants in 2025 to support STEM education startups, while Rwanda's Smart Education initiative is embedding robotics labs in new-build schools. These programs create a dual revenue stream for STEM toy manufacturers: direct institutional sales of classroom kits and indirect consumer demand as students request home versions of school tools.
Rising Disposable Incomes in Emerging Economies
Household income growth in emerging markets is translating into STEM toy adoption faster than historical toy-category penetration curves would predict, because rising middle classes view STEM products as status signals and future-proofing investments rather than discretionary entertainment. In Asia-Pacific, Vietnam and Indonesia are experiencing double-digit income growth among urban households, creating demand for mid-priced robotics kits (USD 70-150) that were previously accessible only to North American and European consumers. The income-elasticity dynamic is also reshaping product design, as manufacturers localize content (bilingual interfaces, region-specific STEM challenges) and offer modular upgrade paths that allow families to incrementally expand kits rather than commit to high upfront costs. This tiering strategy mirrors smartphone market segmentation and suggests STEM toys are transitioning from niche edutainment to mass-market consumer electronics.
Integration of Robotics and Coding into K-12 Education Systems
Curriculum mandates are converting STEM toys from optional enrichment tools into required classroom supplies, fundamentally altering demand drivers and purchase cycles. The product explicitly retires the SPIKE Prime and SPIKE Essential portfolios, signaling a strategic pivot toward AI-integrated learning experiences that align with updated state standards in the United States and national curricula in Germany and South Korea. Competing platforms like TETRIX, KIBO, and Photon are securing multi-year district contracts by bundling hardware with professional development for teachers, creating switching costs that lock schools into specific ecosystems. The curriculum-integration trend also benefits from FIRST LEGO League competitions, which provide a structured pathway from classroom use to extracurricular robotics teams, thereby extending product engagement beyond the typical 6-12 month toy lifecycle
Restraints Impact Analysis*
| Restraint | % Impact on CAGR Forecast | Geographic Relevance | Impact Timeline |
|---|---|---|---|
| High price sensitivity and exposure to economic fluctuations | -1.1% | Global, with higher impact in emerging markets | Medium term (2-4 years) |
| Strong competition from digital and screen-based entertainment platforms | -0.8% | Global, particularly in developed markets | Long term (≥ 4 years) |
| Supply chain disruptions and shortages of semiconductors and sensors | -0.6% | Global, with manufacturing concentration risk in Asia | Short term (≤ 2 years) |
| Data privacy and security concerns in connected toy ecosystems | -0.4% | North America & EU, expanding globally | Medium term (2-4 years) |
| Source: Mordor Intelligence | |||
High Price Sensitivity and Exposure to Economic Fluctuations
Economic volatility is compressing household discretionary budgets, and STEM toys, often priced 50-200% above traditional toy categories, are disproportionately vulnerable to downtrading and purchase deferrals. Manufacturers are responding with modular pricing: Makeblock offers an entry mBot at USD 69.99 alongside a classroom pack at USD 1,199.99, allowing schools to amortize costs across multiple students while giving budget-conscious families an accessible entry point. Tariff risks further complicate pricing strategies, as 80% of US toy manufacturing originates in China, exposing importers to potential duty increases that could raise retail prices by 15-25% if trade tensions escalate. The price-sensitivity dynamic also explains the rapid growth of subscription models like CrunchLabs' Build Box, which spreads costs across monthly payments and reduces the psychological barrier of a single large transaction
Strong Competition from Digital and Screen-Based Entertainment Platforms
STEM toys compete not only with traditional playthings but also with zero-marginal-cost digital entertainment that offers instant gratification and algorithmically personalized engagement. Streaming platforms, mobile games, and short-form video apps (TikTok, YouTube Shorts) dominate children's leisure time, creating a high opportunity cost for activities requiring sustained attention and delayed rewards. LEGO Education's 2025 survey found that over 50% of teachers report students are "bored" by current digital resources, yet this dissatisfaction has not translated into wholesale rejection of screens, rather, it underscores the challenge of making physical STEM toys as immediately engaging as algorithmically optimized content. The competitive threat also explains the rise of hybrid products that integrate physical kits with companion apps, gamified challenges, and online leaderboards, blurring the boundary between toys and edtech platforms.
*Our forecasts treat driver/restraint impacts as directional, not additive. The impact forecasts reflect baseline growth, mix effects, and variable interactions.
Segment Analysis
By Product Type: Robotics Kits Outpace Legacy Construction Sets
Building sets represented 34.6% of 2025 revenue, yet robotics kits are forecast to log an 11.1% CAGR, pulling the largest incremental share of the STEM toy market size through 2031, reflecting a structural shift from passive assembly to active programming experiences. Science experiment kits, math and logic games, and other product types collectively account for the remaining share, with science kits benefiting from viral content partnerships.
Math and logic games remain niche, appealing primarily to homeschool families and competitive math leagues, while the "other" category includes emerging formats like STEM subscription boxes and modular upgrade kits that allow incremental expansion. The robotics segment’s outperformance is also driven by its integration into educational curricula. LEGO Education supports this trend with its Computer Science & AI kits, which bundle hardware with unlimited teacher resources and standards-aligned lesson plans, creating sustained institutional demand.


By Technology Integration: AI-Enabled Smart Toys Gain Share Despite Traditional Dominance
Non-electronic traditional toys are projected to account for approximately 48.10% of market share in 2025, underpinned by sustained parental preference for screen-free learning and heightened concerns around early-age digital exposure. Policy interventions, such as screen-time restrictions in markets like the United Arab Emirates, reinforce this trend by prioritizing developmental outcomes aligned with traditional learning methods. Continued growth in the building sets category, extending into a fifth consecutive year, highlights durable demand for tactile, hands-on learning tools that support both fine motor skill development and foundational STEM competencies. Empirical education research further validates the efficacy of experiential, activity-based learning, particularly among middle-grade cohorts, while established regulatory frameworks and safety standards continue to favor conventional materials with proven compliance pathways.
AI-enabled smart toys are expected to expand at a ~10.90% CAGR through 2031, driven by ongoing technological advancements and increasing alignment with digital learning curricula. Improvements in semiconductor supply chains, particularly expanded 200mm wafer capacity, are enhancing production scalability and component availability. The segment faces structural constraints, including tightening data privacy regulations and persistent parental concerns regarding connected devices. Emerging regulatory scrutiny, led by agencies such as the U.S. Consumer Product Safety Commission, is introducing stricter testing and labeling requirements for electronic components, potentially elevating compliance costs.
By Age Group: Teen and Adult Segments Disrupt Traditional Demographics
The 9-12 years age group represents 41.60% market share in 2025, reflecting optimal cognitive development for STEM concept introduction and parental investment in educational tools during elementary school years. LEGO Education's K-8 Computer Science & AI kits explicitly target this band with grade-specific lesson plans and stackable hardware that scales from block-based coding in elementary grades to text-based programming in middle school.
The 13-17 years segment grows fastest at 9.90% CAGR through 2031, driven by career exploration needs and increasing recognition of STEM skills' professional relevance. The 3-5 and 6-8 age groups collectively represent the early-childhood segment, where screen-free products dominate due to parental concerns about developmental impacts of digital exposure. The adult segment is also fueling demand for high-complexity robotics platforms: Xiaomi's Mi Robot Builder, priced at EUR 64.95 (USD 70), includes 978 blocks, inverted pendulum algorithms, and app-based block coding, appealing to both children and adult makers. This age-group diversification is fragmenting marketing strategies, as manufacturers must simultaneously address parental gatekeepers (3-8 years), institutional buyers (9-12 years), teen autonomy (13-17 years), and adult hobbyists (18+), each with distinct purchase triggers and channel preferences.
By Distribution Channel: Direct-to-Consumer Models Reshape Retail
Online retail accounted for approximately 39.70% of total distribution in 2025 and is projected to expand at a ~10.30% CAGR through 2031, driven by the decline of specialty toy chains and the rapid scaling of direct-to-consumer (DTC) subscription models. Companies such as CrunchLabs, founded by Mark Rober, exemplify this shift by leveraging digital content ecosystems to drive recurring revenue streams through subscription-based product lines, effectively converting high audience engagement into monetized customer retention.
Meanwhile, supermarkets and hypermarkets, specialty retailers, and other offline channels collectively account for the remaining market share. Specialty stores, in particular, are experiencing structural headwinds as consumers increasingly rely on online research, peer reviews, and price comparisons prior to purchase. That said, physical retail continues to play a critical role in the sale of high-value, education-focused products that benefit from demonstration and hands-on engagement. For instance, LEGO Education maintains a strong presence through educational distributors that offer in-person training and institutional procurement support.
Geography Analysis
Asia-Pacific is expected to retain its leading position with approximately 43.10% market share in 2025, supported by robust government-led STEM education initiatives and entrenched manufacturing scale advantages. Policy frameworks, particularly in China, including its long-term education roadmap and mandated AI curriculum integration, are driving sustained institutional demand that extends beyond discretionary consumer spending. Strategic investments by global players such as LEGO, alongside strong regional performance, underscore the market’s critical importance within the global STEM toys landscape. The region also benefits from highly developed supply chain ecosystems, with a significant concentration of global toy production anchored in China, although ongoing geopolitical considerations are accelerating diversification toward emerging manufacturing hubs in Southeast Asia. Additionally, regulatory alignment through national education bodies, such as curriculum standardization efforts in India, is reinforcing demand for products that are compliant with formal learning frameworks.
The Middle East & Africa is projected to be the fastest-growing regional market, with an estimated CAGR of ~9.70% through 2031, driven by large-scale government investments and strategic focus on STEM-led economic transformation. Countries such as the United Arab Emirates and Saudi Arabia are at the forefront, implementing nationwide AI education programs and deploying substantial capital toward advanced technology sectors. These initiatives are catalyzing institutional procurement of educational tools and accelerating adoption of STEM learning products. Furthermore, the region’s growing investment in space exploration and advanced research programs is fostering STEM engagement among younger populations, translating into increased consumer demand for thematic and experiential learning products.

Competitive Landscape
The STEM toys market exhibits moderate concentration, reflecting a fragmented competitive landscape where no single player holds a dominant position. However, a cohort of established companies, including LEGO Group, VTech, Mattel, Hasbro, and Spin Master, collectively accounts for an estimated 40–50% of global revenue. Market leaders continue to leverage brand equity, scale advantages, and ecosystem partnerships to sustain growth; for instance, LEGO’s strong financial performance and continued product innovation reinforce its leadership position, although increasing competition from cost-efficient Asian manufacturers such as Makeblock is exerting pricing pressure, particularly in institutional segments.
The market structure continues to present significant white-space opportunities, particularly across three high-growth vectors: AI-integrated toys with privacy-compliant, on-device processing capabilities; subscription-based models that convert transactional sales into recurring revenue streams; and curriculum-aligned educational kits that bundle hardware with teacher enablement and standards-based content. Technology integration remains a primary competitive differentiator, with mid-tier and emerging players such as Sphero and Xiaomi leveraging advanced robotics and open-source platforms to compete on performance and affordability, while incumbents expand digital capabilities to maintain relevance in evolving learning ecosystems.
Strategic partnerships and ecosystem collaborations have emerged as core competitive strategies, enabling companies to combine complementary capabilities and expand market reach. For example, Moose Toys’ collaboration with CrunchLabs and Mark Rober demonstrates how traditional manufacturers are leveraging creator-led engagement models to drive product adoption through direct-to-consumer channels.
Stem Toys Industry Leaders
LEGO Group
VTech Holdings Ltd.
Sphero Inc.
Learning Resources Ltd.
Thames & Kosmos
- *Disclaimer: Major Players sorted in no particular order


Recent Industry Developments
- February 2026: Xiaomi introduced its first open-source robotics AI model, Xiaomi-Robotics-0, featuring 4.7 billion parameters to enable robots to understand and interact with the physical world more effectively. The model separates cognitive processing from motion control, reducing delays and enabling smoother, more human-like real-time movements while being freely available for developers to build on.
- December 2025: Scholastic partnered with CrunchLabs and Mark Rober on a multi-year publishing deal to launch STEM-focused books starting in 2026, combining literacy with hands-on science learning. The collaboration leverages Scholastic’s school distribution channels and book fairs to scale reach, integrating Rober’s content into multiple formats to expand STEM engagement among students globally.
- May 2025: Moose Toys signed an exclusive global, multi-year partnership with CrunchLabs (founded by Mark Rober) to launch a new STEM toy line combining hands-on kits with digital science content. The collaboration leverages Rober’s massive audience and pairs each product with educational videos, aiming to drive engagement by linking physical toys with creator-led STEM learning experiences.
- June 2024: Sphero launched the Bolt Plus coding robot at USD 199, featuring advanced programming capabilities and educational curriculum integration, targeting the growing robotics and coding education demand.


Global Stem Toys Market Report Scope
STEM toys are educational play products designed to teach concepts from Science, Technology, Engineering, and Mathematics (STEM) through interactive, hands-on experiences.
The global STEM toys market is analyzed across several key parameters, including product type, level of technology integration, age group, distribution channel, and geography. By product type, the market is divided into building and construction sets, robotics and coding kits, science experiment kits, math and logic games, and other categories. Based on technology integration, it includes traditional non-electronic toys, electronic toys, and AI-enabled smart toys. In terms of age group, the market is segmented into 3–5 years, 6–8 years, 9–12 years, 13–17 years, and 18+ years. Distribution channels comprise supermarkets and hypermarkets, online retail stores, specialty stores, and others. Geographically, the study spans major regions such as North America, Europe, Asia-Pacific, South America, and the Middle East & Africa. Market size and forecasts for each segment are provided in both value (USD million)
| Building & Construction Sets |
| Robotics & Coding Kits |
| Science Experiment Kits |
| Math & Logic Games |
| Others |
| Non-Electronic Traditional toys |
| Electronic Toys |
| AI enabled Smart Toys |
| 3-5 Years |
| 6-8 Years |
| 9-12 Years |
| 13-17 Years |
| 18+ Years |
| Supermarkets/ Hypermarkets |
| Online Retail Stores |
| Specialty Stores |
| Others |
| North America | United States |
| Canada | |
| Mexico | |
| Rest of North America | |
| Europe | Germany |
| United Kingdom | |
| Italy | |
| France | |
| Spain | |
| Netherlands | |
| Poland | |
| Belgium | |
| Sweden | |
| Rest of Europe | |
| Asia-Pacific | China |
| India | |
| Japan | |
| Australia | |
| Indonesia | |
| South Korea | |
| Thailand | |
| Singapore | |
| Rest of Asia-Pacific | |
| South America | Brazil |
| Argentina | |
| Colombia | |
| Chile | |
| Peru | |
| Rest of South America | |
| Middle East and Africa | South Africa |
| Saudi Arabia | |
| United Arab Emirates | |
| Nigeria | |
| Egypt | |
| Morocco | |
| Turkey | |
| Rest of Middle East and Africa |
| By Product Type | Building & Construction Sets | |
| Robotics & Coding Kits | ||
| Science Experiment Kits | ||
| Math & Logic Games | ||
| Others | ||
| By Technology Integration | Non-Electronic Traditional toys | |
| Electronic Toys | ||
| AI enabled Smart Toys | ||
| By Age Group | 3-5 Years | |
| 6-8 Years | ||
| 9-12 Years | ||
| 13-17 Years | ||
| 18+ Years | ||
| By Distribution Channel | Supermarkets/ Hypermarkets | |
| Online Retail Stores | ||
| Specialty Stores | ||
| Others | ||
| By Geography | North America | United States |
| Canada | ||
| Mexico | ||
| Rest of North America | ||
| Europe | Germany | |
| United Kingdom | ||
| Italy | ||
| France | ||
| Spain | ||
| Netherlands | ||
| Poland | ||
| Belgium | ||
| Sweden | ||
| Rest of Europe | ||
| Asia-Pacific | China | |
| India | ||
| Japan | ||
| Australia | ||
| Indonesia | ||
| South Korea | ||
| Thailand | ||
| Singapore | ||
| Rest of Asia-Pacific | ||
| South America | Brazil | |
| Argentina | ||
| Colombia | ||
| Chile | ||
| Peru | ||
| Rest of South America | ||
| Middle East and Africa | South Africa | |
| Saudi Arabia | ||
| United Arab Emirates | ||
| Nigeria | ||
| Egypt | ||
| Morocco | ||
| Turkey | ||
| Rest of Middle East and Africa | ||


Key Questions Answered in the Report
What is the current value of the STEM toys market?
The STEM toys market size reached USD 21.65 billion in 2025.
How fast is the market projected to grow?
It is forecast to register an 8.20% CAGR, rising to USD 34.75 billion by 2031.
Which product segment is expanding quickest?
Robotics & Coding Kits are projected to grow at an 11.10% CAGR through 2031.
Which region shows the strongest growth momentum?
The Middle East & Africa region is advancing at 9.70% CAGR, the fastest worldwide.
How concentrated is supplier power?
The market scores 4/10 in concentration, meaning significant room remains for new entrants.
Page last updated on:


