Steel Rebar Market Size and Share
Market Overview
| Study Period | 2020 - 2031 |
|---|---|
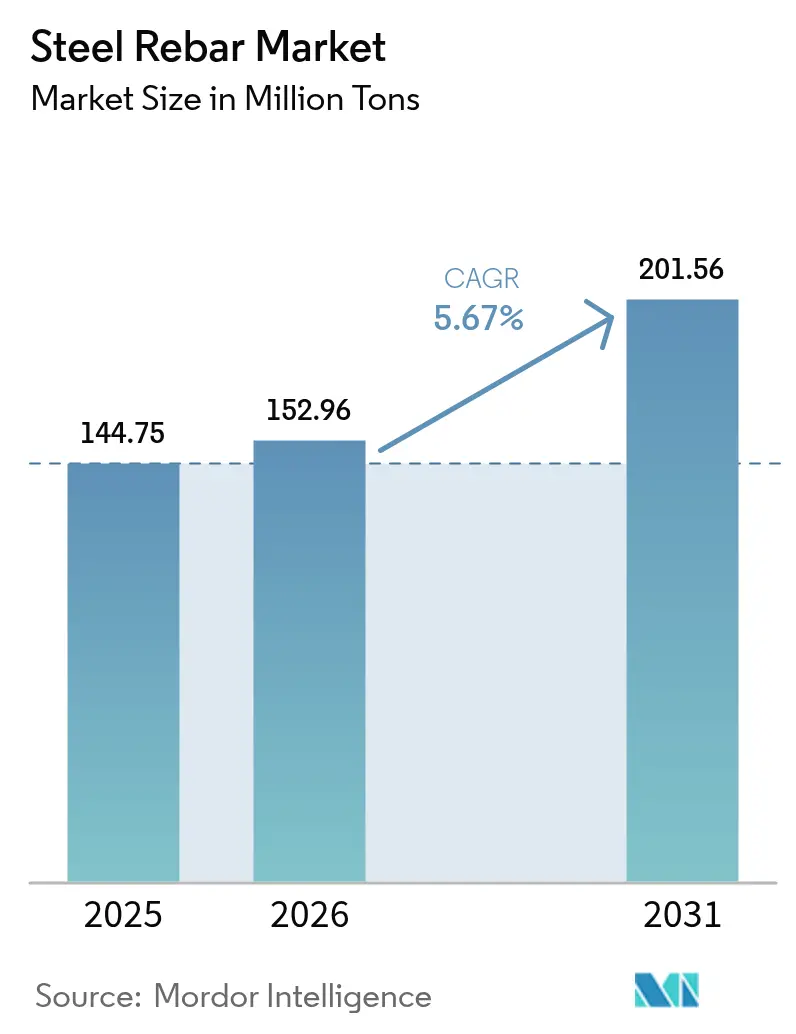
| Market Volume (2026) | 152.96 Million tons |
| Market Volume (2031) | 201.56 Million tons |
| Growth Rate (2026 - 2031) | 5.67% CAGR |
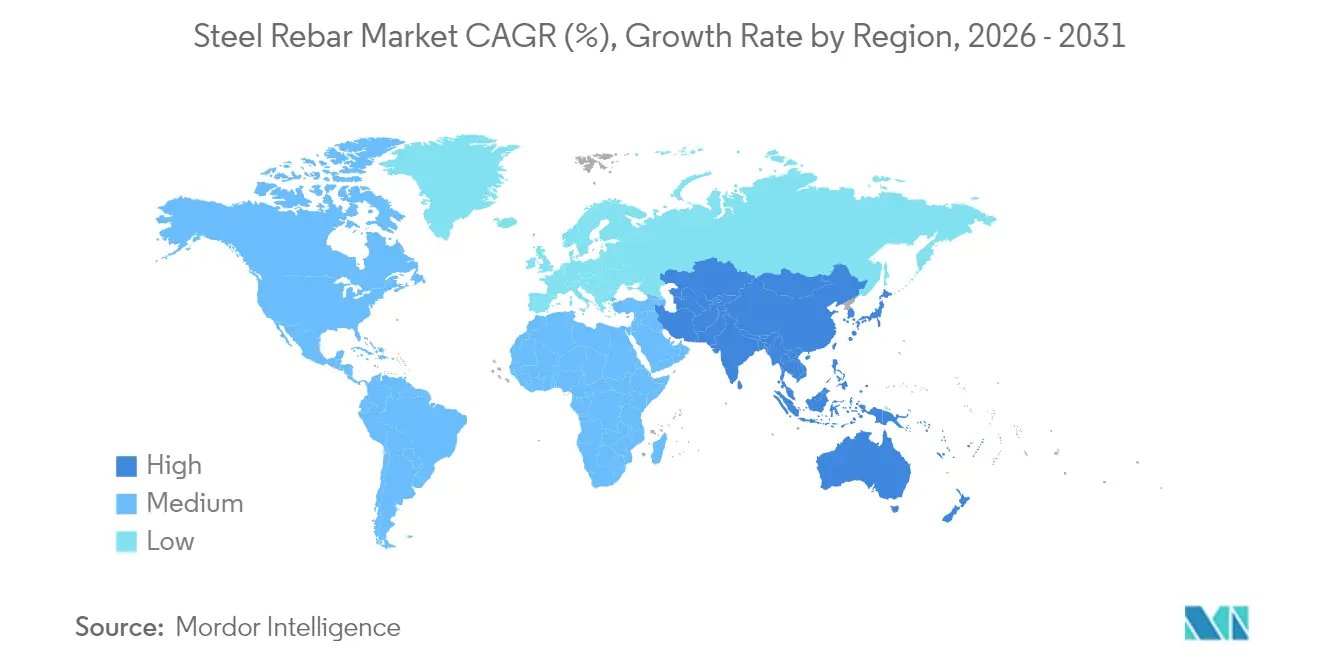
| Fastest Growing Market | Asia Pacific |
| Largest Market | Asia Pacific |
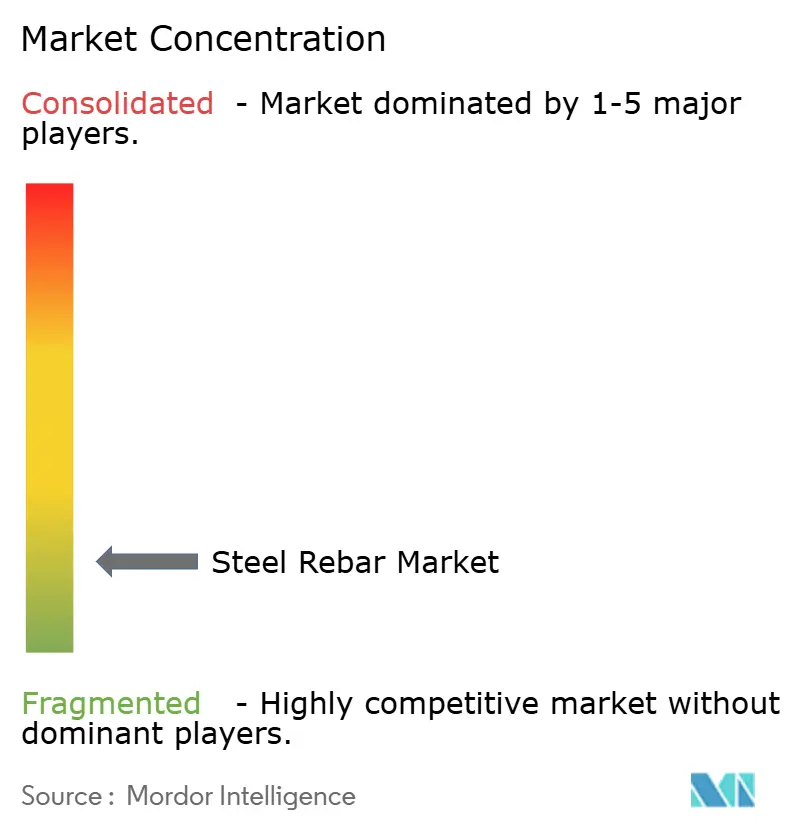
| Market Concentration | Low |
Major Players *Disclaimer: Major Players sorted in no particular order Image © Mordor Intelligence. Reuse requires attribution under CC BY 4.0. | |
Steel Rebar Market Analysis by Mordor Intelligence
The Steel Rebar Market size was valued at 144.75 Million tons in 2025 and estimated to grow from 152.96 Million tons in 2026 to reach 201.56 Million tons by 2031, at a CAGR of 5.67% during the forecast period (2026-2031). Demand resilience stems from large-scale public infrastructure spending, retrofitting mandates that stretch existing building stock, and a policy-driven pivot toward lower-carbon Electric Arc Furnace (EAF) production. Asia-Pacific dominates current consumption, yet North America and the Middle East record sharp upticks in rebar-intensive energy and manufacturing projects. Supply-side strategies now hinge on diameter specialization, corrosion-resistant chemistries, and digital fabrication models that tighten job-site schedules. Competition intensifies as flat-steel majors enter long-product niches, while sustainability targets reinforce scrap-based steelmaking and local sourcing models.
Key Report Takeaways
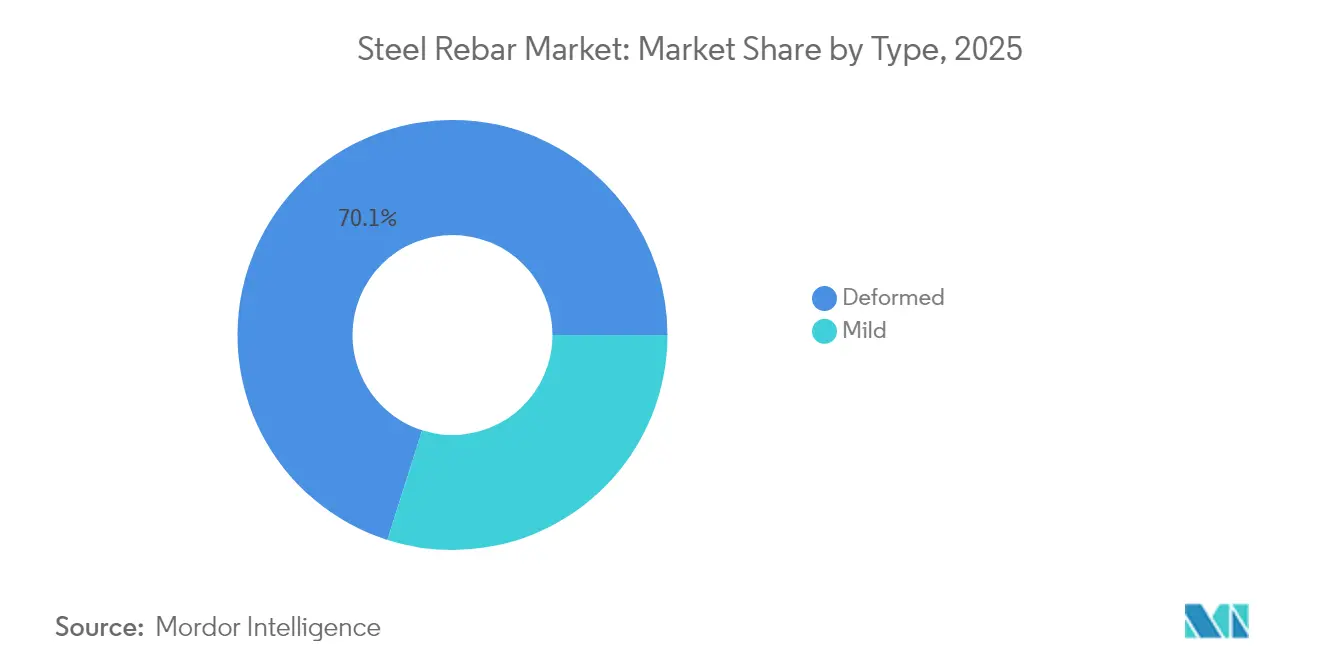
- By type, deformed rebar led with 70.10% of steel rebar market share in 2025, whereas mild-steel grades are projected to expand at a 5.96% CAGR to 2031.
- By diameter, the 10-20 mm segment accounted for 45.30% of the steel rebar market size in 2025, while >32 mm diameters are advancing at a 6.05% CAGR through 2031.
- By production process, Basic Oxygen Furnace steel retained 68.70% share of the steel rebar market size in 2025, yet EAF-based output is forecast to grow at a 6.30% CAGR to 2031.
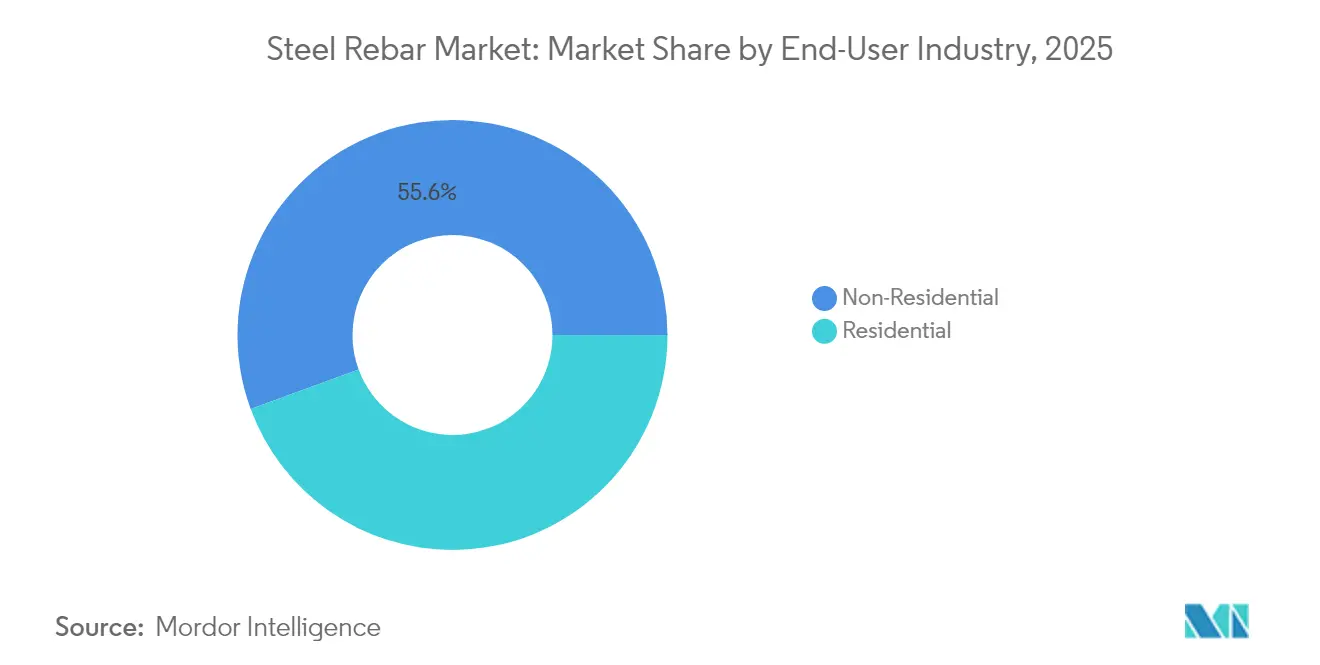
- By end-user industry, non-residential construction captured 55.60% of the steel rebar market size in 2025 and is forecast to expand at a 6.14% CAGR between 2026-2031.
- By geography, Asia-Pacific accounted for the largest share of 38.90% in 2025 and is poised to grow at the fastest CAGR of 5.86%through 2031.
Note: Market size and forecast figures in this report are generated using Mordor Intelligence’s proprietary estimation framework, updated with the latest available data and insights as of 2026.
Global Steel Rebar Market Trends and Insights
Drivers Impact Analysis*
| Driver | (~) % Impact on CAGR Forecast | Geographic Relevance | Impact Timeline |
|---|---|---|---|
| Rapid demand from residential construction | +1.2% | Global, with concentration in Asia-Pacific and North America | Medium term (2-4 years) |
| Increasing reconstruction in retrofitting activities | +0.8% | Europe and North America, expanding to Asia-Pacific | Long term (≥ 4 years) |
| Belt-and-Road mega-infrastructure pipeline revival | +1.5% | Asia-Pacific core, spill-over to MEA and South America | Long term (≥ 4 years) |
| Prevalence of Reinforced Concrete in Construction | +0.9% | Global | Medium term (2-4 years) |
| Maritime wind-farm foundations demanding corrosion-resistant rebar | +0.6% | Europe, North America, and Asia-Pacific coastal regions | Long term (≥ 4 years) |
| Source: Mordor Intelligence | |||
Rapid Demand from Residential Construction
Demographic pressure and pro-housing fiscal programs heighten rebar consumption across key economies. US residential spending rose 10.9% year-on-year in April 2024 as federal incentives linked to the CHIPS and Inflation Reduction Acts spurred single-family starts[1]MEPS International, “US Construction Spending Update,” meps-international.com. Brazil’s Minha Casa Minha Vida scheme lifted cement sales 5.9% in Q1 2025, signaling a parallel uptick in rebar-rich concrete pours. India’s steel use reached 112.5 million tons in 2024 on the back of state-subsidized housing and urban metro construction. Seismic-zone building codes now request higher-strength bar, boosting tonnage per dwelling. Manufacturing plant construction—up 156% since 2019—adds indirect residential demand as new workforce housing clusters around industrial corridors.
Increasing Reconstruction in Retrofitting Activities
Europe and North America accelerate retrofits to meet net-zero and safety targets. The UK must triple retrofit rates to 3% annually to align with 2050 climate goals, locking in long-run rebar demand. California and Japan fund seismic upgrades that specify stainless or epoxy-coated bar for longevity, raising per-project tonnage. Post-Grenfell rules under the 2022 Building Safety Act fuel structural overhauls across the UK’s mid-rise housing stock. Specialized alloys and customized diameters command premiums that cushion mills from volume volatility in mature markets.
Belt-and-Road Mega-Infrastructure Pipeline Revival
Chinese engagement topped USD 1 trillion, with 52% added during 2023, redirecting flows toward renewable energy and digital corridors[2]Green Finance & Development Center, “BRI Investment Report 2023,” greenfdc.earth. Metals and mining inflows climbed 158%, seeding regional billet capacity that shortens delivery cycles for BRI rail, port, and energy schemes. Africa now absorbs the largest share of Chinese funding, often in high-temperature or saline environments that require corrosion-resistant grades. Larger-diameter bar supports bridges, tunnels, and offshore wind bases embedded in BRI power grids.
Prevalence of Reinforced Concrete in Construction
Reinforced concrete retains primacy as material innovation and digital workflows raise performance ceilings. Nominal value added in construction climbed 7% in 2023 as advanced cements paired with higher-grade bar for strength-to-weight gains. Buy-Clean federal procurement in the US stipulates low-carbon steel, favoring scrap-fed EAF bar without displacing concrete. Building Information Modeling and automated bending lines cut waste, enhance bar placement accuracy, and trim labor exposure. IoT-embedded sensors in bar mats unlock monitoring service revenue for mills and fabricators.
Restraints Impact Analysis*
| Restraint | (~) % Impact on CAGR Forecast | Geographic Relevance | Impact Timeline |
|---|---|---|---|
| Volatile iron-ore and scrap prices squeezing mills' margins | -0.7% | Global, with acute impact in Asia-Pacific and Europe | Short term (≤ 2 years) |
| Accelerating adoption of fibre-reinforced polymer bars in coastal projects | -0.3% | North America, Europe, and Asia-Pacific coastal regions | Medium term (2-4 years) |
| Rising cement-concrete 3-D printing that bypasses traditional rebar | -0.2% | Europe and North America, expanding globally | Long term (≥ 4 years) |
| Source: Mordor Intelligence | |||
Volatile Iron-Ore and Scrap Prices Squeezing Mills' Margins
Spot iron-ore fell from USD 144/ton in January 2024 to USD 91.28 by September as Chinese pig-iron output weakened, pressuring integrated producers. Long-range forecasts point to USD 78/ton by 2034 as Simandou ramps up 120 million tons annually. Scrap premiums vary by region; shortages of clean industrial scrap can spike EAF input costs and curb run rates. Chinese subsidies—ten times OECD averages—further distort global margins, challenging less-subsidized mills.
Accelerating Adoption of Fibre-Reinforced Polymer Bars in Coastal Projects
GFRP bars retain 92% tensile strength in marine tests and offer crack resistance that appeals to coastal designers. Hybrid FRP products mitigate brittleness, while evolving design codes lower specification hurdles in bridge decks and seawall caps. Lifecycle assessments show maintenance savings overriding higher initial material outlays over 50 years, edging steel out of select high-salinity niches.
*Our forecasts treat driver/restraint impacts as directional, not additive. The impact forecasts reflect baseline growth, mix effects, and variable interactions.
Segment Analysis
By Type: Deformed Dominance Amid Mild Steel Momentum
Deformed bar held a commanding 70.10% of steel rebar market share in 2025 thanks to superior bond performance and seismic code mandates. Building codes in high-risk geographies stipulate deformed profiles for load-transfer efficiency, anchoring their role in primary structural elements. Mild-steel grades expand at a 5.96% CAGR as retrofit and marine contractors prize bendability and corrosion coatings that simplify congested reinforcement zones. Digital modeling tempers blanket deformed use, specifying mild grades where stresses allow, thus reallocating tonnage. JSW Steel’s plan to lift long-product output to 35% by 2030 illustrates strategic alignment with specialized segment growth.
Demand for galvanized and epoxy-coated mild bar rises in piers, quays, and refurbishment of aging bridges. Surface treatments extend service life and offset initial cost gaps versus stainless options. Advances in micro-alloying elevate yield strength, closing mechanical gaps with deformed varieties. As a result, producers that master coating lines and small heat batches gain share in higher-margin retrofitting contracts.


By Diameter: Medium Specifications Lead Infrastructure Demand
Bar in the 10-20 mm range represented 45.30% of steel rebar market size in 2025, fueled by residential slabs and mid-rise commercial frames. Contractors favor this diameter for ready compatibility with standard stirrup cages and concrete cover guidelines. Projects exceeding 32 mm bar accelerate at 6.05% CAGR, propelled by offshore wind monopiles and extra-long span bridges where higher section modulus curbs assembly count. Mega-foundation pours on Belt-and-Road rail corridors likewise lift large-bar tonnage and optimize labor hours per unit steel.
Lower diameters ≤10 mm cater to precast panels and architectural fascias; demand stays stable amid modular housing trials. The 20-32 mm bracket grows in civic infrastructure such as hospitals and airports where live-load criteria surpass residential norms. Mills that supply wider diameter mixes enhance mill scheduling flexibility and capture cross-segment orders.
By Production Process: BOF Leadership Faces EAF Sustainability Challenge
BOF routes held 68.70% of steel rebar market size in 2025, anchored to integrated works feeding captive billets into bar mills at low cost. Economies of scale plus hot-metal purity bolster mechanical consistency prized in mass housing. EAF output rises 6.30% CAGR as carbon budgets tighten and scrap pools deepen. Fossil-free power grids lift EAF’s emission cut potential to 97%, drawing procurement preference from public infrastructure bids.
Induction furnaces occupy boutique niches such as alloyed stainless bar for marine foundations. Policy moves toward carbon border adjustments may re-rank costs, giving scrap-rich economies an export edge. Producers integrating renewable power purchase agreements hedge volatility and elevate sustainability credentials in tender scoring.
By End-user Industry: Non-Residential Sector Drives Dual Leadership
The non-residential domain commanded 55.60% of steel rebar market size in 2025 and is forecast to grow at 6.14% CAGR to 2031 as infrastructure packages and industrial reshoring kindle record project pipelines. US transportation programs fund more than 56,000 projects, while semiconductor fabs and battery plants multiply bar demand in slab-on-grade and heavy pad pour profiles. Data centers and logistics hubs prioritize high-roof clearances that elevate rebar per square meter.
Residential construction remains critical, underpinned by demographic growth and affordable-housing policy in emerging economies. Standardized bar meshes maximize mill utilization yet deliver thinner margins. Institutional builds—hospitals and universities—specify high-strength grades for critical-facility resilience, offering premium price points that lift revenue beyond headline tonnage.
Geography Analysis
Asia-Pacific retained 38.90% of global consumption in 2025 and is poised for a leading 5.86% CAGR through 2031. China’s crude-steel pull of 911 million tons in 2023 centered on rail, machinery, and renewable capacity rather than residential high-rise, altering grade and diameter mix. India recorded 14.5% yearly demand growth and expects 8-10% gains in 2025 as metro, airport, and highway schemes mature. ASEAN hubs, led by Malaysia, channel FDI into data-center campuses that favor 20-32 mm bar cages.
North America benefits from reshored manufacturing, with the US construction sector accounting for more than half of domestic steel uptake. CHIPS-driven semiconductor plants, plus renewable component factories, sustain high-strength bar orders. Canada posted a 5.8% rise in non-residential starts during 2024, offsetting a slowdown in housing. Mexico’s MXN 859 billion infrastructure program across energy and mobility widens continental steel corridors.
Europe faces tempered demand as energy costs and geopolitical risk curb fresh projects; apparent steel use slipped 2.3% in 2024. Yet retrofit mandates and offshore wind investments uphold specialty bar consumption. The Middle East surges, with Saudi Arabia projected to eclipse USD 181.5 billion in construction outlays by 2028, funneling long-product imports until local melt-shop expansions catch up. South America shows patchy growth; Brazil’s real-estate stimulus lifted cement and by extension rebar volumes, while infrastructural deficits hint at future mega-project pipelines.

Competitive Landscape
The steel rebar market remains highly fragmented: regional giants mingle with nimble specialty mills. China Baowu, ArcelorMittal, JSW Steel, and Nucor leverage vertical integration and rolling-mill modernization to serve both commodity and high-spec orders. JSW Steel attained USD 30.31 billion market capitalization in 2025 as capacity expansions and long-product focus improved margins. EAF-equipped players gain sustainability traction, signing renewable power deals and selling low-carbon bar certificates to infrastructure owners.
M&A activity accelerates: Cleveland-Cliffs absorbed Stelco for USD 2.8 billion, cementing billet flow security, while Aperam acquired Universal Stainless for USD 539 million to secure specialty supplement. Hyundai Steel committed USD 5.8 billion to a US EAF complex that will feed automotive clients with 2.7 million tons yearly plate and bar, signaling OEM-mill integration.
Niche leaders exploit coating technology, duplex grades, and digital bending systems to break into marine wind, seismic retrofit, and data-center foundation contracts. AI-driven temperature control and IoT bar-tracking shave energy, reduce rejects, and tighten just-in-time deliveries, giving smaller mills a cost-quality edge.
Steel Rebar Industry Leaders
ArcelorMittal
Gerdau S/A
Nucor Corporation
Jiangsu Shagang Group Su
NIPPON STEEL CORPORATION
- *Disclaimer: Major Players sorted in no particular order

Recent Industry Developments
- June 2025: Hybar, LLC, commenced production of its first rebar at a newly constructed steel mini mill in Osceola, Arkansas. This achievement occurred twenty-two months after the company initiated construction on a 1,300-acre greenfield site, utilizing purchased billets for production.
- June 2025: Three major US steel producers – Steel Dynamics, Commercial Metals Company (CMC), and Gerdau Long Steel North America – announced a price increase of USD 60 per short ton for rebar. Additionally, these producers implemented an extra price increase of USD 40 per short ton for 20-foot rebar bars.


Global Steel Rebar Market Report Scope
A steel rebar is a steel bar or mesh of steel wires used in concrete to provide tensile strength. Because of its physical qualities, steel rebar is utilized in the construction of highways, bridges, dams, and dwellings. It provides a solid foundation for the structure being built or constructed, as well as strengthens and assists the concrete under tension. Concrete has high compressive strength but low tensile strength. The market is segmented based on type, end-user industries, and geography. By type, the market is segmented into deformed and mild. By end-user industry, the market is segmented into residential and non-residential. The report offers market size and forecasts for 15 countries across major regions. For each segment, market sizing and forecasts have been done on the basis of volume (Tons) for all the above segments.
| Deformed |
| Mild |
| Less than equal to10 mm |
| 10–20 mm |
| 20–32 mm |
| Geater than 32 mm |
| Electric-Arc Furnace (EAF) |
| Basic Oxygen Furnace (BOF) |
| Induction Furnace |
| Residential | |
| Non-Residential | Commercial |
| Infrastructure | |
| Institutional |
| Asia-Pacific | China |
| Japan | |
| India | |
| South Korea | |
| ASEAN Countries | |
| Rest of Asia-Pacific | |
| North America | United States |
| Canada | |
| Mexico | |
| Europe | Germany |
| United Kingdom | |
| France | |
| Italy | |
| Spain | |
| Russia | |
| NORDIC Countries | |
| Rest of Europe | |
| South America | Brazil |
| Argentina | |
| Rest of South America | |
| Middle East and Africa | Saudi Arabia |
| South Africa | |
| Rest of Middle East and Africa |
| By Type | Deformed | |
| Mild | ||
| By Diameter | Less than equal to10 mm | |
| 10–20 mm | ||
| 20–32 mm | ||
| Geater than 32 mm | ||
| By Production Process | Electric-Arc Furnace (EAF) | |
| Basic Oxygen Furnace (BOF) | ||
| Induction Furnace | ||
| By End-user Industry | Residential | |
| Non-Residential | Commercial | |
| Infrastructure | ||
| Institutional | ||
| By Geography | Asia-Pacific | China |
| Japan | ||
| India | ||
| South Korea | ||
| ASEAN Countries | ||
| Rest of Asia-Pacific | ||
| North America | United States | |
| Canada | ||
| Mexico | ||
| Europe | Germany | |
| United Kingdom | ||
| France | ||
| Italy | ||
| Spain | ||
| Russia | ||
| NORDIC Countries | ||
| Rest of Europe | ||
| South America | Brazil | |
| Argentina | ||
| Rest of South America | ||
| Middle East and Africa | Saudi Arabia | |
| South Africa | ||
| Rest of Middle East and Africa | ||


Key Questions Answered in the Report
What is the forecast growth rate for the steel rebar market?
The steel rebar market is expected to grow at a 5.67% CAGR from 2026 to 2031, moving from 152.96 million tons to 201.56 million tons.
Which region holds the largest steel rebar market share?
Asia-Pacific held 38.90% of global consumption in 2025 and is projected to remain the largest, expanding at 5.86% CAGR.
Why is Electric Arc Furnace technology gaining importance?
EAF production can cut steelmaking emissions by up to 97% when powered by renewable energy, aligning with growing low-carbon procurement standards.
Which diameter segment is growing fastest?
Rebar thicker than 32 mm is forecast to rise at 6.05% CAGR through 2031, driven by offshore wind foundations and mega-infrastructure projects.
Page last updated on:


