Stealth Technologies Market Size and Share
Market Overview
| Study Period | 2019 - 2031 |
|---|---|
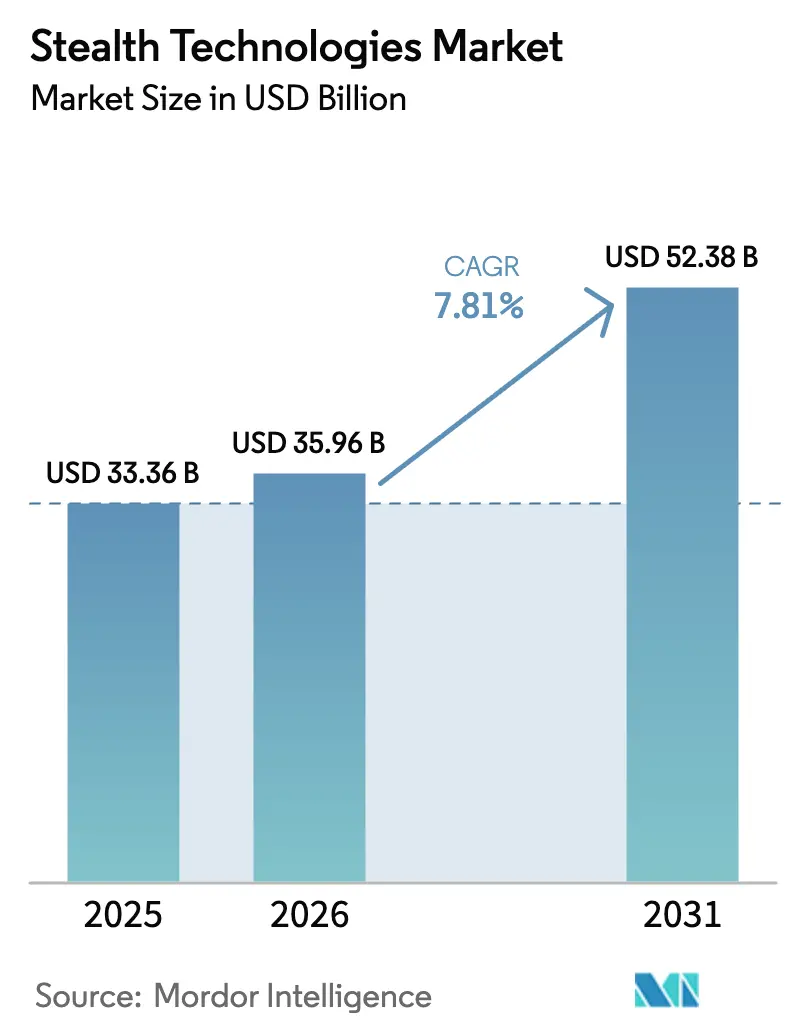
| Market Size (2026) | USD 35.96 Billion |
| Market Size (2031) | USD 52.38 Billion |
| Growth Rate (2026 - 2031) | 7.81% CAGR |
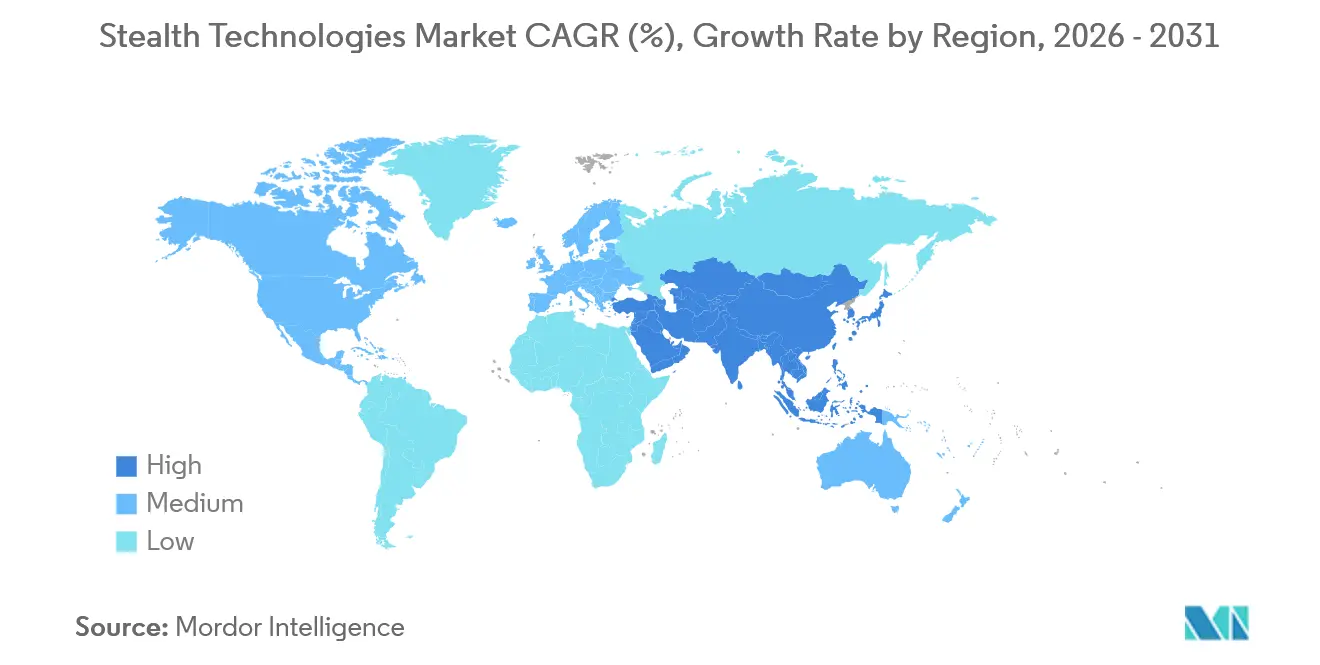
| Fastest Growing Market | Asia Pacific |
| Largest Market | North America |
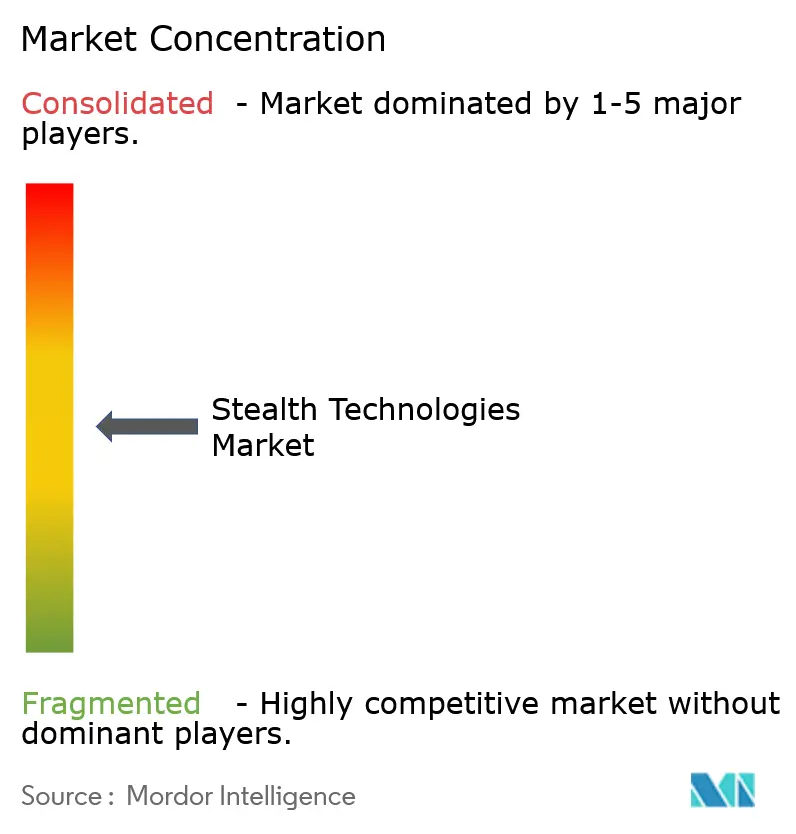
| Market Concentration | Medium |
Major Players *Disclaimer: Major Players sorted in no particular order Image © Mordor Intelligence. Reuse requires attribution under CC BY 4.0. | |
Stealth Technologies Market Analysis by Mordor Intelligence
The stealth technologies market size is expected to grow from USD 33.36 billion in 2025 to USD 35.96 billion in 2026 and is forecasted to reach USD 52.38 billion by 2031 at a 7.81% CAGR over 2026-2031. The accelerated fielding of multi-static low-frequency radars, hypersonic vehicle programs, and low-observable satellite constellations is stimulating rapid material innovation, rather than displacing low-observable design altogether. Boeing’s March 2025 victory in the USD 20 billion Next Generation Air Dominance (NGAD) competition illustrates how sixth-generation fighters will embed signature reduction inside open-architecture EW frameworks that can be re-programmed against emerging sensor threats. In parallel, the US Air Force’s plan to acquire more than 1,000 Collaborative Combat Aircraft (CCA) is shifting the economics of survivability toward swarms of low-cost, unmanned platforms that can absorb attrition while extending the sensor reach of manned assets. Northrop Grumman’s B-21 Raider, China’s J-20 Block 3, and Japan’s entry into the four-nation Global Combat Air Programme (GCAP) confirm that new strategic investments are proliferating across every central defense region.
Key Report Takeaways
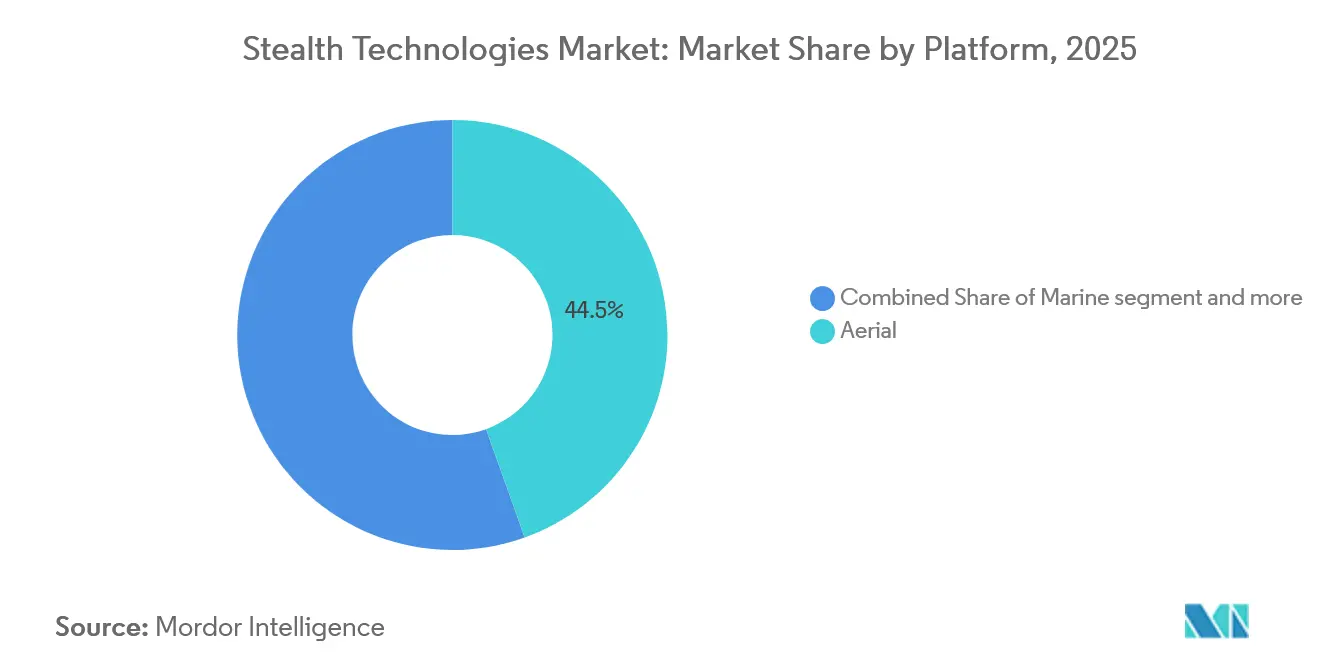
- By platform, aerial systems led with 44.54% of the stealth technologies market share in 2025, while terrestrial vehicles are forecast to post the fastest CAGR of 9.18% through 2031, as ground forces become increasingly resistant to ubiquitous sensors.
- By technology type, radar-absorbent materials are expected to hold a 36.59% revenue share; plasma and electromagnetic cloaking are poised for the fastest growth, with an 8.71% CAGR, driven by DARPA and Space Force prototype demonstrations.
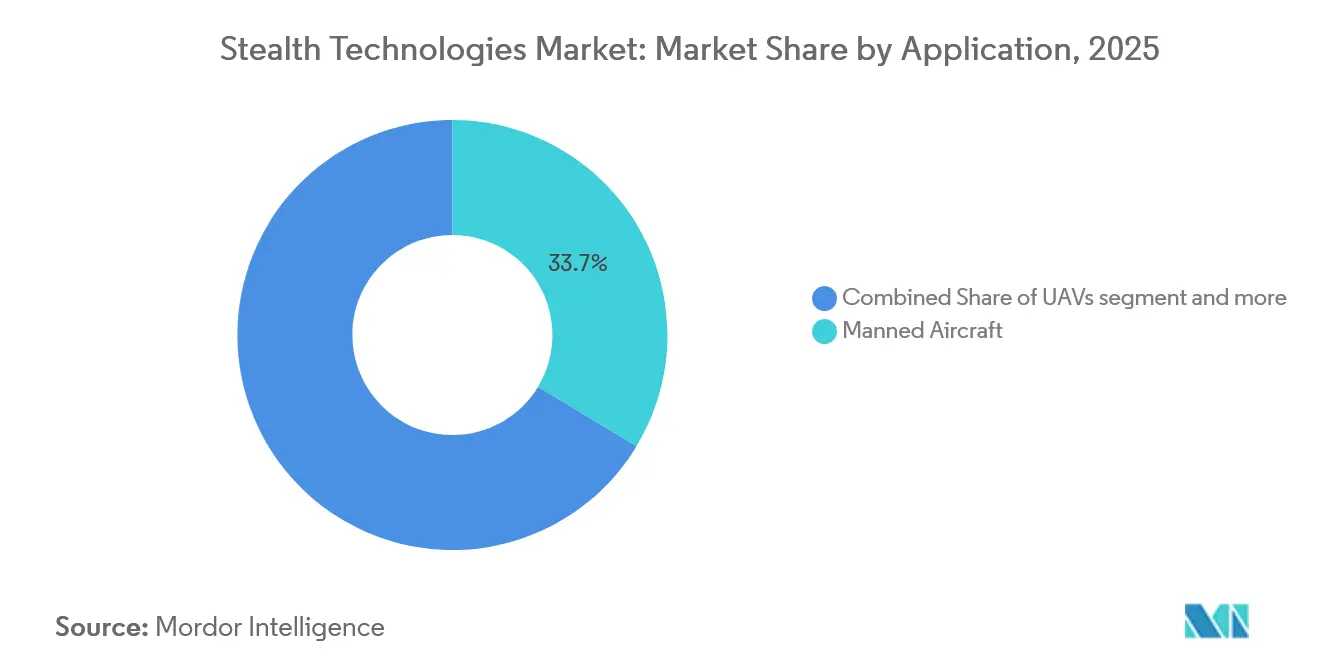
- By application, manned aircraft captured 33.65% of the revenue in 2025; however, unmanned aerial vehicles are expected to expand at a 10.15% CAGR, driven by the CCA program and loyal-wingman projects in Australia and Europe.
- By geography, North America dominated with 34.89% revenue in 2025, supported by the B-21 test fleet and NGAD funding. In contrast, Asia-Pacific is projected to register the highest CAGR of 9.93% through 2031, as China, South Korea, and India accelerate the production of fifth- and sixth-generation fighters.
Note: Market size and forecast figures in this report are generated using Mordor Intelligence’s proprietary estimation framework, updated with the latest available data and insights as of January 2026.
Global Stealth Technologies Market Trends and Insights
Driver Impact Analysis*
| Driver | (~) % Impact on CAGR Forecast | Geographic Relevance | Impact Timeline |
|---|---|---|---|
| Ubiquity of multi-static low-frequency radars driving RAM upgrades | +1.2% | Global, with concentration in Eastern Europe, Indo-Pacific | Medium term (2-4 years) |
| Shift toward combined stealth-EW architectures for sixth-generation fighters | +1.5% | North America, Europe, Asia-Pacific (China, Japan, South Korea) | Long term (≥ 4 years) |
| Mass production of low-observable UAV swarms for ISR and decoy missions | +1.8% | North America, Asia-Pacific, Middle East | Short term (≤ 2 years) |
| Hypersonic-related aero-heating challenges increasing demand for advanced CMC RAM | +1.0% | North America, China, Russia | Medium term (2-4 years) |
| Growing interest in plasma-magnetic signature suppression for LEO satellites | +0.6% | Global, led by North America and China | Long term (≥ 4 years) |
| Additive manufacturing of graded-density metamaterials reducing program costs | +0.9% | North America, Europe, Asia-Pacific | Short term (≤ 2 years) |
| Source: Mordor Intelligence | |||
Ubiquity of Multi-Static Low-Frequency Radars Driving RAM Upgrades
Multi-static VHF and UHF radar networks now cover the Baltic region and the South China Sea, exposing shape-optimized airframes at ranges exceeding 200 km and forcing operators to invest in broadband coatings that absorb energy from 30 MHz to 18 GHz.[1]Multi-Static Radar Networks Challenge Stealth, NATO Science & Technology Organization, sto.nato.int China’s YLC-8E system achieved live tracking of low-RCS targets in 2024, accelerating US procurement of rare-earth-rich broadband RAM despite triple material costs relative to a narrowband alternative. The US FY-2025 defense budget allocates USD 340 million for F-35 radar cross-section sustainment, 28% above the 2024 levels, underscoring the urgency of upgrades. Smaller Eastern European air forces are retrofitting fourth-generation fighters with modular applique panels during depot maintenance, spawning a niche aftermarket. The resulting demand boosts the stealth technologies market, despite the proliferation of counter-stealth sensors.
Shift Toward Combined Stealth-EW Architectures for Sixth-Generation Fighters
Boeing’s F-47 NGAD integrates cognitive EW processors that modulate surface impedance in real time, transforming the airframe skin into a reconfigurable antenna rather than a passive absorber. The contract mandates open-mission-systems interfaces, allowing third-party payloads to update signature profiles via software updates instead of physical respray cycles. Parallel design choices in GCAP’s Tempest require active frequency-selective surfaces that are reprogrammable in the field, a capability that passive F-35-era coatings cannot match. China’s J-20 Block 3 embeds distributed RF apertures along wing edges to alternate between low-observable and electronic-attack modes. Lockheed Martin’s F-35 lineage, rooted in fixed coatings, was judged less adaptable, underscoring a paradigm shift that rewrites competitive advantage in the stealth technologies market.
Mass Production of Low-Observable UAV Swarms for ISR and Decoy Missions
The US Air Force caps CCA unit costs at below USD 30 million, enabling a planned fleet of over 1,000 aircraft that can be sacrificed to saturate adversary defenses. Anduril’s Fury employs a blended-wing body to achieve bird-sized radar signatures while omitting expensive thermal-management systems carried by manned penetrators, cutting life-cycle costs. General Atomics’ XQ-67A flew autonomously with F-35s during Red Flag, validating manned-unmanned teaming at operational scale. Boeing Australia’s MQ-28 Ghost Bat finished carrier trials in 2025, broadening naval swarm concepts. China’s GJ-11 Sharp Sword entered serial production, confirming a parallel focus on inexpensive low-observable UAVs. The cost calculus is USD 300 million for ten CCAs versus over USD 100 million for a single F-35, cementing swarming as a primary growth vector for the stealth technologies market.
Hypersonic-Related Aero-Heating Challenges Increasing Demand for Advanced CMC RAM
Mach-5-plus weapons raise leading-edge temperatures above 2,000 °C, eclipsing the limits of carbon-carbon composites used on subsonic aircraft. NASA testing has proven that zirconium diboride and hafnium carbide ceramic matrix composites retain their absorption at 2,200 °C for 10 minutes, a requisite for boost-glide profiles.[2]NASA Hypersonic Materials Research, NASA Technical Reports Server, ntrs.nasa.gov DARPA’s Hypersonic Air-Breathing Weapon Concept pairs C/C-SiC substrates with graded ZrB2-SiC outer layers to balance thermal shock with X- and Ku-band attenuation. Oak Ridge National Laboratory reduced the UHTC part cycle time from 72 hours to 18 hours, resulting in a 40% cost reduction and making the production of hypersonic radar-absorbing components viable. China’s DF-17 glide vehicle reportedly uses similar ceramics, while Russia’s Avangard relies on carbon-carbon with boron carbide additives, though oxidation remains a vulnerability. As hypersonic prototypes enter procurement, ultra-high-temperature RAM becomes a material science frontier within the stealth technologies market.
Restraint Impact Analysis*
| Restraint | (~) % Impact on CAGR Forecast | Geographic Relevance | Impact Timeline |
|---|---|---|---|
| Tri-band passive radar proliferation reducing operational advantage | -0.8% | Eastern Europe, Indo-Pacific, Middle East | Short term (≤ 2 years) |
| Regulatory barriers on ITAR-controlled advanced composites | -0.6% | Global, most acute for non-US allies | Medium term (2-4 years) |
| High O&M costs of radar-absorbent coatings in humid littoral climates | -0.5% | Indo-Pacific, Middle East, South America | Medium term (2-4 years) |
| Thermal-acoustic signature trades limiting platform endurance | -0.4% | Global | Long term (≥ 4 years) |
| Source: Mordor Intelligence | |||
Tri-Band Passive Radar Proliferation Reducing Operational Advantage
ERA’s VERA-NG network, deployed across NATO’s eastern flank, achieved 400 km tracking of stealth surrogates by fusing VHF, UHF, and L-band illuminators, compressing undetected loiter windows to under 20 minutes. China’s DWL-002 sites, arrayed along the Taiwan Strait, are expected to expand to 12 installations by 2025, providing early warning without emitting energy that can be targeted, thereby complicating suppression missions. RAND analysis shows passive radar investments cost one-tenth of active AESA arrays, democratizing counter-stealth and eroding the value premium of low-observable platforms. US Air Force doctrine updates now emphasize rapid ingress and egress, as well as standoff munitions, a shift that reduces platform loiter time and undermines some investment cases for highly stealthy platforms. Market growth persists, albeit at a moderated pace, as operators weigh the cost-effectiveness of their strategies against shrinking tactical windows.
Regulatory Barriers on ITAR-Controlled Advanced Composites
ITAR restrictions on carbon-nanotube RAM and metamaterial designs slow multinational programs and raise duplication costs. The United Kingdom waited 14 months for US approval to co-produce Tempest RAM, pushing BAE to build redundant lines at a 35% cost premium.[3]Tempest ITAR Review, Financial Times, ft.com Japan’s GCAP participation triggered the adoption of compartmentalized tech-sharing rules, which complicate the cross-licensing of frequency-selective surfaces. South Korea’s KF-21 Block 2 schedule slipped 18 months after denials of F-35 coating IP, forcing local R&D efforts. India’s AMCA program pivoted to domestic materials when export licenses were denied, yet early tests show 20% lower broadband absorption performance. Such frictions incentivize foreign self-reliance, while delaying program milestones and restraining the growth of the stealth technologies market.
*Our forecasts treat driver/restraint impacts as directional, not additive. The impact forecasts reflect baseline growth, mix effects, and variable interactions.
Segment Analysis
By Platform: Ground Vehicles Accelerate Signature Management
Terrestrial vehicles are forecast to post a 9.18% CAGR from 2026 to 2031, the fastest among platform groups, as armies retrofit main battle tanks and infantry fighting vehicles with applique RAM to counter the proliferation of drone and loitering-munition sensors. Israel Aerospace Industries’ Carmel demonstrator achieved a 60% reduction in radar cross-section relative to legacy hulls, validating modular kits that can be fitted during depot overhauls. The aerial segment held a 44.54% market share in stealth technologies in 2025, driven by the development of sixth-generation fighters and CCA prototyping. Yet unit costs for exquisite manned aircraft drive a shift toward mass-produced unmanned swarms, redistributing procurement budgets. Maritime platforms integrate tumblehome hulls and active-cancellation arrays as seen on the US Navy’s DDG(X), while submarine anechoic tiles advance acoustic stealth. Space and missile segments remain niche but draw R&D as low-Earth-orbit operators test plasma sheaths and as standoff missiles adopt low-observable skins. Collectively, cross-domain demand reinforces the strategic importance of stealth technologies.
In the aerial domain, additive manufacturing is shortening iteration cycles for blended-wing-body UAVs, enabling rapid concept verification. On land, 3D-printed metamaterial tiles allow armored brigades to tailor signatures for urban or open-terrain operations within hours. Naval designers increasingly prioritize electromagnetic signature balance over pure radar reduction to avoid compromising infrared and acoustic profiles. The convergence of materials science across these environments indicates that the stealth technologies market will remain platform-agnostic, with providers selling standard chemistries and design toolchains to multiple domain integrators. This dynamic supports a healthy supplier ecosystem even as individual platform programs fluctuate.


By Technology Type: Plasma Cloaking Transitions From Concept to Prototype
Radar-absorbent materials secured 36.59% of 2025 revenue, remaining the workhorse of the stealth technologies market. Next-generation polymer matrices infused with rare-earth microflakes now exceed a 20 GHz bandwidth, but incremental gains face diminishing returns in terms of cost per decibel. Shaping and geometric design continue to underpin every program; yet, the cost of fine-tuning curvatures rises sharply beyond the 0.001 m² radar-cross-section threshold. Infrared signature management, crucial for defeating imaging seekers, competes with radar stealth for space and power budgets, forcing design-tradeoff algorithms to optimize across multiple spectral bands. Active cancellation is particularly suitable for surface ships, where power margins are generous; DDG(X) prototypes incorporate reconfigurable impedance panels flush with their topside structures.
Plasma and electromagnetic cloaking is forecast to grow at an 8.71% CAGR as DARPA and Space Force prototypes migrate from laboratory rigs to orbital testbeds. Demonstrations show 15 dB attenuation across 2-to-18 GHz, albeit at significant power expense. Additive manufacturing of graded-density metamaterials smooths impedance transitions, widening absorption by 40% and reducing layer counts by half, which in turn lowers maintenance cycles. These advances signal that active, software-defined approaches will supplement, not supplant, conventional materials, blending physical and electronic defenses into an integrated signature-management stack that defines the future of the stealth technologies industry.
By Application: Unmanned Aerial Vehicles Outpace Manned Platforms
Unmanned aerial vehicles are projected to expand at a 10.15% CAGR from 2026 to 2031, as CCAs, loyal wingmen, and expendable decoys transition into production. The segment benefits from relaxed crew-safety constraints, allowing sharper planform angles and minimal infrared suppression, as loss tolerance is higher. Manned aircraft accounted for 33.65% of the revenue in 2025, supported by F-35 and B-21 deliveries; however, rising procurement costs are tilting marginal investment toward unmanned fleets. Surface ship stealth advances center on enclosed masts and radar-transparent composites, with China’s Type 055 destroyer fielding faceted superstructures across 25 hulls by 2025. Submarine programs focus on broadband anechoic tiles that attenuate active sonar while withstanding deep-water hydrostatic loads, a dual requirement driving the development of new elastomer chemistries.
Ground combat vehicles integrate signature kits during routine depot visits, providing cost-effective upgrades for fleets that are typically 25 years in age. Missile and precision-guided munition designers embed serpentine inlets and low-observable skins; Lockheed Martin’s AGM-158 JASSM-ER reports penetration probabilities above 90% against modern SAMs. Together, these applications confirm that platform type no longer dictates technology leadership; instead, mission profile and acceptable unit risk define the adoption curve inside the stealth technologies market.
Geography Analysis
North America generated 34.89% of global revenue in 2025, as the B-21 Raider entered flight testing and NGAD funding was secured through multi-year research outlays. The United States also leads the hypersonic race, investing in UHTC supply chains and ordering 1,000-plus CCAs, which collectively anchor domestic demand despite budget scrutiny. Canada’s Department of National Defence is allocating funds to retrofit CF-18 replacements with broadband coatings, reflecting an alignment with allied nations around US supply chains.
Asia Pacific is forecast to register the highest a 9.93% CAGR through 2031 as China raises annual J-20 production toward 60 airframes and tests J-35 carrier variants. South Korea’s KF-21 Block 2 funding secures stealth upgrades, while Japan’s GCAP participation grants access to sixth-generation architectures in cooperation with the UK, Italy, and Sweden. India’s AMCA aims for first flight by 2029, marking a strategic move to reduce import dependence despite technology gaps. Australia champions swarming concepts through the MQ-28 Ghost Bat program, and Southeast Asian nations are pursuing low-observable missile boats to counterbalance regional power asymmetries.
Europe maintains robust funding for the GCAP and France-Germany-Spain’s rival, the Future Combat Air System, though trans-Atlantic ITAR frictions complicate component flows. Eastern European states procure passive multiband radars and retrofit legacy fighters with applique RAM instead of buying fifth-generation jets, a pragmatic response to budget limits and proximity to potential conflict zones. The Middle East is acquiring low-observable aircraft and naval assets to offset missile threats; the UAE’s interest in the F-35 and Saudi participation in Tempest exemplify regional modernization. South America remains a niche adopter; Brazil’s KC-390 transport includes limited stealth features but no dedicated low-observable combat aircraft pipeline.

Competitive Landscape
The market exhibits moderate concentration: the top four primes, Lockheed Martin Corporation, Northrop Grumman Corporation, The Boeing Company, and BAE Systems plc, controlled an estimated 55%-60% of 2025 revenue, yet contract awards in 2024-2026 reveal increasing pressure from agile entrants. Boeing’s NGAD win and Northrop Grumman’s B-21 progress secure near-term backlog, but Lockheed Martin’s failure to capture NGAD underscores that F-35 incumbency does not guarantee next-generation dominance. Anduril’s USD 1.8 billion CCA contract demonstrates that Silicon Valley development cadence resonates with acquisition executives focused on unit cost and refresh speed.
Materials suppliers are consolidating. Northrop Grumman’s 2024 purchase of Composite Technology Development locks in resin and fiber IP, while CoorsTek and Kyocera enter hypersonic thermal-protection niches once occupied by traditional RAM vendors.[4]Northrop Grumman CTD Acquisition, Northrop Grumman, northropgrumman.com Patent filings increased 18% year-over-year in 2025, driven by advancements in reconfigurable impedance surfaces and printed metamaterials. Boeing’s April 2025 patent for a varactor-loaded skin exemplifies the convergence of hardware and software within structural components.[5]Boeing Reconfigurable Impedance Patent, U.S. Patent and Trademark Office, uspto.gov Vertical integration strategies aim to capture high-margin subsystems, including cognitive EW processors and additive printable chemistries, rather than relying solely on platform margins.
Competitive tactics emphasize rapid prototyping, open architectures, and transparency in costs. Kratos demonstrates flyaway prices of less than USD 5 million for expendable decoys, eroding legacy primes’ cost-plus models. Saab and Mitsubishi Heavy Industries leverage shared R&D to offset ITAR chokepoints, ensuring a smooth technology flow within GCAP. Investment flows into additive manufacturing lines capable of printing graded-density metamaterials at scale, reducing capital barriers for mid-tier firms. Collectively, these dynamics indicate sustained contestation for a share of the stealth technologies market through the next decade.
Stealth Technologies Industry Leaders
BAE Systems plc
Lockheed Martin Corporation
Northrop Grumman Corporation
RTX Corporation
The Boeing Company
- *Disclaimer: Major Players sorted in no particular order

Recent Industry Developments
- January 2026: China plans to enhance the advanced J-20 stealth fighter with upgrades to its radar, engines, and AI integration, aiming to strengthen its role as a key asset in fifth-generation aerial warfare.
- January 2026: Lockheed Martin Corporation announced that it delivered a record 191 F-35 Lightning II stealth fighters in 2025, exceeding the previous annual high of 142 aircraft achieved in 2021 by nearly 50 units.
- March 2025: Boeing secured the contract for the Air Force's NGAD stealth fighter jet, designated as the F-47. This contract represents a significant achievement for Boeing, reinvigorating its stealth aircraft business.


Global Stealth Technologies Market Report Scope
Stealth technology is a core element in next-generation military assets. It is defined as a sub-discipline of military tactics that encompasses a wide range of methods deployed to render radar invisibility to military assets, such as aircraft, ships, submarines, weapon systems, ground vehicles, and personnel. Modern military equipment adheres to low-observable principles, designed to be discreet in all aspects by minimizing acoustic, radio, radar, and infrared emissions, while also utilizing optical technologies to blend into the surrounding environment.
The stealth technologies market is segmented by platform, technology type, application, and geography. By platform, the market is segmented into aerial, marine, space, and terrestrial. By technology type, the market is segmented into radar-absorbent materials (RAM), shaping & geometric design, infrared signature reduction, active cancellation (electronic stealth), and plasma/EM cloaking. By application, the market is classified into manned aircraft, unmanned aerial vehicles (UAVs), surface ships, submarines, ground combat vehicles, missiles, and precision-guided munitions. The report offers the market size and forecasts for major countries across the regions. For each segment, the market sizing and projections were made based on value (USD).
| Aerial |
| Marine |
| Terrestrial |
| Space-Based |
| Radar-Absorbent Materials (RAM) |
| Shaping and Geometric Design |
| Infrared Signature Reduction |
| Active Cancellation (Electronic Stealth) |
| Plasma/EM Cloaking |
| Manned Aircraft |
| Unmanned Aerial Vehicles (UAVs) |
| Surface Ships |
| Submarines |
| Ground Combat Vehicles |
| Missiles and Precision-Guided Munitions |
| North America | United States | |
| Canada | ||
| Mexico | ||
| South America | Brazil | |
| Rest of South America | ||
| Europe | United Kingdom | |
| Germany | ||
| France | ||
| Russia | ||
| Rest of Europe | ||
| Asia-Pacific | China | |
| India | ||
| Japan | ||
| South Korea | ||
| Rest of Asia-Pacific | ||
| Middle East and Africa | Middle East | United Arab Emirates |
| Saudi Arabia | ||
| Rest of Middle East | ||
| Africa | South Africa | |
| Rest of Africa | ||
| By Platform | Aerial | ||
| Marine | |||
| Terrestrial | |||
| Space-Based | |||
| By Technology Type | Radar-Absorbent Materials (RAM) | ||
| Shaping and Geometric Design | |||
| Infrared Signature Reduction | |||
| Active Cancellation (Electronic Stealth) | |||
| Plasma/EM Cloaking | |||
| By Application | Manned Aircraft | ||
| Unmanned Aerial Vehicles (UAVs) | |||
| Surface Ships | |||
| Submarines | |||
| Ground Combat Vehicles | |||
| Missiles and Precision-Guided Munitions | |||
| By Geography | North America | United States | |
| Canada | |||
| Mexico | |||
| South America | Brazil | ||
| Rest of South America | |||
| Europe | United Kingdom | ||
| Germany | |||
| France | |||
| Russia | |||
| Rest of Europe | |||
| Asia-Pacific | China | ||
| India | |||
| Japan | |||
| South Korea | |||
| Rest of Asia-Pacific | |||
| Middle East and Africa | Middle East | United Arab Emirates | |
| Saudi Arabia | |||
| Rest of Middle East | |||
| Africa | South Africa | ||
| Rest of Africa | |||


Key Questions Answered in the Report
What is the current size and growth rate of the stealth technologies market?
The stealth technologies market size is USD 35.96 billion in 2026 and is expected to reach USD 52.38 billion by 2031 at a 7.81% CAGR.
Which platform segment is growing fastest?
Terrestrial vehicles show the quickest expansion, forecast at a 9.18% CAGR as armies retrofit tanks and armored vehicles with radar-absorbent kits.
Why are unmanned systems pivotal to future stealth investments?
The US Air Force’s planned purchase of 1,000+ CCAs and similar programs abroad drive a 10.15% CAGR for UAV applications, leveraging lower unit costs and attritable swarm tactics.
Which region will add the most new spending by 2031?
Asia-Pacific leads with a projected 9.93% CAGR, fueled by China’s J-20 and J-35 output and South Korea’s KF-21 upgrades.
How are hypersonic programs influencing material innovation?
Temperatures above 2,000 °C on hypersonic vehicles spur demand for ultra-high-temperature ceramic matrix composites that retain radar-absorbent properties at extreme heat levels.
What competitive shifts occurred after NGAD and CCA awards?
Boeing’s NGAD win and Anduril’s CCA contract demonstrate that open-architecture designs and rapid prototyping can unseat traditional primes for next-generation programs.
Page last updated on:


