Sri Lanka Container Glass Market Size and Share
Market Overview
| Study Period | 2020 - 2031 |
|---|---|
| Base Year For Estimation | 2025 |
| Forecast Data Period | 2026 - 2031 |
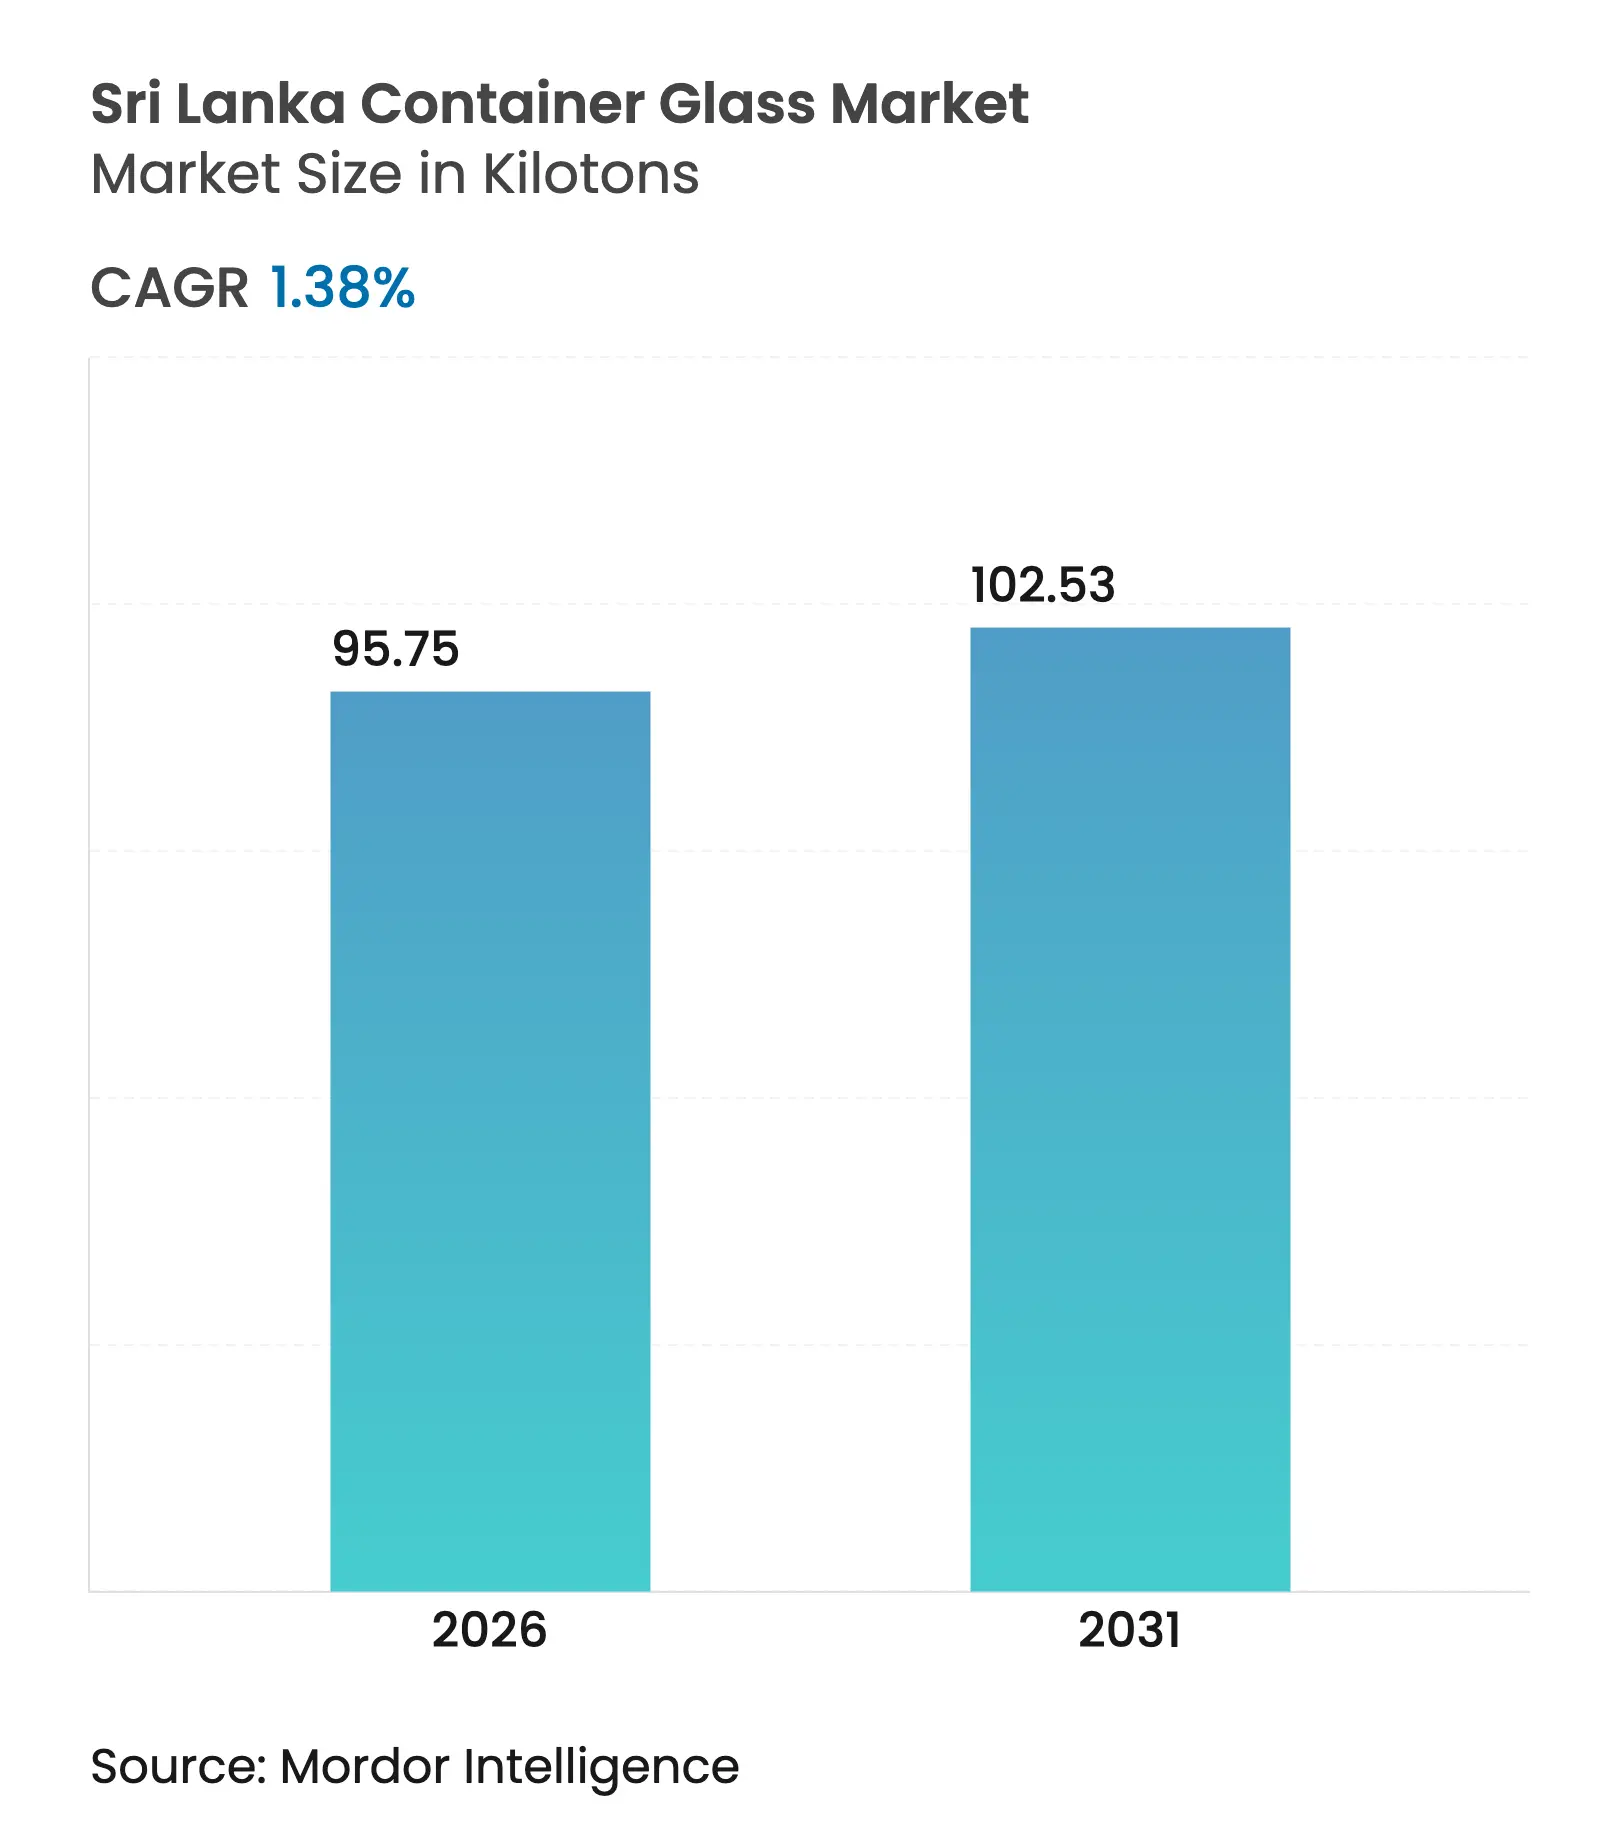
| Market Volume (2026) | 95.75 kilotons |
| Market Volume (2031) | 102.53 kilotons |
| CAGR | 1.38 % |
| Market Concentration | High |
Major Players *Disclaimer: Major Players sorted in no particular order. Image © Mordor Intelligence. Reuse requires attribution under CC BY 4.0. |
Sri Lanka Container Glass Market Analysis by Mordor Intelligence
Sri Lanka container glass market size in 2026 is estimated at 95.75 kilotons, growing from 2025 value of 94.45 kilotons with 2031 projections showing 102.53 kilotons, growing at 1.38% CAGR over 2026-2031. The market size and CAGR trajectory mirror a maturing domestic packaging landscape that balances constrained household spending with incremental export gains and steadily rising sustainability mandates. Growth pivots on the country’s lone integrated producer, PGP Glass Ceylon, whose 300-tonnes-per-day capacity anchors supply, enables duty-free exports to India, and supports a circular, high-cullet manufacturing model. Domestic beverage recovery, tourism-linked premium spirits demand, and phased restrictions on single-use plastics continue to drive volume into glass, while volatility in power and gas costs tests production economics. Export corridors leveraging the Indo-Sri Lanka Free Trade Agreement (ISFTA) and EU-funded circular economy grants offer longer-term upside as brands seek traceable, returnable packaging solutions in the Sri Lanka container glass market.[1]Asian Development Bank, “Asian Development Outlook (ADO) April 2024: Sri Lanka,” ADB.ORG
Key Report Takeaways
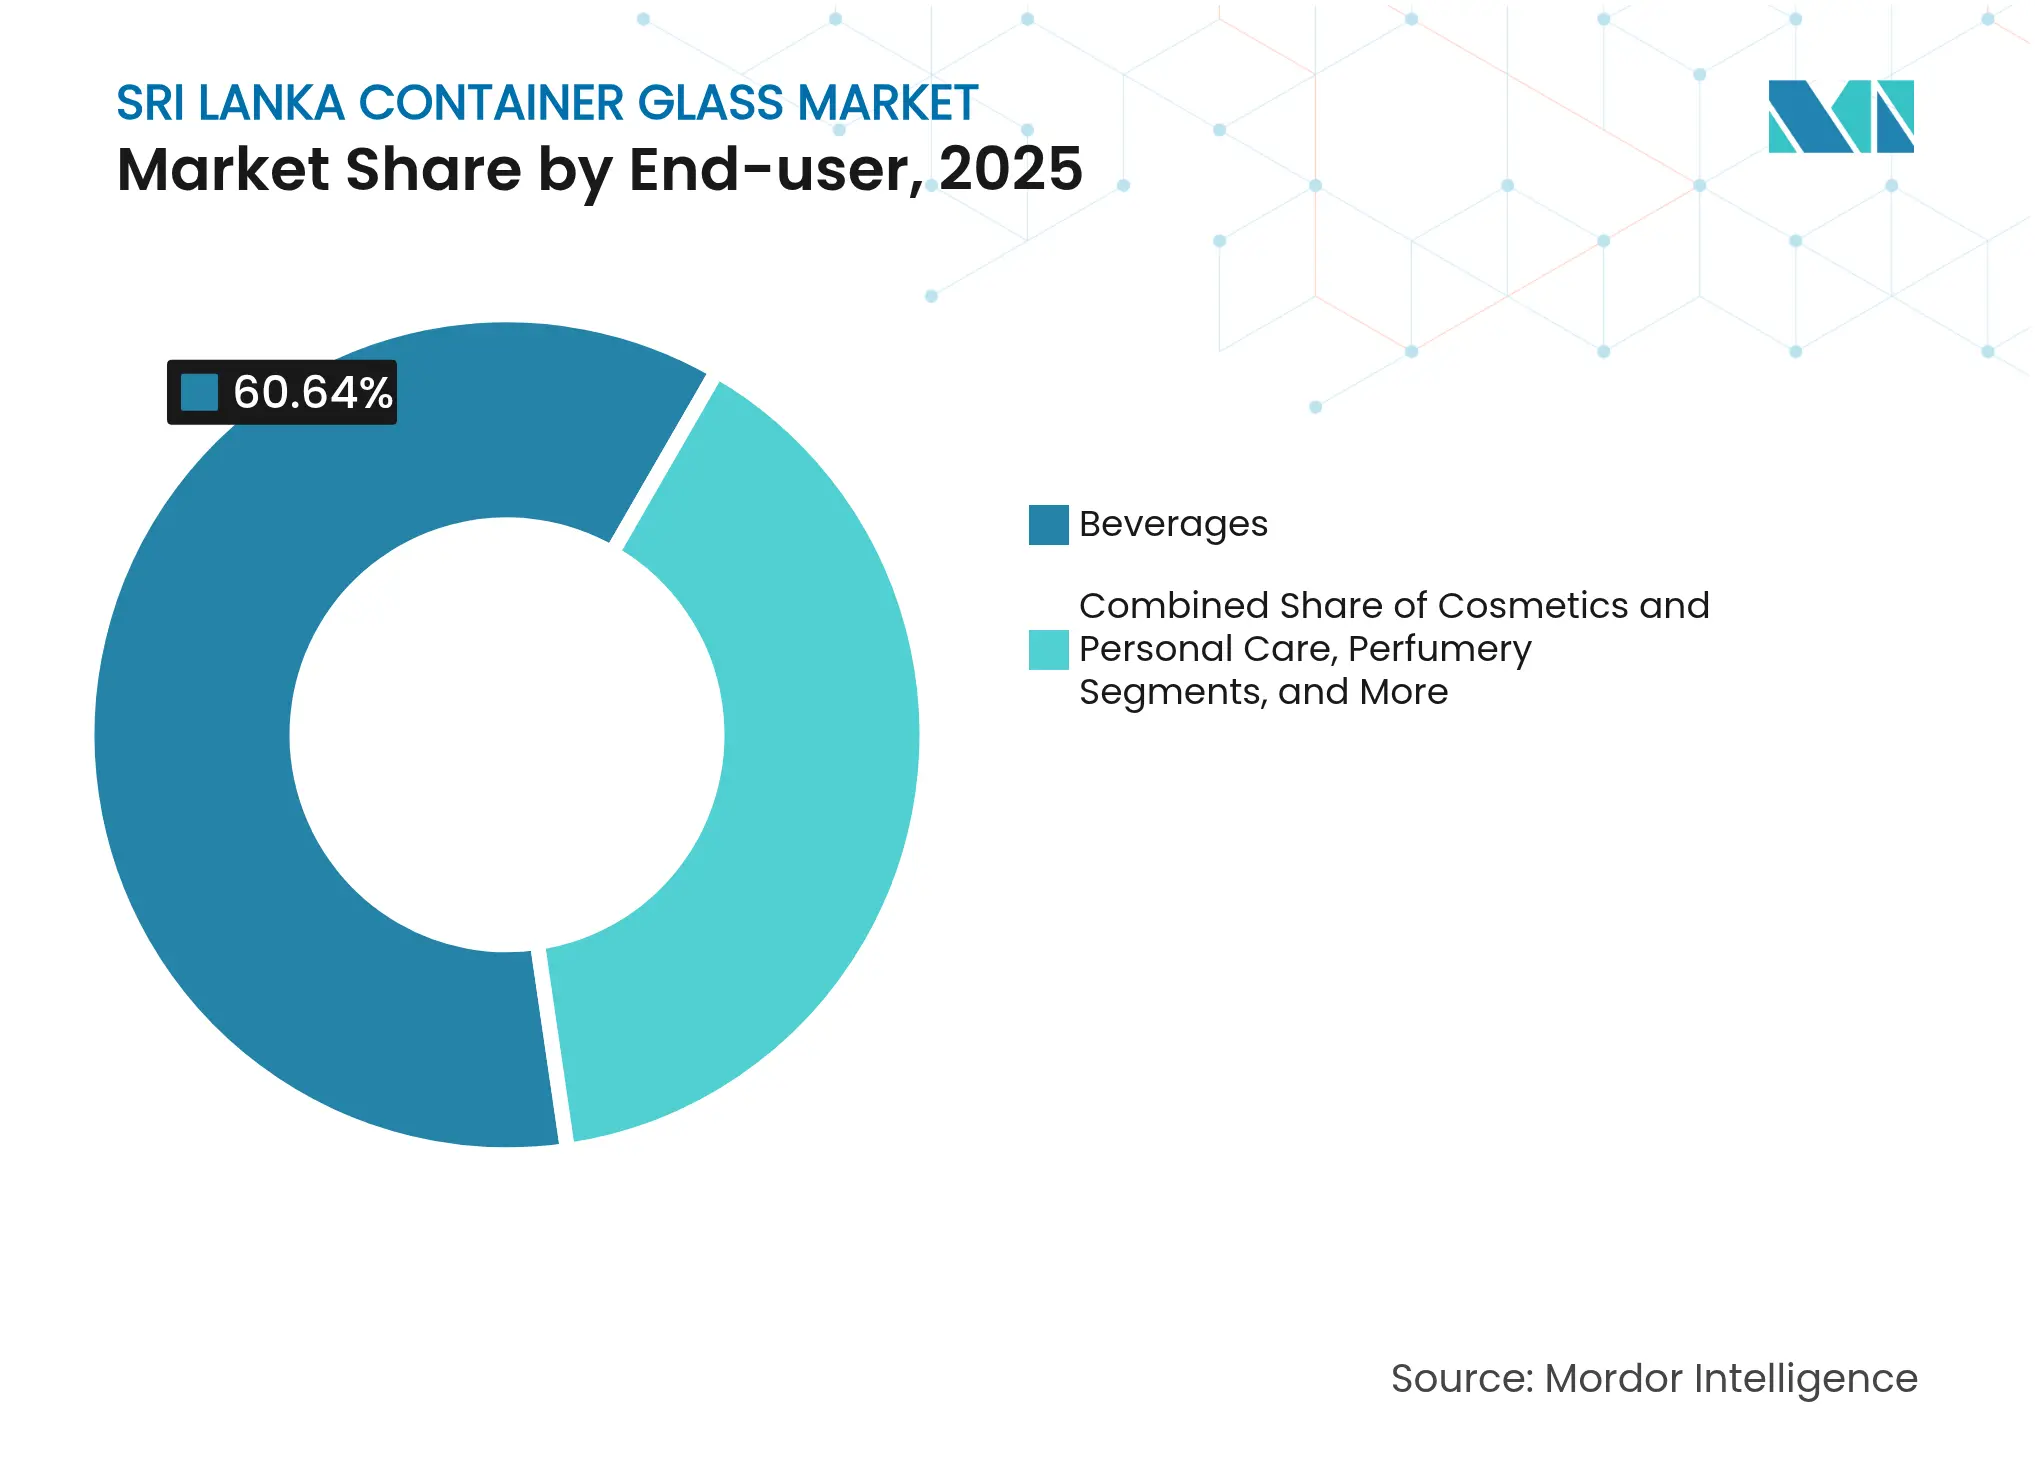
- By end-user, the Sri Lanka container glass market size for the cosmetics and personal care segment is projected to grow at a 2.16% CAGR between 2026-2031.
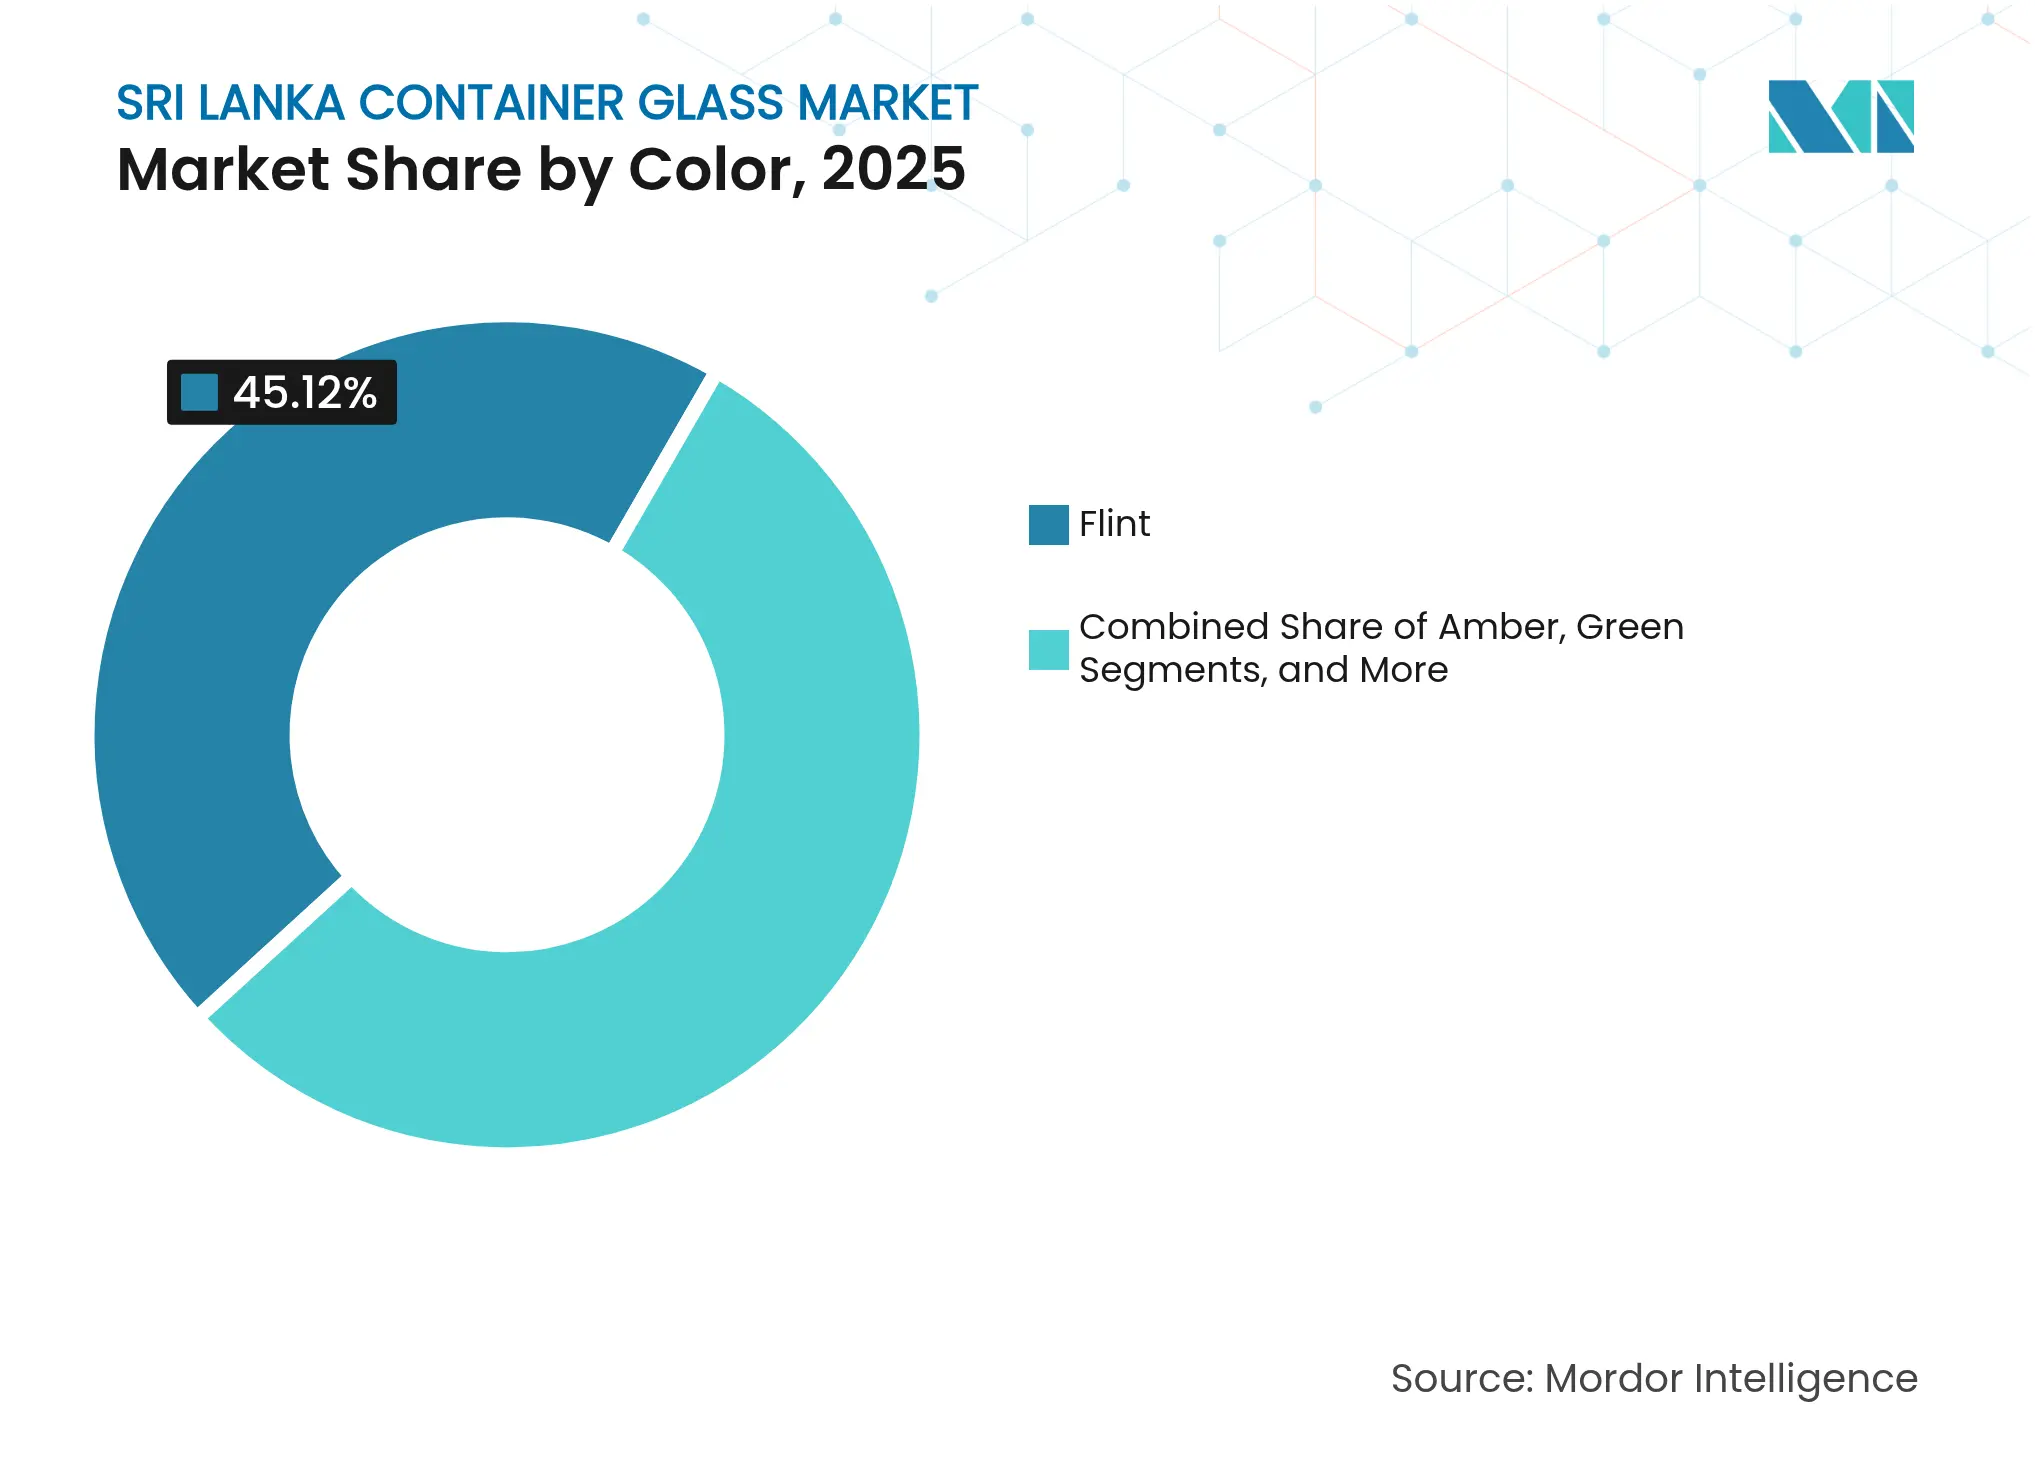
- By color, flint captured 45.12% of the Sri Lanka container glass market share in 2025.
Note: Market size and forecast figures in this report are generated using Mordor Intelligence's proprietary estimation framework, updated with the latest available data and insights as of 2026.
Sri Lanka Container Glass Market Trends and Insights
Drivers Impact Analysis
| Driver | (~) % Impact on CAGR Forecast | Geographic Relevance | Impact Timeline | |||
|---|---|---|---|---|---|---|
Robust post-pandemic rebound of the domestic food and beverage sector Robust post-pandemic rebound of the domestic food and beverage sector | +0.4% | National - Western Province concentration | Medium term (2–4 years) | (~) % Impact on CAGR Forecast:+0.4% | Geographic Relevance:National - Western Province concentration | Impact Timeline:Medium term (2–4 years) |
Duty-free export corridor to India under ISFTA Duty-free export corridor to India under ISFTA | +0.3% | National with Indian export benefits | Long term (≥ 4 years) | |||
Gradual ban on PET bottles in food applications Gradual ban on PET bottles in food applications | +0.2% | National - Central Environment Authority | Medium term (2–4 years) | |||
Tourism-led premium spirits demand spike Tourism-led premium spirits demand spike | +0.2% | Tourist zones nationwide | Short term (≤ 2 years) | |||
Rise of Ayurveda-based nutraceuticals in glass formats Rise of Ayurveda-based nutraceuticals in glass formats | +0.1% | National with wellness-export potential | Long term (≥ 4 years) | |||
On-premise draft-beer growth calling for returnable bottles On-premise draft-beer growth calling for returnable bottles | +0.1% | Urban centers, chiefly Colombo | Medium term (2–4 years) | |||
| Source: Mordor Intelligence | ||||||
Robust Post-Pandemic Rebound of the Domestic Food and Beverage Sector
Sri Lanka’s food and beverage manufacturing output expanded 11.8% in Q1 2024, buoyed by improved raw-material inflows once import controls eased, and by better foreign-exchange availability for ingredient purchases. Higher throughput translates into larger bottle runs for brewers, soft-drink fillers, and sauce manufacturers that collectively dominate the Sri Lanka container glass market. Lion Brewery’s USD 13.3 million innovation center now brews 2,000-liter specialty batches targeting Africa and West Asia, all filled into 92% reusable glass, underscoring the circular advantages of glass within the beverage value chain. Tourism receipts growing 66.1% in the first eight months of 2024 add further pull for premium glass-packaged beverages consumed in hotels, bars, and duty-free outlets. Even so, 23.7% of households remained food-insecure in 2023, indicating that mass-market up-trading into glass is uneven and heavily tied to discretionary spending tiers.
Duty-Free Export Corridor to India Under ISFTA
More than 4,000 tariff lines, including glass bottles, qualify for zero-duty entry into India under the ISFTA, provided shipments contain 35% domestic value addition or 25% with 10% Indian inputs.[2]Department of Commerce Sri Lanka, “Sri Lanka Free Trade Agreement (ISFTA),” DOC.GOV.LK PGP Glass Ceylon’s vertically integrated footprint exceeds the domestic value threshold, granting a structural edge over rival exporters and sustaining the Sri Lankan container glass market in the face of a modest local demand outlook. Indian buyers import niche flint and amber formats that fill gaps in their own product portfolios and favor the quick-turn designs Sri Lankan plants can supply. With Sri Lanka targeting USD 36 billion in exports by 2030, container glass stands positioned to capture a higher share of manufactured goods shipments if capacity expansions proceed.
Gradual Ban on PET Bottles in Food Applications
The Central Environment Authority’s 2023 prohibition on selected single-use plastics opened a legislative pathway toward broader curbs on PET bottles, driving brand owners to evaluate glass substitutes for sauces, condiments, and specialty beverages. The National Action Plan on Plastic Waste Management 2021-2030 outlines a progressive phase-out, while new 2025 labeling rules encourage premiumized, differentiated packaging attributes strongly associated with glass. Government policy is further reinforced by the EU’s EUR 15 million (USD 16.2 million) Global Gateway grant, which finances circular-economy pilots that favor refillable glass in the food sector.
Tourism-Led Premium Spirits Demand Spike
Tourist arrivals rebounded to generate USD 2.1 billion in 2023 and continue rising, directly boosting demand for premium spirits, mixers, and craft beers segments that rely almost exclusively on glass for brand aesthetics and oxidation control. Hotel chains and duty-free operators in Colombo and the southern beach corridor place short-term orders that Sri Lankan plants can fulfill more quickly than imported supplies. Lion Brewery’s export focus on the Maldives and Africa shows tourism-adjacent growth spilling over into regional shipments. However, strict local alcohol marketing laws cap the upside, obliging suppliers to keep agile portfolios that can rotate between tourist-heavy and domestic consumption periods.
Restraints Impact Analysis
| Restraint | (~) % Impact on CAGR Forecast | Geographic Relevance | Impact Timeline | |||
|---|---|---|---|---|---|---|
Industrial-gas price volatility (O₂, N₂, Ar) Industrial-gas price volatility (O₂, N₂, Ar) | -0.3% | Nationwide manufacturing footprint | Short term (≤ 2 years) | (~) % Impact on CAGR Forecast:-0.3% | Geographic Relevance:Nationwide manufacturing footprint | Impact Timeline:Short term (≤ 2 years) |
Chronic electricity shortages and fuel price pass-through Chronic electricity shortages and fuel price pass-through | -0.2% | National grid with regional variance | Medium term (2–4 years) | |||
Limited cullet-collection infrastructure Limited cullet-collection infrastructure | -0.1% | Rural catchment gaps | Long term (≥ 4 years) | |||
High working-capital cycle due to import-led raw materials High working-capital cycle due to import-led raw materials | -0.2% | Import-dependent processors | Medium term (2–4 years) | |||
| Source: Mordor Intelligence | ||||||
Industrial-Gas Price Volatility (O₂, N₂, Ar)
Glass furnaces consume high-purity oxygen and nitrogen at stable flow rates, making producers vulnerable to global gas price fluctuations and Sri Lanka’s persistent foreign exchange constraints. During the 2022-2023 crisis, supply chain friction exacerbated gas shortages, prompting rationalization of batch sizes and an increase in per-unit costs in the Sri Lanka container glass market. While PGP Glass’s dual-fired furnace design allows partial substitution between gas and furnace oil, base-load gas demand remains inflexible. Smaller would-be entrants lack the procurement leverage or storage to buffer these shocks, effectively preserving the market’s concentrated structure.[3]PGP Glass Private Limited, “Annual Report 2023-24,” PGPFIRST.COM
Chronic Electricity Shortages and Fuel Price Pass-Through
High-temperature continuous melting makes container glass uniquely exposed to grid instability. Although improved hydropower in 2024 cut average tariffs, underlying generation deficits persist, and furnace idling during blackouts risks refractory damage and glass-quality defects. PGP Glass mitigates risk through 3.2 MW of rooftop solar and 70% hydropower sourcing; however, diesel backup generation still inflates marginal production costs, thereby tightening price competitiveness against Indian imports. These reliability and cost variables shave 0.2 percentage points off the market’s CAGR forecast.
Segment Analysis
By End-User: Beverage Supremacy Sustained, Personal-Care Acceleration Imminent
Beverages contributed 60.64% of the Sri Lanka container glass market size in 2025 as tourism renewal and export-oriented brewing filled production lines. Premium beer, spirits, and ready-to-drink cocktails utilize heavier, embossed bottles that command a higher value per ton, thereby reinforcing the revenue share advantage of these beverages. Lion Brewery’s reuse rate of 92% lowers bottle float expenses, but it also locks capacity into glass, shielding the category from PET substitution threats. Non-alcoholic carbonated drinks regained shelf space after supply shortages eased, while vitamin-enriched juices create pockets of growth that rely on flint for live-color visibility.
The cosmetics and personal care forecast, at a 2.16% CAGR, draws strength from Ayurveda-formulated facial oils, serums, and essential oils that require inert, UV-protective packaging. PGP Glass’s in-line coating and screen-printing equipment allows small-batch, decorated amber bottles that align with organic branding aesthetics, bridging the gap between local SMEs and global spa chains. As wellness tourism matures, export-facing cosmetic fillers are likely to increase order runs, thereby raising the contribution of this category to the Sri Lanka container glass market size without cannibalizing beverage volume.
Note: Segment shares of all individual segments available upon report purchase
By Color: Flint Dominant, Amber on an Upswing
Flint held 45.12% of the Sri Lanka container glass market share in 2025, favored by beverage and food processors that rely on visual product cues for consumer trust. The demand profile mirrors that of export buyers, who stipulate transparent glass for quality inspection upon arrival, further entrenching flint in the production mix.
Amber, growing at 2.97% CAGR, leverages innate UV-blocking properties to protect botanicals and light-sensitive actives in Ayurveda nutraceuticals and prescription-only medicines. Market sophistication intensifies as brand owners request dimensional and color consistency that PGP’s NNPB (narrow-neck press-and-blow) lines can deliver, thereby elevating value density. As regulatory filings expedite the introduction of herbal remedies into e-commerce export channels, Amber’s share in the Sri Lanka container glass market will continue to advance, absorbing capacity that would otherwise be tied up in lower-margin green and specialty shades.
Note: Segment shares of all individual segments available upon report purchase
Geography Analysis
Sri Lanka’s container glass manufacturing is spatially concentrated in the Western Province where Horana and Nattandiya plants stand within 60 kilometers of Colombo Port. The proximity compresses inbound raw-material trucking costs and accelerates outbound shipments, a logistics edge that helps the Sri Lanka container glass market secure niche orders from regional beverage majors. Rural distribution, however, remains under-developed, limiting bottle returns and cullet capture beyond the western cluster.
Export geography broadens market reach: In 2024, Europe imported USD 1.44 million of Sri Lankan glassware, illustrating a foothold that can scale under stringent traceability rules favoring low-carbon, returnable packaging. India remains the biggest prize, thanks to zero-duty ISFTA lanes and visible demand spikes in premium craft beer bottles during festival seasons. Yet, imports from Hindusthan National Glass inch into Sri Lankan store shelves, proving that freight costs alone no longer insulate local suppliers.
Inland, distribution into Central and Southern Provinces is inhibited by fragmented retail logistics and limited cold-chain infrastructure. Addressing these gaps through multi-modal hubs and producer-responsibility collection points could unlock fresh cullet streams and reduce virgin feedstock dependence, reinforcing the circular profile of the Sri Lanka container glass market. A second furnace in an eastern coastal zone, should one be built, would de-risk production outages and trim haulage to emerging agro-processing centers, balancing geographic supply resilience with export proximity.

Competitive Landscape
Market Concentration
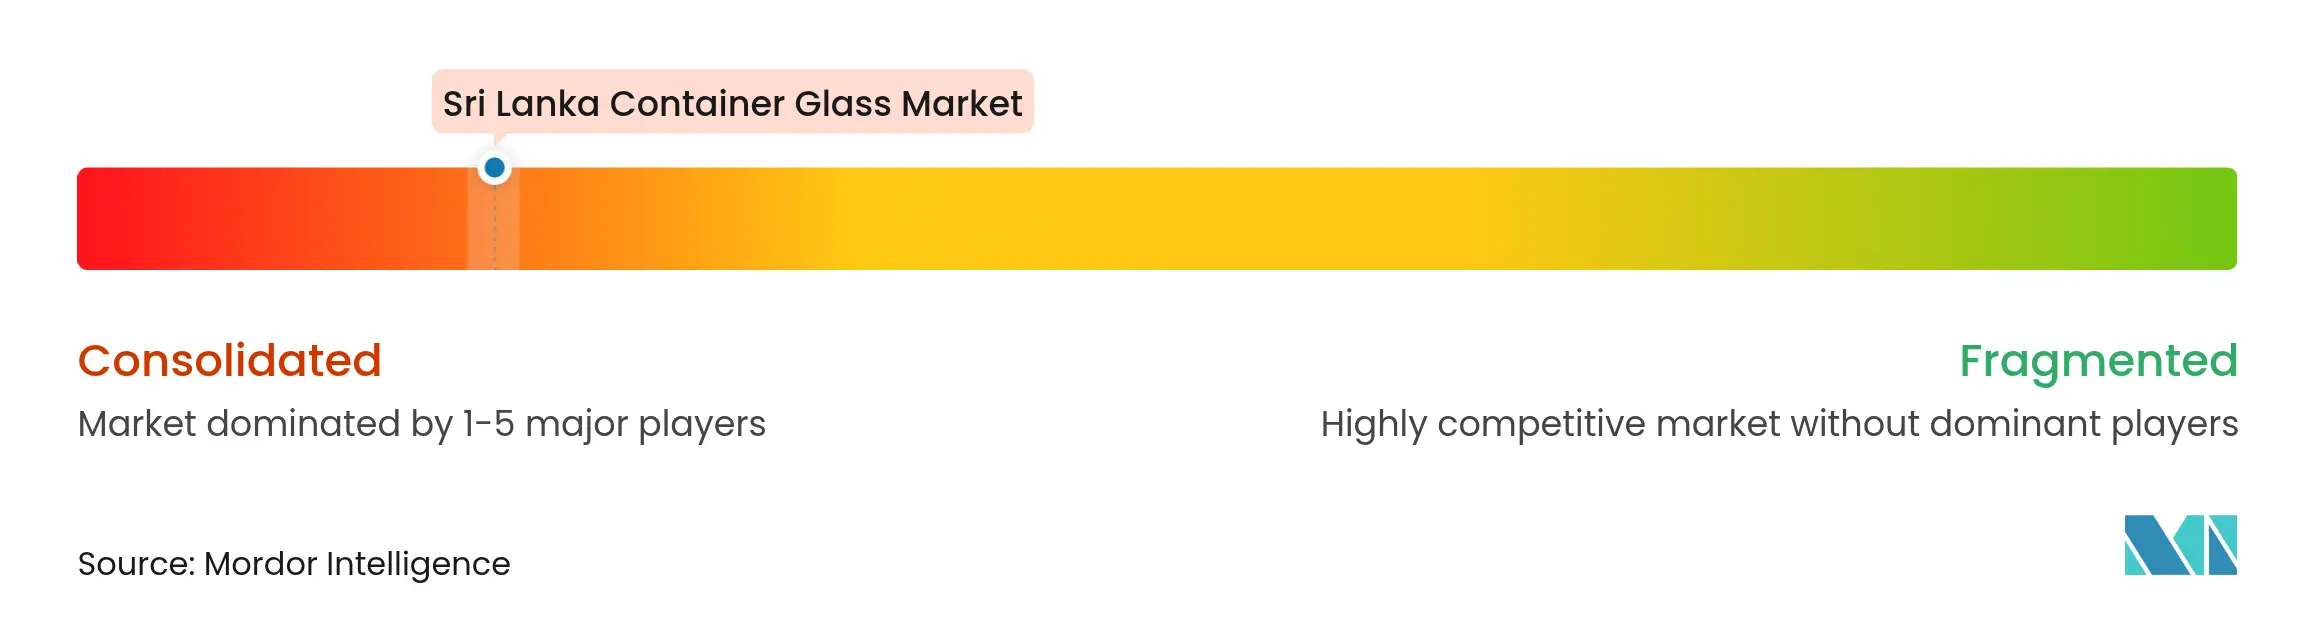
Sri Lanka’s container glass industry ranks among the world’s most concentrated, with PGP Glass Ceylon controlling the entire domestic capacity spectrum, from raw sand beneficiation to bottle decoration. Capital outlays to build a single end-fired furnace exceed USD 50 million, deterring new entrants and cementing the current monopoly. PGP’s 78.65% parent ownership channels technical expertise and bulk raw material procurement into the local subsidiary, creating cost synergies that enable price leadership against imports.
Competition, therefore, materializes mainly across borders: Hindusthan National Glass ships up to 6 million bottles daily from multiple Indian plants, exercising scale economies that can underprice Sri Lankan supply on high-volume SKUs. To differentiate itself, PGP focuses on premium, screen-printed, short-run orders, offering turnaround times unmatched by its overseas rivals. The company’s sustainability award wins in 2025 enhance brand credibility, allowing for higher per-unit margins in eco-labeled segments.
Strategic moves revolve around energy security and design innovation. PGP lifted cullet usage to 33% in FY 2023-24 and installed 3.2 MW of solar to offset diesel, reinforcing its low-carbon profile. On the customer front, the business launched Asia Pacific’s first screen-printed returnable bottle for Heineken Lanka in 2023, a template now pitched to regional craft breweries. Importers, meanwhile, court price-sensitive local brands by bundling bottle supply with credit terms and filler-line maintenance, a value proposition that tests the incumbency advantage. Over the forecast horizon, the Sri Lanka container glass market is likely to stay highly consolidated, provided the incumbents sustain furnace utilization above the economic break-even threshold of 85%.
Sri Lanka Container Glass Industry Leaders

*Disclaimer: Major Players sorted in no particular order
Recent Industry Developments
- February 2025: MYGroup launched a materials-recycling hub in Hikkaduwa focusing on ocean-plastic processing and material recovery.
- January 2025: PGP Glass Ceylon PLC won dual Gold Awards from the National Chamber of Exporters and Sri Lanka Packaging Awards, recognizing export excellence and packaging innovation.
- December 2024: Lion Brewery opened a USD 13.3 million craft-beer innovation center in Biyagama aimed at African, South Asian, and West Asian exports with 92% bottle reuse.
- October 2024: World Bank signed a USD 200 million Development Policy Operation to support tariff reform that will influence raw-material import costs.
Table of Contents for Sri Lanka Container Glass Industry Report
1. INTRODUCTION
- 1.1Study Assumptions and Market Definition
- 1.2Scope of the Study
2. RESEARCH METHODOLOGY
3. EXECUTIVE SUMMARY
4. MARKET LANDSCAPE
- 4.1Market Overview
- 4.2Market Drivers
- 4.2.1Robust post-pandemic rebound of the domestic Fodd and Beverage sector
- 4.2.2Duty-free export corridor to India under ISFTA
- 4.2.3Gradual ban on PET bottles in food applications
- 4.2.4Tourism-led premium spirits demand spike
- 4.2.5Rise of Ayurveda-based nutraceuticals in glass formats
- 4.2.6On-premise draft-beer growth calling for returnable bottles
- 4.3Market Restraints
- 4.3.1Industrial-gas price volatility (O2, N2, Ar)
- 4.3.2Chronic electricity shortages and fuel price pass-through
- 4.3.3Limited cullet collection infrastructure
- 4.3.4High working-capital cycle due to import-led raw materials
- 4.4PESTEL Analysis
- 4.5Industry Value Chain Analysis
- 4.6Container Glass Furnace Capacity and Locations in Sri Lanka
- 4.6.1Plant Locations and Year of Commencement
- 4.6.2Production Capacities
- 4.6.3Types of Furnaces
- 4.6.4Color of Glass Produced
- 4.7Export-Import Data of Container Glass - Covering Key Import and Export Destinations
- 4.7.1Import Volume and Value, 2021-2024
- 4.7.2Export Volume and Value, 2021-2024
- 4.8Porter's Five Forces Analysis
- 4.8.1Threat of New Entrants
- 4.8.2Bargaining Power of Suppliers
- 4.8.3Bargaining Power of Buyers
- 4.8.4Threat of Substitutes
- 4.8.5Competitive Rivalry
- 4.9Raw Material Analysis
- 4.10Recycling Trends for Glass Packaging
- 4.11Demand vs Supply Analysis for Glass Packaging
5. MARKET SIZE AND GROWTH FORECASTS (VOLUME)
- 5.1By End-user
- 5.1.1Beverages
- 5.1.1.1Alcoholic
- 5.1.1.1.1Beer
- 5.1.1.1.2Wine
- 5.1.1.1.3Spirits
- 5.1.1.1.4Other Alcoholic Beverages (Cider and Other Fermented Drinks)
- 5.1.1.2Non-Alcoholic
- 5.1.1.2.1Juices
- 5.1.1.2.2Carbonated Drinks (CSDs)
- 5.1.1.2.3Dairy Product Based Drinks
- 5.1.1.2.4Other Non-Alcoholic Beverages
- 5.1.2Food (Jam, Jelly, Marmalades, Honey, Sausages and Condiments, Oil, Pickles)
- 5.1.3Cosmetics and Personal Care
- 5.1.4Pharmaceuticals (excluding Vials and Ampoules)
- 5.1.5Perfumery
- 5.2By Color
- 5.2.1Green
- 5.2.2Amber
- 5.2.3Flint
- 5.2.4Other Colors
6. COMPETITIVE LANDSCAPE
- 6.1Market Concentration
- 6.2Strategic Moves and Developments
- 6.3Company Market Share Analysis, (Based on Latest Production Capacity)
- 6.4Company Profiles (includes Global level Overview, Market level overview, Core Segments, Financials as available, Strategic Information, Market Rank/Share for key companies, Products and Services, and Recent Developments)
- 6.4.1PGP Glass Ceylon PLC (PGP)
- 6.4.2Mapple Packaging (Pvt) Ltd
- 6.4.3Glass Pack LK
- 6.4.4DHProducts
- 6.4.5Shanghai Hejing Packaging Co., Ltd
- 6.4.6Verallia Indian Ocean Ltd
- 6.4.7Hindusthan National Glass & Industries Ltd
7. MARKET OPPORTUNITIES AND FUTURE OUTLOOK
- 7.1White-space and Unmet-Need Assessment
Sri Lanka Container Glass Market Report Scope
Container glass is designed for manufacturing glass containers, including bottles, jars, drinkware, and bowls. Its key attributes include chemical inertness, sterility, and non-permeability, rendering it especially sought after in the beverage, food, pharmaceutical, and cosmetic sectors. The research also examines underlying growth influencers and significant industry vendors, all of which help to support market estimates and growth rates throughout the anticipated period. The market estimates and projections are based on the base year factors and arrived at top-down and bottom-up approaches.
Sri Lanka container glass market is segmented by end-user vertical (beverages [alcoholic beverages (beer, wine, spirits, and other alcoholic beverages {cider and other fermented drinks}), non-alcoholic beverages (juices, carbonated drinks (CSDs), dairy product-based drinks, other non-alcoholic beverages)], food [jam, jelly, marmalades, honey, sausages and condiments, oil, pickles], cosmetics and personal care, pharmaceuticals (excluding vials and ampoules), and perfumery), by color (green, amber, flint and other colors). The report offers market forecasts and size in volume (kilotons) for all the above segments.