
Squalene Market Size and Share
Market Overview
| Study Period | 2021 - 2031 |
|---|---|
| Market Size (2026) | USD 182.14 Million |
| Market Size (2031) | USD 243.28 Million |
| Growth Rate (2026 - 2031) | 5.96 % |
| Fastest Growing Market | Asia Pacific |
| Largest Market | Europe |
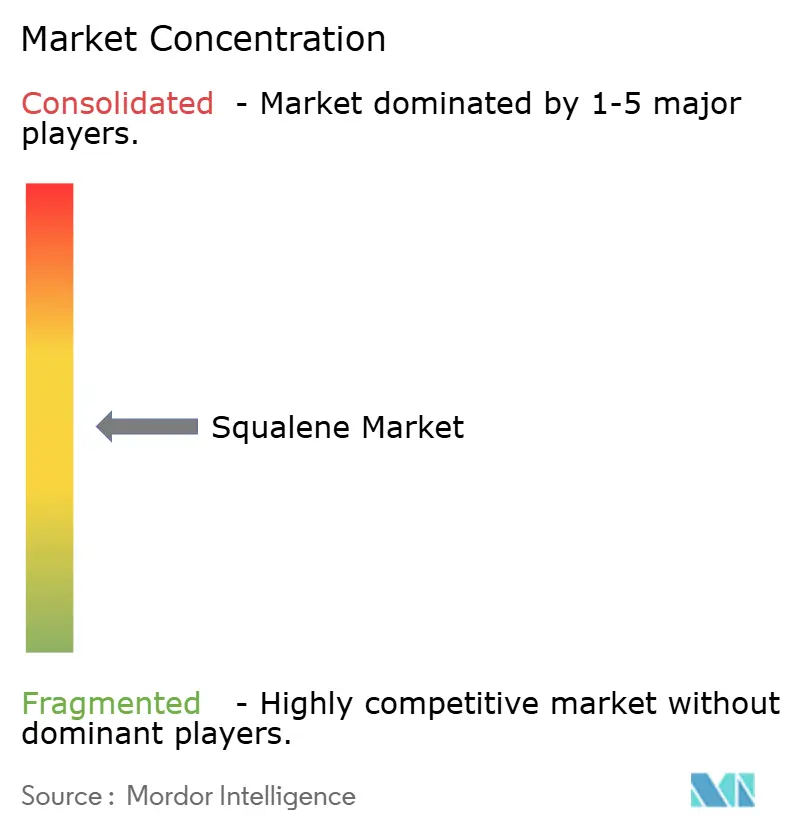
| Market Concentration | Medium |
Major Players *Disclaimer: Major Players sorted in no particular order Image © Mordor Intelligence. Reuse requires attribution under CC BY 4.0. | |
Squalene Market Analysis by Mordor Intelligence
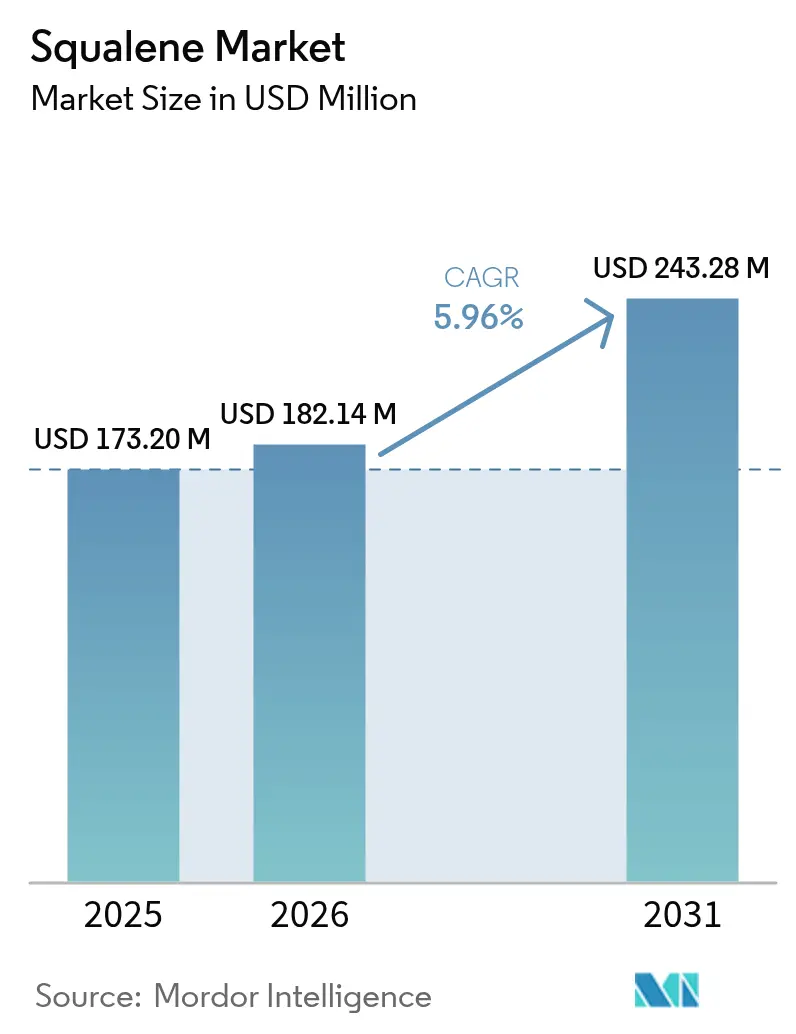
The Squalene Market size is expected to grow from USD 173.20 million in 2025 to USD 182.14 million in 2026 and is forecast to reach USD 243.28 million by 2031 at 5.96% CAGR over 2026-2031. Rising preference for plant-derived and biosynthetic grades is realigning supply chains that had long depended on shark-liver extraction. Accelerated adoption in cosmetics reflects persistent clean-beauty demand, while vaccine adjuvants and oncology nano-delivery platforms are opening pharmaceutical-grade opportunities that capture premium margins. Regulatory bans on shark-sourced inputs and falling fermentation costs have narrowed the historic price gap between marine and sustainable feedstocks, spurring a bifurcated landscape in which cosmetic grade drives volume but pharmaceutical grade anchors profitability. Even so, drought-driven olive-oil volatility and elevated sugar prices for fermentation can trigger episodic cost spikes that challenge margin stability.
Key Report Takeaways
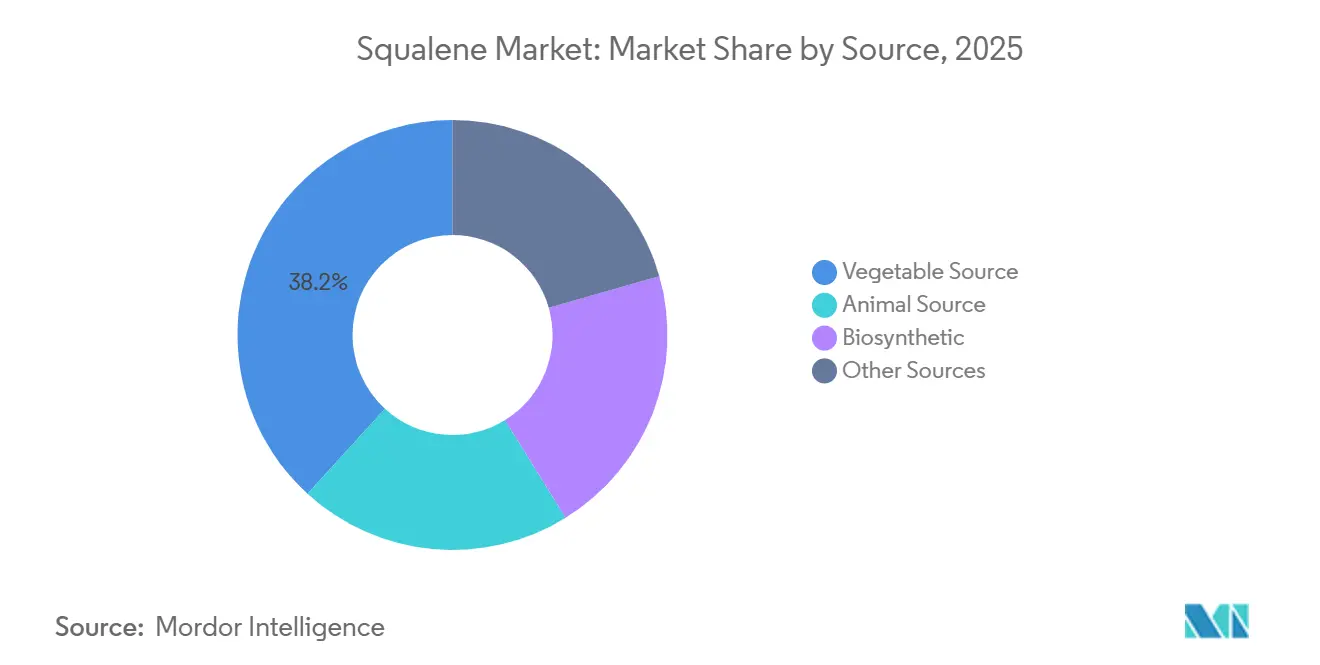
- By source, vegetable source commanded 38.22% of squalene market share in 2025 and is forecast to advance at a 6.96% CAGR through 2031.
- By purity grade, cosmetic grade held 68.85% of the squalene market size in 2025 and is projected to expand at a 6.58% CAGR to 2031.
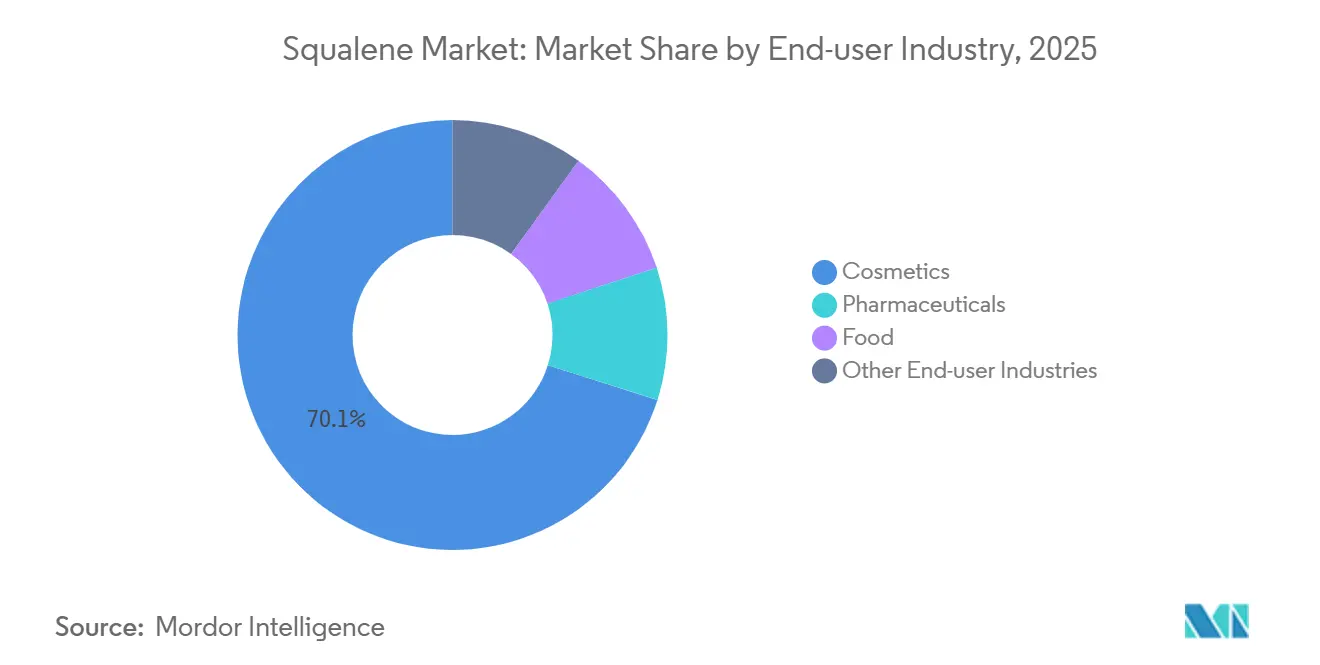
- By end-user industry, cosmetics accounted for 70.12% share of the squalene market size in 2025 and is growing at a 6.64% CAGR through 2031.
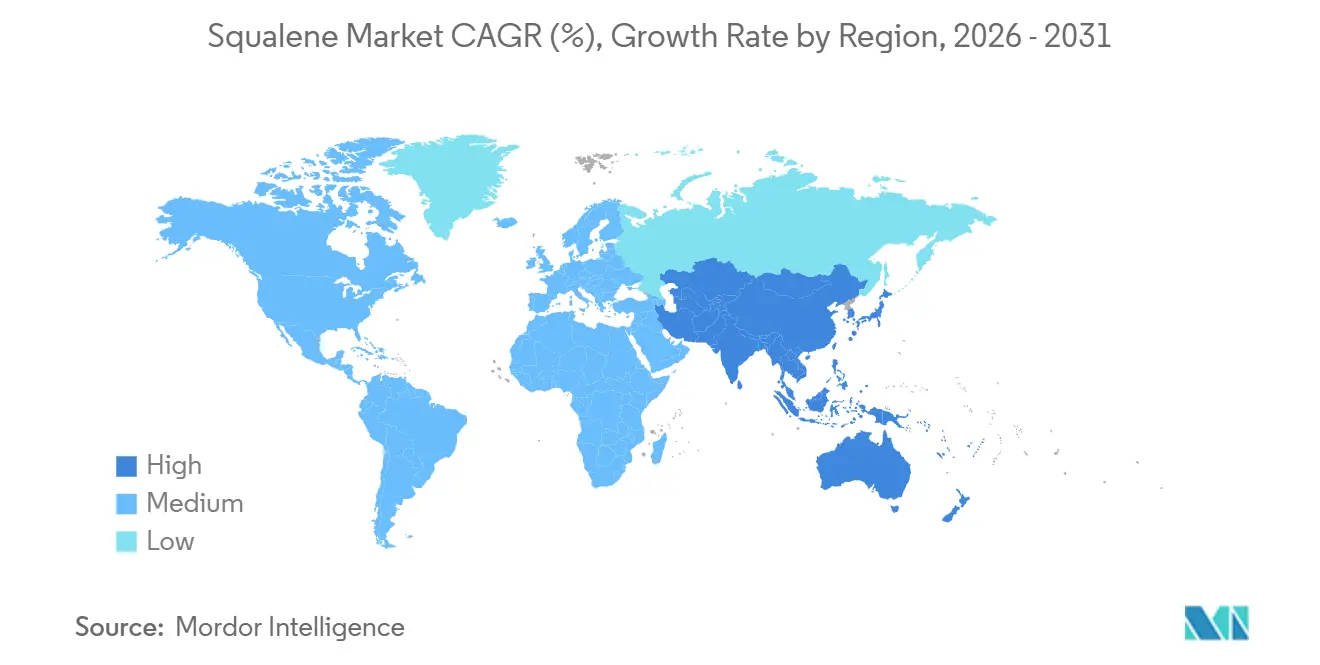
- By geography, Europe captured 42.08% of squalene market share in 2025; Asia-Pacific is the fastest-growing region at a 6.79% CAGR through 2031.
Note: Market size and forecast figures in this report are generated using Mordor Intelligence’s proprietary estimation framework, updated with the latest available data and insights as of 2026.
Market Trends and Insights
Drivers Impact Analysis of Squalene Market*
| Driver | (~) % Impact on CAGR Forecast | Geographic Relevance | Impact Timeline |
|---|---|---|---|
| Clean-beauty boom boosting plant and bio-fermented supply | +1.8% | Global, with concentration in North America, Western Europe, and urban Asia-Pacific markets | Medium term (2-4 years) |
| Accelerating use in next-gen vaccine adjuvants | +1.5% | Global, with early adoption in North America and Europe for pandemic-preparedness stockpiles | Long term (≥ 4 years) |
| Synthetic-biology cost curve crossing shark-oil pricing | +1.2% | Global, with production hubs in Brazil, United States, and emerging fermentation clusters in China | Medium term (2-4 years) |
| Regulatory tailwinds banning shark-sourced ingredients | +1.0% | North America, European Union, and select Asia-Pacific jurisdictions (Taiwan, Australia) | Short term (≤ 2 years) |
| Emerging oncology nano-delivery trials adopting high-purity squalene | +0.8% | North America and Europe, with spillover to leading cancer-research centers in Asia-Pacific | Long term (≥ 4 years) |
| Source: Mordor Intelligence | |||


Clean-Beauty Boom Boosting Plant and Bio-Fermented Supply
Growing consumer insistence on transparent, cruelty-free labels is forcing cosmetic majors to abandon shark-derived squalene, a shift that has catalyzed capital allocation into olive, amaranth, and fermentation routes. Enzymatic extraction now recovers 0.5-1.0% of squalene from vegetable feedstock, roughly double solvent yields, tightening the squalene market supply chain and improving sustainability credentials. Evonik’s PhytoSquene, launched in 2023 and compliant with European Pharmacopoeia, illustrates how clean-beauty preferences dovetail with pharmaceutical-grade requirements. French refiner Sophim raised USD 21.5 million in 2023 to double olive-based capacity, responding to cosmetics and food players willing to pay 20-30% premiums for verified plant origin. Major beauty retailers now oblige suppliers to state squalene provenance on labels, effectively excluding shark sources even where law does not yet impose an outright ban. Industry observers expect shark-oil’s contribution to global supply to fall below 10% by 2028 as brands preempt reputational risk.
Accelerating Use in Next-Gen Vaccine Adjuvants
Squalene-containing adjuvants such as MF59 and Sepivac SWE have validated safety at scale, encouraging government stockpiles for pandemic-preparedness. Seqirus’s MF59 appears in more than 100 million administered flu vaccine doses, providing a regulatory benchmark that late-stage COVID-19 and universal influenza candidates are following. Microfluidic manufacturing, demonstrated in 2024, shortens batch time to seven hours and delivers 200-liter GMP emulsions, producing material for 5 million doses while lowering capital intensity for contract manufacturers by 40%. These efficiencies position decentralized facilities in emerging markets to meet surging demand without heavy investment. Early-phase oncology immunotherapies are also trialing squalene adjuvant systems that stimulate T-cell responses, hinting at broader pharmaceutical uptake. If regulatory approvals accelerate, pharmaceutical-grade offtake could exceed current forecasts and stretch capacity in the squalene market.
Synthetic-Biology Cost Curve Crossing Shark-Oil Pricing
Fermentation processes now deliver cosmetic-grade material at USD 50-70 per kg, matching or undercutting marine supply when compliance and ethical costs are considered. Amyris’s Barra Bonita plant in Brazil, retaining 1.8 million liter capacity after a 2026 line expansion, showcases economic viability despite Chapter 11 restructuring. Croda’s 2023 licensing of Amyris technology secures pharmaceutical-grade batches that avoid peroxide and heavy-metal purification steps required for shark-oil, trimming USD 20-30 per kg relative downstream expenses. Academic metabolic-engineering studies reach lab yields of 2-4 g/L in engineered cyanobacteria, and scale-up could drive cost to USD 30-40 per kg by 2028. Continuous drops in biosynthetic cost therefore tighten price dispersion among all sustainable grades in the squalene market.
Regulatory Tailwinds Banning Shark-Sourced Ingredients
CITES restricted liver-oil trade for deep-sea sharks in 2025, adding paperwork hurdles that disincentivize exporters. Taiwan and Australia mandate origin declarations that de facto eliminate shark-based imports, while the European Union’s cosmetics rules require ingredient transparency, letting consumer pressure do the rest. In the United States, policy think-tanks such as the National Security Commission on Emerging Biotechnology cast 2.7 million-shark annual harvests as a supply-chain risk, foreshadowing possible federal constraints[1]National Security Commission on Emerging Biotechnology, “Bio-Manufacturing Supply-Chain Report,” nsceb.gov . This regulatory momentum favors vegetable and biosynthetic capacity, further driving the squalene market toward sustainable sources.
Restraints Impact Analysis of Squalene Market*
| Restraint | (~) % Impact on CAGR Forecast | Geographic Relevance | Impact Timeline |
|---|---|---|---|
| Climate-linked volatility in olive and amaranth feedstock pricing | -0.9% | Mediterranean Europe (Spain, Italy, Greece), South America (Argentina, Peru) | Short term (≤ 2 years) |
| Global fermentation-grade sugar price spikes (biofuel competition) | -0.7% | Brazil, India, Thailand, and other sugarcane-producing regions with ethanol mandates | Medium term (2-4 years) |
| Pharmaceutical-grade capacity bottlenecks for lipid adjuvants | -0.5% | Global, with acute constraints in North America and Europe where GMP certification timelines are longest | Medium term (2-4 years) |
| Source: Mordor Intelligence | |||
Climate-Linked Volatility in Olive and Amaranth Feedstock Pricing
Mediterranean droughts cut Spanish and Italian olive yields during 2023-2024, lifting feedstock costs and squeezing refiners without long-term contracts[2]OECD-FAO, “Agricultural Outlook 2024-2033,” oecd-fao.org . Amaranth harvests in the Andes fluctuate 20-30% year on year, compelling processors to carry costly inventory buffers. Meanwhile, 16% of global vegetable oil now flows into biodiesel, diverting raw materials that could otherwise become squalene. The dual shocks of climate and biofuel demand can compress cosmetic-grade margins by 15-25% within a quarter. Unless drought-resistant cultivars scale quickly, price volatility will remain a near-term headwind for the squalene market.
Global Fermentation-Grade Sugar Price Spikes (Biofuel Competition)
Brazil’s RenovaBio and India’s E20 mandate channel sugarcane toward ethanol, tightening sucrose availability for biochemical fermentation. Elevated sugar costs have already forced Amyris to test molasses and bagasse hydrolysates, but added pretreatment lifts unit cost USD 5-10 per kg. Because GMP revalidation takes at least a year, producers cannot easily switch feedstocks without delaying pharmaceutical deliveries. Elevated sugar prices are thus a structural restraint on biosynthetic expansion and can temper the upside potential of the squalene market over the medium term.
*Our forecasts treat driver/restraint impacts as directional, not additive. The impact forecasts reflect baseline growth, mix effects, and variable interactions.
Squalene Market Segment Analysis
By Source:
Vegetable and Biosynthetic Grades AscendantVegetable-source squalene represented 38.22% of squalene market share in 2025 and is projected to advance at a 6.96% CAGR, outperforming animal-derived supply. Expansion by olive refiners in Spain and France and amaranth processors in Argentina and Peru is supported by capital aimed at meeting GMP requirements for both cosmetic and pharmaceutical channels. The squalene market size for vegetable source is therefore set to climb steadily as retail mandates solidify plant-only positioning in prestige beauty.
Biosynthetic is growing already indispensable for vaccine adjuvants. Amyris’s 1.8 million-liter Barra Bonita footprint anchors global supply agreements with Croda, which uses the feedstock for pharmaceutical-grade emulsions. Ongoing metabolic-engineering breakthroughs promise even greater yields that can trim cost curves further. Conversely, animal-source share is shrinking under CITES trade limits and consumer backlash. As more jurisdictions legislate origin labeling, shark-oil segments will continue to decline, reinforcing a structural pivot toward sustainable feedstocks in the squalene market.


By Purity Grade:
Cosmetic Volume vs. Pharmaceutical MarginCosmetic grade comprised 68.85% of 2025 volume and is on course for a 6.58% CAGR. Reformulation away from shark oil has pushed legacy and indie brands alike to specify olive, amaranth, or biosynthetic grades, turning supply transparency into a selling point on retail shelves. Sustainable positioning supports price resilience even when raw-material costs rise.
The squalene market size for pharmaceutical grade is also projected to widen as adjuvant stockpiles increase and oncology nano-delivery trials progress. Croda’s and Evonik’s GMP lines meet European Pharmacopoeia standards, giving them pricing leverage especially during vaccine surges. Food grade is expanding into nutraceutical softgels and fortification, but total uptake remains modest relative to topical cosmetics.
By End-user Industry:
Cosmetics Lead, Pharma Gains MomentumCosmetics captured 70.12% share of the overall squalene market size in 2025, expanding at a 6.64% CAGR through 2031. Anti-aging serums, moisturizers, and hair-care treatments value squalene’s emollient and oxidative-stability properties, and ingredient-disclosure requirements are nudging even mass brands into sustainable sources.
Pharmaceutical usage is smaller but rising swiftly. MF59, Sepivac SWE, and new TLR-agonist systems underline growth potential in both pandemic preparedness and immuno-oncology. If even a few pipeline candidates win approval, the squalene market share for pharmaceutical end users could climb significantly, absorbing much of the forthcoming biosynthetic capacity. Food, lubricant, and specialty-chemical applications remain niche but deliver diversification upside, especially where squalene’s thermal stability outperforms petro-based analogs.
Geography Analysis
Europe Squalene Market
Europe held 42.08% squalene market share in 2025, anchored by legacy olive supply chains in Spain, Italy, and France and by GMP plants serving vaccine hubs. The EU cosmetics rulebook obliges INCI transparency, favoring plant or biosynthetic inputs over shark derivatives, and regional refiners such as Sophim have expanded to capture both cosmetic and food verticals. Evonik’s PhytoSquene award underscores Europe’s commitment to pharmaceutical-grade innovation.
North America Squalene Market
North America benefits from clean-beauty enthusiasm and government assessments framing biosynthetic squalene as a strategic asset. Nearshoring of vegetable refining into Mexico adds logistical resilience, while U.S. firms monitor potential regulatory shifts that could mirror Europe’s stricter stance on animal sourcing.
APAC Squalene Market
Asia-Pacific is the fastest-growing region, advancing at 6.79% CAGR through 2031. Chinese, Indian, and Korean brands are incorporating plant-based and biosynthetic squalene into affordable SKUs, widening addressable volume. India’s vaccine-manufacturing expansion seeks cost-effective GMP squalene, and local fermentation clusters can meet both domestic and export demand. Japanese and South-Korean premium brands employ squalene to cement skin-compatible reputations, while Southeast Asian nations explore palm and coconut-based extraction despite lower yields.
MEA and South America Squalene Market
South America merges Brazil’s fermentation leadership with Argentina’s and Peru’s amaranth agriculture. Amyris’s plant signals export potential if feedstock costs stabilize. Middle-East and Africa currently import most requirements, yet vaccine facility build-outs in Saudi Arabia and Egypt imply future pharmaceutical-grade demand.

Regulatory Landscape
Squalene used in cosmetics is primarily governed by product safety and ingredient disclosure frameworks rather than substance bans. In the European Union, cosmetic uses fall under Regulation (EC) No 1223/2009 (consolidated text updated through April 2024), where squalene is not broadly listed as a prohibited or restricted cosmetic substance; however, animal-origin sourcing can introduce additional compliance obligations, including traceability and controls linked to animal by-product rules (e.g., Regulation (EC) No 1069/2009). Separately, EEA chemical compliance under REACH can apply to manufacturers and importers based on tonnage, which affects documentation and data requirements for supply into Europe.
In the United States, squalene has a long safety record in personal care, supported by the Cosmetic Ingredient Review (CIR) Expert Panel (affirmed in 2019). FDA oversight depends on intended use and claims (cosmetic versus drug), and for pharmaceutical and vaccine-adjuvant applications, substance identification and quality expectations (including established identifiers such as UNII listings and pharmacopeial alignment) place more weight on GMP controls, impurity profiles, and batch consistency. This quality framework reinforces the market shift toward traceable plant-derived and biosynthetic supply chains.
Value Chain Analysis
Upstream supply starts with feedstocks that shape both sustainability credentials and impurity burdens. Shark liver oil offers high squalene concentration but requires more intensive purification due to potential persistent organic pollutants and heavy metals. By contrast, plant sources (olive, amaranth and other vegetable oils) and fermentation routes deliver lower native concentration but provide stronger provenance control. Extraction and primary processing typically include crushing/refining of oils, solvent or enzymatic recovery, and initial concentration steps, and enzymatic approaches are increasingly used to improve recovery efficiency from vegetable streams. Fermentation-based production also depends on carbohydrate inputs and engineered strains, followed by downstream purification to reach cosmetic, food, or pharmaceutical specifications.
Midstream conversion and qualification are dominated by GMP and pharmacopeial requirements for parenteral-grade material used in vaccine adjuvants. Quality systems, validated purification, and documentation become key bottlenecks. Evonik's plant-based, GMP-grade PhytoSquene, aligned with European Pharmacopoeia expectations, illustrates what qualifies for this stage, as does Croda's exclusive license agreement with Amyris (signed in 2023) to secure biotechnology-derived, pharmaceutical-grade squalene for vaccine-adjuvant supply chains. Downstream channels then split into cosmetics, where retailers and brand policies increasingly require declared provenance and consistent sensorial performance, and pharmaceuticals, where adjuvant manufacturers and CMOs prioritize validated quality and secure supply, often through regional ingredient distributors for cosmetics and direct qualification-based supply for pharma accounts.
Competitive Landscape
The squalene market remains moderately fragmented. Croda, Evonik, and Sophim anchor established plant-based and pharmaceutical channels, while Amyris leads biosynthetic output despite its restructuring. Croda’s 2023 agreement secures exclusive access to Amyris fermentation batches for vaccine adjuvants, illustrating how incumbents hedge supply-chain risk. Evonik’s PhytoSquene expands vegetable grades into GMP territory and garners premium pricing.
Emerging players pursue microalgae and engineered-microbe routes. Laboratory yields show promise, yet capital intensity and scale-up risks continue to deter immediate commercialization. Technology differentiation focuses on microfluidic adjuvant production that cuts batch time and capex, a feature attractive to contract manufacturers under pandemic-preparedness mandates. Patent filings around squalene-drug conjugates indicate intensifying R&D race for oncology applications.
Regulatory certification differentiates winners. USP compliance allows 30-50% price premiums, especially when vaccine programs surge. Cosmetic-grade sellers, by contrast, confront commoditization unless vertically integrated into the raw olive or sugar supply. Collective moves imply sharpening competition over sustainable feedstock control and pharmaceutical-grade throughput, shaping the next growth phase of the squalene market.
Squalene Industry Leaders
Croda International Plc
Sophim
Amyris
efpbiotek
KISHIMOTO SPECIAL LIVER OIL CO., LTD.
- *Disclaimer: Major Players sorted in no particular order
Squalene Market Companies Covered in this Report
- Aasha Biochem
- Amyris
- Arista Industries, Inc.
- Croda International Plc
- efpbiotek
- Evonik Industries AG
- GIHI CHEMICALS CO., LIMITED
- KISHIMOTO SPECIAL LIVER OIL CO., LTD.
- KURARAY CO., LTD.
- Oleicfat SL
- ROELMI HPC
- SeaDragon
- Seppic
- Sophim
- Unilong Industry Co., Ltd.
- Vestan

Market Opportunities and Future Outlook
A clear whitespace sits at the intersection of sustainability and parenteral-grade performance, where demand for adjuvant-ready squalene favors suppliers that can document traceability while meeting stringent impurity limits and batch consistency. Existing commercial activity reflects this direction. Croda's exclusive licensing arrangement with Amyris for biotechnology-derived, pharmaceutical-grade squalene and Evonik's GMP-grade, plant-based PhytoSquene both position suppliers around vaccine-adjuvant requirements rather than only cosmetic emollients. Process innovations that compress manufacturing timelines also support alternative models for GMP capacity, as microfluidic adjuvant manufacturing demonstrations (reported in 2024) reduced batch time and improved capital efficiency for producing GMP emulsions, widening the set of qualified producers beyond traditional large sites.
Technology-led opportunities continue to develop in microbial platforms and strain engineering, targeting higher titers and lower unit costs while maintaining non-animal sourcing. Published research in January 2026 demonstrated enhanced squalene production in Yarrowia lipolytica through metabolic engineering and adaptive laboratory evolution, with broader academic work also validating industrial feasibility in microbial hosts such as thraustochytrids (e.g., Thraustochytrium and Aurantiochytrium). For cosmetics, provenance-flexible, plant-based emollients create an additional adoption pathway in markets with stricter standards, including launches positioned for Japanese quasi-drug requirements and expanded distributor coverage in Oceania. Together, these moves support scaling plant-derived portfolios while reducing dependency on volatile single-crop supply.
Recent Industry Developments in Squalene Market
- June 2026: SOPHIM announced a partnership with Avenir Ingredients as the official distributor for New Zealand, expanding availability of its natural ingredient portfolio including Phytosqualan Olive and Phytosqualan VG. The move strengthens SOPHIM's route-to-market in Oceania for plant-derived squalene/squalane alternatives and supports brand reformulations that require verified non-animal sourcing.
- May 2025: Amyris completed the fourth independent precision fermentation line at its Barra Bonita industrial fermentation plant in Brazil. Adding capacity at a large-scale site supports higher output of fermentation-derived specialty ingredients used across applications that include squalene-related supply chains, improving the ability to service larger-volume, consistency-sensitive programs.
- April 2024: SOPHIM launched Phytosqualan QD Grade, positioned to enable compliance with Japanese quasi-drug standards. This product positioning helps customers address market-specific regulatory and quality requirements, widening adoption pathways for plant-based squalene/squalane in regulated personal care segments.


Squalene Market Report Scope and Research Methodology
Market Definition and Coverage
This market covers the USD value of squalene sold as an ingredient for commercial use, where volumes are ultimately applied in cosmetics and personal care, pharmaceuticals, and food or nutraceutical formulations. Sizing is expressed in USD value for the defined geography set and time period.
Scope exclusions: Downstream finished products that only contain squalene as a minor component (such as creams, capsules, and finished medicines) are excluded from this scope.
Segments Covered in This Report
- By Source
- Vegetable Source
- Animal Source
- Biosynthetic
- Other Sources
- By Purity Grade
- Cosmetic Grade
- Pharmaceutical (GMP) Grade
- Food Grade
- By End-user Industry
- Cosmetics
- Pharmaceuticals
- Food
- Other End-user Industries
- By Geography
- Asia-Pacific
- China
- India
- Japan
- South Korea
- Malaysia
- Thailand
- Indonesia
- Vietnam
- Rest of Asia-Pacific
- North America
- United States
- Canada
- Mexico
- Europe
- Germany
- United Kingdom
- France
- Italy
- Spain
- NORDIC Countries
- Russia
- Turkey
- Rest of Europe
- South America
- Brazil
- Argentina
- Colombia
- Rest of South America
- Middle-East and Africa
- Saudi Arabia
- United Arab Emirates
- Qatar
- Egypt
- Nigeria
- South Africa
- Rest of Middle-East and Africa
- Asia-Pacific
Data Sources, Market Sizing, and Validation
Desk Research
Desk research was used to establish the fact base on squalene supply routes and demand signals before we built the market model. We relied on public sources such as FDA and USP references for ingredient and quality context, the European Medicines Agency for pharmaceutical manufacturing cues, and trade data portals such as UN Comtrade for import and export patterns tied to key producing and consuming regions.
We also reviewed sources such as USITC DataWeb and Eurostat for trade direction and unit value trends, alongside peer reviewed articles that discuss sourcing shifts, including plant and fermentation routes. Company filings, investor presentations, and reputable press were reviewed to understand capacity additions, product positioning, and end market exposure, which helped keep assumptions grounded. Where needed, paid subscriptions for company financials and patent databases supported cross checks on supplier activity and innovation signals. These examples are not exhaustive, and other public and paid sources were also referenced for data collection, validation, and clarification.
Primary Interviews and Surveys
Primary work was carried out through expert interviews and structured surveys with participants across the squalene value chain, including ingredient suppliers, processors, distributors, and buyers serving cosmetics, pharma, and nutrition brands. For a global market, we ensured input was captured across APAC, EMEA, and the Americas, so regional pricing, purity requirements, and sourcing constraints could be compared and then reconciled into one consistent model.
Distribution of primary research fieldwork respondents
| Company type | Respondent position | Region |
|---|---|---|
| Top tier: 27% | CXOs: 13% | APAC: 42% |
| Mid tier: 56% | Functional/Unit leaders: 29% | EMEA: 36% |
| Smaller Players: 17% | Managers: 58% | Americas: 22% |
Market-Sizing & Forecasting
Market sizing starts with a top down build where trade flows and end use demand indicators are used to reconstruct the ingredient consumption pool by region, which is then translated into value using observed price ranges by purity and source type. After the first pass totals are formed, they are cross checked with selective bottom up approximations, such as sampled supplier revenue splits, distributor channel checks, and volume by application multiplied by representative ASPs.
Inputs that were most helpful included shifts between animal, vegetable, and biosynthetic sourcing, the mix of cosmetic grade versus pharmaceutical (GMP) and food grade demand, and observed price spreads tied to purity and regulatory requirements. We also tracked signals like cosmetics and personal care formulation activity, nutraceutical launches that reference squalene or related lipids, and trade unit values that move with raw material costs and capacity utilization. For forecasting, scenario analysis was used, since adoption of biosynthetic supply, regulatory pressure on shark sourced material, and pricing normalization can change growth paths, and expert input helped calibrate realistic ranges. Where bottom up coverage was incomplete for smaller suppliers, gaps were handled by using region level demand proxies and validated price bands, then re tested against trade and application mix checks.
Data Validation & Update Cycle
Validation was done by triangulating the modeled totals against independent signals, including trade direction, unit value movement, and observed changes in end use demand by purity grade. When variances appeared, assumptions were reviewed, outliers were challenged, and, when needed, respondents were re contacted to confirm whether the issue was mix, pricing, or timing.
Each dataset and assumption was reviewed in multiple steps before sign off, so the final numbers remained consistent across regions and segments. Reports are refreshed annually, and interim updates are made when a material event occurs, such as a new capacity announcement, a regulatory change affecting sourcing, or a sustained price swing. Before delivery, a final analyst pass is completed so clients receive the latest updated view aligned to the current market context.
Mordor Intelligence's Squalene Market Size Versus Other Published Estimates
Published market sizes for squalene often do not match because groups do not count the same item set, and they may also pick different base years, price points, and growth assumptions. Differences also show up when one estimate is built from ingredient demand signals while another is anchored on a broader chemicals basket.
Downstream finished products that contain squalene are outside Mordor Intelligence's scope, and that single exclusion can noticeably reduce the reported value versus studies that blend ingredient revenues with branded end products. The spread can also come from how purity grades are priced over time, whether biosynthetic supply is treated as a premium across the forecast, and how currency conversion timing is applied when unit values move quickly.
Benchmark comparison
| Source | Market Size | Gaps in Research Methodology |
|---|---|---|
| Mordor Intelligence | USD 182.14 M (2026) | |
| Global Consultancy A | USD 164.53 M (2024) | Uses an earlier base year with a different pricing environment, and its scope notes can blend end user demand assumptions without clearly separating cosmetic, food, and pharmaceutical purity grade pricing into distinct ASP tracks. |
| Industry Publisher B | USD 160.34 M (2024) | Reports a 2024 value and high growth path, but the published view does not clearly disclose how source type mix and grade level premiums are validated, which can inflate totals when biosynthetic or high purity pricing is applied broadly. |
Looking at the three figures together, most of the gap is explained by what is counted and which year is used for the starting point, before growth is even considered. Our method keeps the totals traceable to grade mix, source mix, and observable price ranges, which helps users reconcile differences without relying on hidden assumptions.


Key Questions Answered in the Report
How large is the squalene market?
The squalene market size reached USD 182.14 million in 2026 and is projected to hit USD 243.28 million by 2031, reflecting a 5.96% CAGR over 2026-2031.
Which source segment is expanding quickest?
Vegetable-source squalene is advancing at a 6.96% CAGR through 2031 as clean-beauty reformulations accelerate.
What drives pharmaceutical demand for squalene?
Vaccine adjuvants such as MF59 and emerging oncology nano-delivery platforms require high-purity GMP squalene that offers batch consistency and proven safety profiles.
Why is shark-liver squalene declining?
Conservation rules, mandatory ingredient disclosure, and the falling cost of biosynthetic and plant-derived alternatives are steadily eroding marine sourcing.
Page last updated on:


 Your data is secure and never sold or shared.


