Market Overview
| Study Period | 2018 - 2031 |
|---|---|
| Forecast Data Period | 2026 - 2031 |
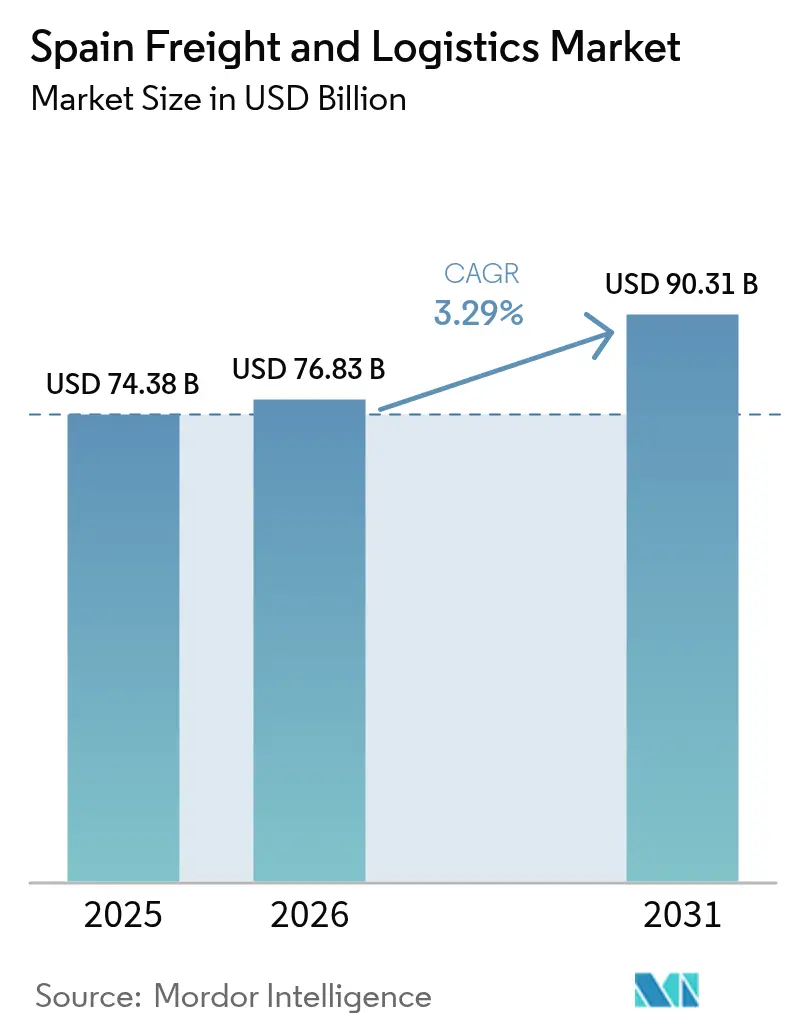
| Base Year Market Size (2025) | USD 74.38 Billion |
| Market Size (2026) | USD 76.83 Billion |
| Market Size (2031) | USD 90.31 Billion |
| Growth Rate (2026 - 2031) | 3.29% CAGR |
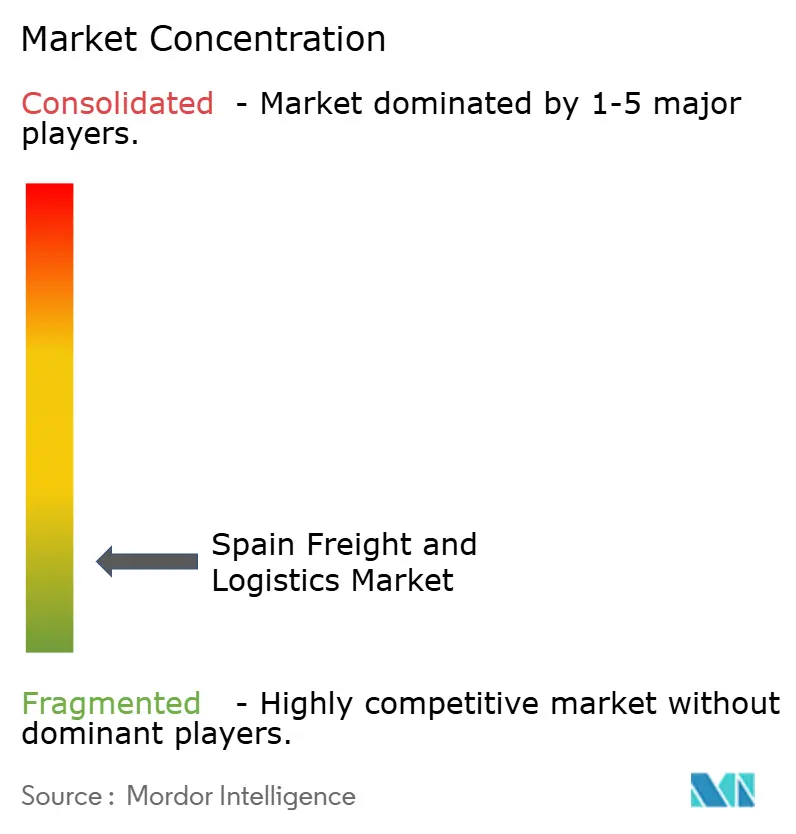
| Market Concentration | Low |
Major Players *Disclaimer: Major Players sorted in no particular order Image © Mordor Intelligence. Reuse requires attribution under CC BY 4.0. | |
Spain Freight And Logistics Market Analysis by Mordor Intelligence
The Spain freight and logistics market size was valued at USD 74.38 billion in 2025 and estimated to grow from USD 76.83 billion in 2026 to reach USD 90.31 billion by 2031, at a CAGR of 3.29% during the forecast period (2026-2031). Spain’s position as a Mediterranean gateway, coupled with Asia-Europe trade diversions toward western Mediterranean ports, lifts throughput at Valencia, Barcelona, and Algeciras. E-commerce proliferation enlarges parcel volumes and fuels automation investments, illustrated by DHL’s EUR 350 million (USD 386 million) Barcelona hub capable of sorting 30,000 packages per hour. Manufacturing recovery, led by automotive and pharmaceuticals, intensifies just-in-time (J-I-T) freight needs and underpins road transport’s 77.62% share. Public investments worth EUR 1.4 billion (USD 1.55 billion) in the Mediterranean Corridor and port LNG bunkering infrastructure are catalyzing rail uptake and greener vessel calls.
Key Report Takeaways
- By logistics function, freight transport led with 63.05% of the Spain freight and logistics market share in 2025, while courier, express, and parcel (CEP) is advancing at a 3.78% CAGR between 2026-2031.
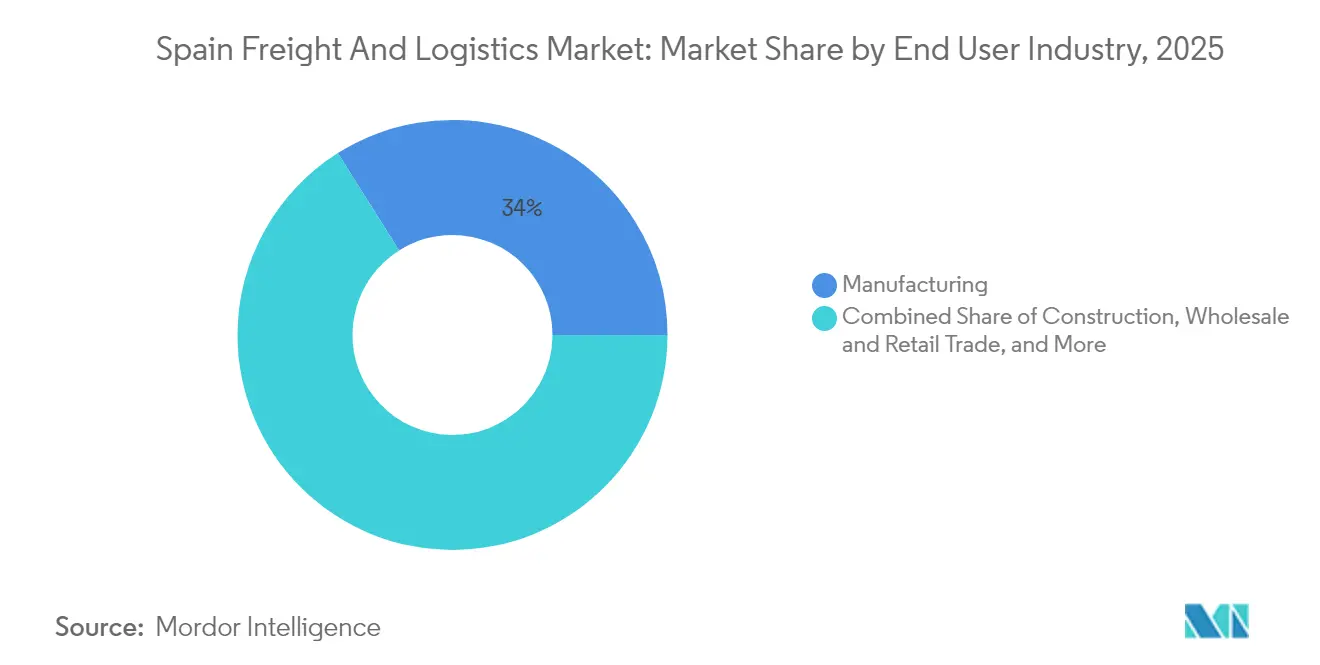
- By end user industry, manufacturing commanded 33.95% share of the Spain freight and logistics market size in 2025; wholesale and retail trade posts the fastest 3.49% CAGR between 2026-2031.
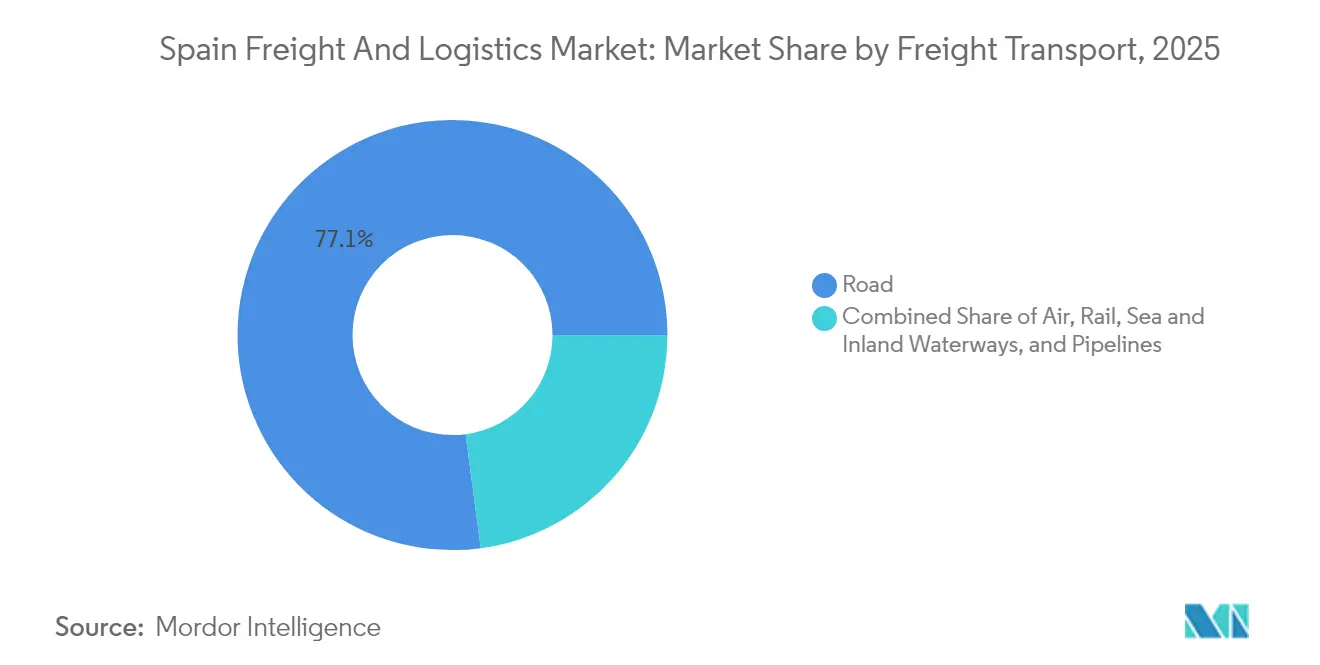
- By freight transport mode, road freight accounted for 77.10% share in 2025, whereas air freight is projected to expand at 3.69% CAGR between 2026-2031.
- By CEP service, domestic CEP flows captured a 63.40% of the revenue share in 2025, and international services are expected to register the highest 3.90% CAGR between 2026-2031.
- By warehousing and storage type, non-temperature controlled facilities represented 91.65% of the revenue share in 2025, while temperature-controlled space is expected to grow at a 3.15% CAGR between 2026-2031.
- By freight forwarding mode, sea and inland waterways freight forwarding held a 71.85% share in 2025; air freight forwarding is pacing ahead at a 3.31% CAGR between 2026-2031.
Note: Market size and forecast figures in this report are generated using Mordor Intelligence’s proprietary estimation framework, updated with the latest available data and insights as of 2026.
Spain Freight And Logistics Market Trends and Insights
Drivers Impact Analysis*
| Driver | (~) % Impact on CAGR Forecast | Geographic Relevance | Impact Timeline |
|---|---|---|---|
| E-commerce boom powering parcel and last-mile volumes | +0.8% | Madrid, Barcelona, Valencia metros | Short term (≤ 2 years) |
| Manufacturing resurgence driving J-I-T freight demand | +0.7% | Catalonia, Basque Country, Valencia | Medium term (2-4 years) |
| Public-sector spend on Mediterranean and Atlantic corridors | +0.6% | Barcelona-Algeciras; Bilbao-Seville | Long term (≥ 4 years) |
| Outsourced cold-chain uptake in Iberia | +0.5% | National hubs | Medium term (2-4 years) |
| LNG bunkering infrastructure in major ports | +0.4% | Valencia, Barcelona, Algeciras, Huelva | Long term (≥ 4 years) |
| Logistics real-estate yield compression spurring supply | +0.3% | Madrid, Barcelona, Valencia, Seville | Short term (≤ 2 years) |
| Source: Mordor Intelligence | |||


E-Commerce Boom Powering Parcel and Last-Mile Volumes
Domestic online spending continues to climb, pushing CEP shipments to record highs. DHL’s fully automated Barcelona hub scales processing capacity and trims cut-off times, enabling next-day coverage for 80% of the population. Correos has deployed more than 2,400 pickup points to facilitate click-and-collect, a model favored by omnichannel retailers[1]Communications Department, “Grupo CORREOS,” SEPI, sepi.es. Cross-border parcels flow through Madrid-Barajas air gateway, where alliances with Chinese operators accelerate Asian deliveries into Europe. Autonomous sidewalk robots and rural drone pilots indicate a pivot toward tech-enabled last-mile solutions that mitigate driver shortages. Collectively, these initiatives consolidate Spain’s reputation as a parcel logistics test bed for southern Europe.
Manufacturing Resurgence Driving J-I-T Freight Demand
Automotive plants in Catalonia and Navarra synchronize inbound components via time-definite trucking corridors, shrinking inventory buffers and lifting premium-service demand. Pharmaceutical producers dispatch temperature-sensitive APIs under Good Distribution Practice, reinforcing the need for real-time tracking. Select exporters switch long-haul legs to rail on the Mediterranean Corridor to reduce emissions and hedge against driver scarcity. Predictive analytics platforms help manufacturers balance throughput and cost, favoring logistics providers that offer integrated control-tower visibility. The interplay of lean production and sustainability pledges sustains multimodal freight innovation.
Public-Sector Spend on Mediterranean and Atlantic Corridors
Spain’s EUR 1.4 billion (USD 1.55 billion) investment extends double-track electrified rail from the French border to Algeciras, cutting transit times by up to 30% and lifting weekly container train capacity[2]Ministry of Transport Mobility and Urban Agenda, “Mediterranean Corridor,” Spanish Government, mitma.gob.es. Port-rail interfaces at Valencia Fuente de San Luis and Barcelona Can Tunis are being upgraded to 750-meter siding length, enabling heavy intermodal trains. On the Atlantic side, Bilbao and Vigo gain dedicated freight linkages, increasing competitiveness for U.S. and Latin American trades. These improvements align with EU TEN-T goals and encourage shippers to migrate volume from congested highways to lower-carbon rail services. Enhanced connectivity also stimulates warehouse development along inland dry ports, attracting multinational retailers.
Outsourced Cold-Chain Uptake in Iberia
Food exporters and vaccine manufacturers are divesting in-house storage in favor of specialized 3PLs. Global player Lineage’s planned public listing spotlights investor appetite for temperature-controlled assets. Americold’s multi-chamber facilities outside Madrid and Zaragoza provide −30°C deep-freeze and +2-8°C pharma zones, supported by GDP-compliant monitoring[3]Article, “Americold Sees Recent Partnerships as Key to Efficient Global Food Supply Chain,” REIT.com, reit.com. Supermarket consolidation drives demand for centralized cross-docks that combine frozen, chilled, and ambient flows under one roof. IoT sensors and blockchain audit trails strengthen traceability, helping exporters meet EU food safety standards. As a result, growth in cold-chain outsourcing outpaces ambient warehousing despite the latter’s volume dominance.
Restraints Impact Analysis*
| Restraint | (~) % Impact on CAGR Forecast | Geographic Relevance | Impact Timeline |
|---|---|---|---|
| Severe driver shortages and wage inflation | −0.5% | Madrid-Barcelona-Valencia triangle | Short term (≤ 2 years) |
| Fuel-price volatility | −0.4% | National; greater hit to long-haul routes | Short term (≤ 2 years) |
| Peak-season port bottlenecks for reefer cargo | −0.3% | Valencia, Barcelona, Algeciras | Short term (≤ 2 years) |
| Slow customs digitalisation for Canary flows | −0.2% | Canary Islands corridors | Medium term (2-4 years) |
| Source: Mordor Intelligence | |||
Severe Driver Shortages and Wage Inflation
Spain lacks roughly 25,000 licensed truck drivers, equal to 15% of capacity, as retirement outpaces new entrants[4]Staff Reporter, “Spain Missing Many Thousands of Truck Drivers,” IRU, iru.org. Average annual wages in Madrid and Catalonia rose 10% in 2025, squeezing margins for SME hauliers and lifting freight rates. Salvesen Logística operates 550 long-haul trailers daily and must continually recruit to maintain service, illustrating the cost burden of retention programs. Capacity shortfalls compel shippers to book farther in advance, and some switch to rail where feasible. Persistent shortages pose structural limits on road freight growth until training initiatives scale.
Fuel-Price Volatility
Diesel has oscillated between EUR 1.43-1.50 (USD 1.58-1.65) per liter in 2025, representing 28% of road operators’ cost base. Large fleets such as Grupo Sese hedge through multi-year renewable-diesel contracts with Repsol, but SMEs largely rely on weekly surcharges to pass along fluctuations. Volatility complicates fixed-price contract bids and may deter modal shift away from road if the price spreads with rail narrow. Electricity tariffs for battery-electric trucks remain high, delaying widespread adoption and prolonging dependency on fossil fuels.
*Our forecasts treat driver/restraint impacts as directional, not additive. The impact forecasts reflect baseline growth, mix effects, and variable interactions.
Segment Analysis
By End User Industry: Manufacturing Retains Lead, Retail Gains Momentum
Manufacturing accounted for 33.95% of the Spain freight and logistics market share in 2025, underpinned by strong automotive output, chemical processing, and high-value machinery exports. Automotive plants rely on synchronized inbound flows to minimize line-side inventory, stimulating growth in sequencing centers and shuttle trucks.
Wholesale and retail trade, slated for a 3.49% CAGR (2026-2031), capitalizes on omnichannel strategies that fuse store inventory with e-commerce fulfillment. Retailers demand real-time stock visibility and later order cut-offs, favoring integrators that combine urban hubs, micro-fulfillment, and last-mile networks. The dynamic encourages 3PLs to bundle warehousing, transport, and returns handling into unified contracts that deepen customer stickiness.


By Logistics Function: Freight Transport Commands Value, CEP Accelerates
Freight transport produced 63.05% of revenue in 2025, confirming its centrality to the Spain freight and logistics market. Demand stems from the country’s role as an entry point for Euro-Mediterranean trade and a distribution base for automotive, pharma, and FMCG flows. Bulk road movements from factory gates to ports dominate volumes, while rail intermodal units rise on infrastructure upgrades and green mandates.
CEP, expanding at a projected 3.78% CAGR (2026-2031), benefits from online retail that demands speed, small-parcel density, and precise tracking. Investment in sortation automation, route-planning AI, and alternative delivery stations differentiates CEP leaders from traditional general-cargo hauliers. The widening service gap reinforces the freight-to-parcel value migration likely to shape the Spain freight and logistics market through 2031.
By Courier, Express, and Parcel: Domestic Still Rules, International Surges
Domestic CEP retained a 63.40% share in 2025, leveraging dense urban delivery networks and next-day coverage across mainland Spain. SEUR, Correos, and DHL deploy dynamic route optimization to curb mileage and comply with low-emission zones.
International CEP, forecast at 3.90% CAGR (2026-2031), rides on cross-border e-commerce into France, Italy, and Germany, along with inbound Asian parcels. Customs pre-clearance APIs accelerate transit-time promises, enhancing Spain’s competitiveness as a fulfillment hub. Network operators enhance capacity on Madrid-Barajas and Barcelona routes to meet outbound demand tied to marketplace sellers.
By Warehousing and Storage: Ambient Space Prevails, Cold Chain Climbs
Non-temperature controlled warehousing formed 91.65% of capacity in 2025, supporting varied SKU profiles from apparel to household durables. Developers concentrate new builds near Madrid and Catalonia, where take-up eclipses historical averages. The temperature controlled segment, advancing 3.15% CAGR (2026-2031), draws capital for multi-temperature mega-sites integrated with cross-dock lanes.
IoT tech assures constant monitoring, critical for vaccines requiring +2-8°C corridors. Consolidation among chilled 3PLs promotes nationwide service footprints, enabling retailers to centralize procurement and reduce shrinkage.
By Freight Transport Mode: Road Dominates, Air Rises
Road freight maintained a 77.10% share in 2025 due to Spain’s 17,000 km of motorways that facilitate end-to-end delivery without modal swaps. Just-in-time manufacturing cycles, store replenishment, and agricultural exports all lean on truck agility. Nevertheless, prolonged driver shortages and decarbonization pressures open room for rail and short-sea alternatives on core corridors.
Air freight, projected to climb 3.69% CAGR (2026-2031), handles urgent e-commerce parcels, temperature-controlled pharmaceuticals, and electronics spares. Madrid-Barajas’ 930,000 metric-ton capacity and ongoing cargo city expansion attract integrator flight frequencies, solidifying its hub status for Latin American connections. Modal mix will continue reflecting the trade-off between speed and cost as shippers fine-tune service levels.
By Freight Forwarding Mode: Sea Leads, Air Gathers Pace
Sea and inland waterways freight forwarding captured a 71.85% share in 2025 as Valencia, Algeciras, and Barcelona handled 18.9 million TEU combined. Ocean freight offers the lowest unit cost for Spain’s citrus, olive oil, and tile exports, although port congestion heightens call scheduling risks.
Air freight forwarding, growing 3.31% CAGR (2026-2031), gains from high-value spare parts and pharma shipments. Forwarders promote sea-air combinations via Dubai and Tangier to balance cost with time, underscoring flexible solution design favored by shippers.
Geography Analysis
Demand clusters tightly in the Madrid-Barcelona-Valencia triangle, where 45% of the national GDP and most e-commerce fulfillment facilities reside. Barcelona port processed 3.6 million TEU in 2024 and hosts DHL’s ongoing hub build, solidifying Catalonia’s status as an international gateway. Valencia remains Spain’s top container port by throughput, buoyed by transshipment ties with West Africa and the Middle East. Madrid concentrates inland mega-warehouses along the A-2 and A-4 motorways, enabling same-day reach to 60% of the population.
Andalusia leverages Algeciras for intercontinental transshipment but suffers from vessel bunching tied to Suez detours, which inflates yard dwell times. The Basque Country, with Bilbao port, retains heavy-industry freight including automotive stamping and steel coil. Galicia’s Vigo port channels reefer seafood consignments to the EU, benefiting from EU green lanes that expedite perishables.
The Canary Islands persist as a special regime territory requiring feeder operations from Cadiz and Huelva. Paper-based customs slows cargo flow, resulting in higher logistics costs for island retailers. Government digitalization efforts target full electronic clearance by 2027, yet interim delays remain a competitiveness drag.
Competitive Landscape
Spain’s logistics industry is fragmented. However, global integrators expand via acquisitions: DSV’s EUR 14.3 billion (USD 15.8 billion) purchase of DB Schenker in 2024 enlarged road and contract logistics coverage nationwide. DHL maintains CEP leadership by pairing automated hubs with carbon-neutral delivery pilots using electric vans and cargo bikes. Domestic champions such as Grupo Sesé leverage renewable-diesel deals to hedge costs and appeal to carbon-conscious shippers.
Technology adoption is central to competitive positioning. GXO deploys goods-to-person robotics for sports equipment retailer Forum Sport, raising order-picking productivity by 40%. Start-ups offer digital freight matching, yet scale barriers—particularly fleet and warehousing networks—limit rapid displacement of incumbents. Cold-chain specialists Americold and Lineage pursue multi-site roll-ups, creating national temperature-controlled networks that smaller peers struggle to match.
The regulatory environment favors compliant operators able to meet ADR, GDP, and ISO certifications. Sustainability regulations spur fleet electrification trials, but high vehicle costs slow implementation beyond niche urban routes. Overall, the competitive field balances consolidation at the top with vibrant niche entrants, fostering service innovation while keeping price competition in check.
Spain Freight And Logistics Industry Leaders
DHL Group
DSV A/S (Including DB Schenker)
Kuehne + Nagel
Geopost (DPD Group / SEUR)
United Parcel Service of America, Inc. (UPS)
- *Disclaimer: Major Players sorted in no particular order

Recent Industry Developments
- April 2025: DSV completed its EUR 14.3 billion (USD 15.8 billion) acquisition of DB Schenker, creating one of Europe’s largest integrated logistics networks across road, air and sea freight.
- December 2024: DHL eCommerce partnered with CTT Expresso to create a strong parcel network across Iberia. The partnership aims to make parcel logistics more efficient for both B2C and B2B customers in Spain and Portugal.
- June 2024: Americold formed strategic alliances with global food suppliers to accelerate temperature-controlled supply chains into Spain.
- April 2024: Grupo Sese signed Spain’s largest renewable fuel supply agreement with Repsol, securing multi-year price stability for its truck fleet.


Spain Freight And Logistics Market Report Scope
Agriculture, Fishing, and Forestry, Construction, Manufacturing, Oil and Gas, Mining and Quarrying, Wholesale and Retail Trade, Others are covered as segments by End User Industry. Courier, Express, and Parcel (CEP), Freight Forwarding, Freight Transport, Warehousing and Storage are covered as segments by Logistics Function.End User Industry
| Agriculture, Fishing, and Forestry |
| Construction |
| Manufacturing |
| Oil and Gas, Mining and Quarrying |
| Wholesale and Retail Trade |
| Others |
Logistics Function
| Courier, Express, and Parcel (CEP) | By Destination Type | Domestic |
| International | ||
| Freight Forwarding | By Mode of Transport | Air |
| Sea and Inland Waterways | ||
| Others | ||
| Freight Transport | By Mode of Transport | Air |
| Pipelines | ||
| Rail | ||
| Road | ||
| Sea and Inland Waterways | ||
| Warehousing and Storage | By Temperature Control | Non-Temperature Controlled |
| Temperature Controlled | ||
| Other Services | ||
| End User Industry | Agriculture, Fishing, and Forestry | ||
| Construction | |||
| Manufacturing | |||
| Oil and Gas, Mining and Quarrying | |||
| Wholesale and Retail Trade | |||
| Others | |||
| Logistics Function | Courier, Express, and Parcel (CEP) | By Destination Type | Domestic |
| International | |||
| Freight Forwarding | By Mode of Transport | Air | |
| Sea and Inland Waterways | |||
| Others | |||
| Freight Transport | By Mode of Transport | Air | |
| Pipelines | |||
| Rail | |||
| Road | |||
| Sea and Inland Waterways | |||
| Warehousing and Storage | By Temperature Control | Non-Temperature Controlled | |
| Temperature Controlled | |||
| Other Services | |||


Market Definition
- Agriculture, Fishing, and Forestry (AFF) - This end user industry segment captures the external (outsourced) logistics expenditure incurred by the AFF industry players. The end user players considered are the establishments primarily engaged in growing crops, raising animals, harvesting timber, harvesting fish & other animals from their natural habitats and providing related support activities. Herein, Logistics Service Providers (LSPs) play a crucial role in acquisition, storage, handling, transportation, and distribution activities for the optimal & continuous flow of inputs (seeds, pesticides, fertilizers, equipment, and water) from manufacturers or suppliers to the producers and smooth flow of output (produce, agro-goods) to distributors/ consumers. This includes both termperature controlled and non-temperature controlled logistics, as and when required according to the shelf life of goods being transported or stored.
- Construction - This end user industry segment captures the external (outsourced) logistics expenditure incurred by the construction industry players. The end user players considered are the establishments primarily engaged in constructing, repairing and renovating residential & commercial buildings, infrastructure, engineering works, subdividing and developing land. Logistics Service Providers (LSPs) play a crucial role in increasing profitability of construction projects by maintaing the inventory of raw materials & equipment, time-critical supplies and by providing other value added services for effective project management.
- Courier, Express, and Parcel - The Courier, Express, and Parcel services, often called as CEP Market, refers to the logistics and postal service providers which specialize in moving small goods (parcels/packages). It captures the overall market size (USD) and market volume (number of parcels) of (1) the shipments/parcels/packages which are under 70kgs/ 154lbs weight, (2) Business Customer packages viz. Business-to-Business (B2B) & Business-to-Consumer (B2C) as well as private customer packages (C2C), (3) non-express parcel delivery services (Standard and Deferred) as well as express parcel delivery services (Day-Definite-Express and Time-Definite-Express), (4) domestic as well as international parcels.
- Demographics - To analyse total addressable market demand, population growth & forecasts have been studied and presented in this industry trend. It represents population distribution across categories like gender (male/female), development area (urban/rural), major cities among other key parameters like population density and final consumption expenditure (growth and share % of GDP). This data has been used for assessing the fluctations in demand & consumption expenditure, and the major hotspots (cities) of potential demand.
- Export Trends and Import Trends - Overall logistics performance of an economy is positively and significantly (statistically) correlated to its trade performance (exports and imports). Hence, in this industry trend, total value of trade, major commodities/ commodity groups and the major trade partners, for the studied geography (country or region as per the scope of report) have been analysed alongside the impact of major trade/logistics infrastructure investments & regulatory environment.
- Freight Forwarding - Freight forwarding which herein refers to the freight transportation arrangement (FTA) industry includes establishments primarily engaged in arranging & tracking transportation of freight between shippers and carriers. Logistics Service Providers (LSPs) considered are freight forwarders, NVOCCs, custom brokers and marine shipping agents. Others segment under Freight Forwarding captures the revenue earned through value added services of FTA like custom brokerage/clearance activities, preparation of freight related documentation, consolidation-deconsolidation of goods, cargo insurance & compliance, arrangement of warehousing & storage, liasing with shippers, and freight forwarding through other modes of transport viz. road and rail.
- Freight Pricing Trends - Freight pricing by mode of transport (USD/tonkm), over the review period, has been presented in this industry trend. The data has been used in assessing the inflationary environment, impact on trade, freight turnover (tonkm), freight and logistics market demand by mode of transport segments and hence the overall freight and logistics market size.
- Freight Tonnage Trends - Freight tonnage (weight of goods in tons) handled by mode of transport, over the review period, has been presented in this industry trend. The data has been used as one of the parameters apart from average distance per shipment (km), freight volume (tonkm), and freight pricing (USD/tonkm) to assess the freight transport market size.
- Freight Transport - Freight Transport refers to the hiring of a logistics service provider (outsourced logistics) for the transport of commodities (raw materials/final/intermediate/finished goods including both solids and fluids) from the origin to a destination within the country (domestic) or cross-border (international).
- Freight and Logistics - External expenditure on (or outsourced) facilitation of freight transport (freight transportation), arrangement of freight transport through an agent (freight forwarding), warehousing and storage (temperature controlled or non-temperature controlled), CEP (domestic or international courier, express and parcel) and other value-added logistics services involved in the transportation of commodities (raw materials or finished goods including both solids and fluids) from the origin to a destination within the country (domestic) or cross-border (international), through one or more modes of transportation viz. road, rail, sea, air and pipelines constitute freight and logistics market.
- Fuel Price - Fuel price spikes can cause delays and diruption for logistics service providers (LSPs), while drops in the same can result in higher short-term profitability and increased market rivalry to offer consumers with the best deals. Hence, the fuel price variations have been studied over the review period and presented along with the causes as well as market impacts.
- GDP Distribution by Economic Activity - Nominal Gross Domestic Product and distribution of the same, across major economic sectors in the geography studied (country or region as per scope of the report) have been studied and presented in this industry trend. As GDP is positively related to the profitability and growth of logistics industry, this data has been used in adjunction to the input-output tables/ supply-use tables for analyzing the potential major contributing sectors towards the logistics demand.
- GDP Growth by Economic Activity - Growth of Nominal Gross Domestic Product across major economic sectors, for the geography studied (country or region as per scope of the report) have been presented in this industry trend. This data has been utilized for assessing the growth of logistics demand from all the market end users (economic sectors considered here).
- Inflation - Variations in both Wholesale Price Inflation (YoY change in producer price index) and Consumer Price Inflation have been presented in this industry trend. This data has been used to assess the inflationary environment as it plays a vital role in smooth functioning of the supply chain, directly impacting the logistics operational cost components e.g., pricing of tyres, driver wages & benefits, energy/fuel prices, maintenace costs, toll charges, warehousing rents, custom brokerage, forwarding rates, courier rates etc. hence impacting the overall freight and logistics market.
- Infrastructure - As infrastructure plays a vital role in an economy's logistics performance, variables like length of roads, distribution of road length by surface category (paved v/s unpaved), distribution of road length by road classification (expressways v/s highways v/s other roads), rail length, volume of containers handled by major ports and tonnage handled by major airports have been analysed and presented in this industry trend.
- Key Industry Trends - The report section named "Key Industry Trends" include all the key variables/parameters studied to better analyze the market size estimates and forecasts. All the trends have been presented in the form of data points (time series or latest available data points) along with analysis of the paramter in the form of concise market relevant commentary, for the geography studied (country or region as per the scope of report).
- Key Strategic Moves - The action taken by a company to differentiate from its competitor or used as a general strategy is referred to as a key strategic move (KSM). This includes (1) Agreements (2) Expansions (3) Financial Restructuring (4) Mergers and Acquisitions (5) Partnerships, and (6) Product Innovations. Key players (Logistics Service Providers, LSPs) in the market have been shortlisted, their KSM have been studied and presented in this section.
- Liner Shipping Bilateral Connectivity Index - It indicates a country pair's integration level into global liner shipping networks and plays a crucial role in determining bilateral trade, which in turn potentially contributes toward the prosperity of a country and its surrounding region. Hence the major economies connected to the country/ region as per scope of the report, have been analyzed and presented in "Liner Shipping Connectivity" industry trend.
- Liner Shipping Connectivity - This industry trend analyses the state of connectivity to the global shipping networks based on the status of maritime transport sector. It includes the analysis of liner shipping connectivity, bilateral shipping connectivity, and port liner shipping connectivity indices for the geography (country/ region as per scope of the report) over the review period.
- Liner Shipping Connectivity Index - It indicates how well countries are connected to global shipping networks based on the status of their maritime transport sector. It is based on five components of the maritime transport sector: (1) The number of shipping lines servicing a country, (2) The size of the largest vessel used on these services (in TEUs), (3) The number of services connecting a country to the other countries, (4) The total number of vessels deployed in a country, (5) The total capacity of those vessels (in TEUs).
- Logistics Performance - Logistics Performance and Logistics Costs are the backbone of trade, and influences trade costs, making countries compete globally. Logistics performance is influenced by market wide adopted supply chain management strategies, government services, investments & policies, fuel/ energy costs, inflationary environment etc. Hence, in this industry trend, the logistics performance of the geography studied (country/ region as per the scope of report) has been analysed and presented over the review period.
- Major Truck Suppliers - Market share of truck brands is influenced by factors like geographical preferences, portfolio of truck types, truck prices, local production, truck repair & maintenance service peneteration, customer support, technological innovations (like electric vehicles, digitalization, autonomous trucks), fuel efficiency, financing options, annual maintenance costs, availability of substitutes, marketing startegies etc. Hence, the distribution (share % for base year of the study) of truck sales volume for leading truck brands and commentary on current market scenario & market anticipation over the forecast period have been presented in this industry trend.
- Manufacturing - This end user industry segment captures the external (outsourced) logistics expenditure incurred by the Manufacturing industry players. The end user players considered are the establishments primarily engaged in the chemical, mechanical or physical transformation of materials or substances into new products. Logistics Service Providers (LSPs) play a crucial role in maintaining a smooth flow of raw materials across the supply chain, enabling timely delivery of finished goods to distributors or end customers and storing & supplying the raw materials to clients for just-in-time manufacturing.
- Maritime Fleet Load Carrying Capacity - Maritime fleet load carrying capacity depicts the development state of an economy's maritime infrastructure & trade. It is influenced by factors like volume of production, international trade, major end user industries, maritime connectivity, environmental regulations, investments in port infrastructure development, port container cargo handling capacity etc. This industry trend represents the maritime fleet load carrying capacity by type of ship viz. container ships, oil tankers, bulk carriers, general cargo, among other types alongwith the influencing factors for the geography studied (country/ region as per scope of the report), over the review period.
- Modal Share - Freight Modal Share is influenced by factors like modal productivity, government regulations, containerization, distance of shipment, temperature control requirements, type of goods, international trade, terrain, speed of delivery, shipment weight, bulk shipments, etc. Also, modal share by tonnage (tons) and modal share by freight turnover (ton-km) differ as per average distance of shipments, weight of major commodity groups transported in the economy and number of trips. This industry trend represents the distribution of freight transported by mode of transport (tons as well as ton-km), for the study base year.
- Oil and Gas, Mining and Quarrying - This end user industry segment captures the external (outsourced) logistics expenditure incurred by the extraction industry players. The end user players considered are the establishments that extract naturally occurring mineral solids, such as coal and ores; liquid minerals, such as crude petroleum; and gases, such as natural gas. Logistics Service Providers (LSPs) covers entire phases from upstream to downstream and plays a crucial role in the transportation of machinery, drilling equipments, extracted minerals, crude oil & natural gas and refined/ processed products from one place to another.
- Other End Users - Other end user segment captures the external (outsourced) logistics expenditure incurred by the financial services (BFSI), real estate, educational services, healthcare, and professional services (administrative, waste management, legal, architectural, engineering, design, consulting, scientific R&D). Logistics Service Providers (LSPs) plays a crucial role in the reliable movement of supplies and documents to/from these industries such as transporting any equipment or resources required, shipping confidential documents and files, movement of medical goods & supplies (surgical supplies and instruments, including gloves, masks, syringes, equipment) to name a few.
- Other Services - Other Services segment captures revenue earned through (1) Value added services (VAS) for freight transportation by road, rail, air and sea & inland waterways, (2) VAS for marine cargo transportation (operation of terminal facilities such as harbours and piers, operation of waterway locks, navigation, pilotage and berthing activities, lighterage, salvage activities, lighthouse activities, among other miscellaneous support activities), (3) VAS for land freight transportation (operation of terminal facilities such as railway stations, stations for the handling of goods, operation of railroad infrastructure, switching and shunting, towing and road side assistance, liquefaction of gas for transportation purposes, among other miscellaneous support activities), (4) VAS for air cargo transportation (operation of terminal facilities such as airway terminals, airport and air-traffic-control activities, ground service activities on airfields, runway maintenance, inspection/ ferrying/ maintenance/ testing of aircrafts, aircraft fuelling services, among other miscellaneous support activities), (5) VAS for warehousing and storage service (operation of grain silos, general merchandise warehouses, refrigerated warehouses, storage tanks etc., storage of goods in foreign trade zones, blast freezing, crating goods for shipping, packing and preparing goods for shipping, labelling and/or imprinting the package, kit assembling and packaging services, among other miscellaneous support activities), and (6) VAS for courier, express and parcel service (pickup, sorting).
- Port Calls and Performance - The performance of ports is key to an economy's freight movement, trade, global connectivity, successful growth strategies, investment attractiveness for production & distribution systems, and thus affects GDP, employment, per capita income and industrial growth. Hence, the port perfomance parameters like median time spent by vessels in the ports; average age, size, cargo carrying capacity, container carrying capacity, of vessels entering the ports, port calls, and container port throughput have been analysed and presented in this industry trend.
- Port Liner Shipping Connectivity Index - It reflects a port's position in the global liner shipping network, wherein a higher value of index is associated with better connectivity. Efficient and well-connected ports (1) contribute towards minimizing transport costs, linking supply chains and supporting international trade, (2) pave the way for economies of scale and development of expertise by permitting producers to better exploit possibilities in domestic as well as foreign markets. Hence the major ports of strategic importance, in the country/ region as per scope of the report, have been analyzed and presented in "Liner Shipping Connectivity" industry trend.
- Port Throughput - It reflects the amount of cargo or number of vessels a port handles annually. It can be related to (1) cargo tonnage, (2) container TEU, and (3) vessel calls. Port throughput in terms of total containers handled (TEU's), has been presented in the "Port Calls and Performance" industry trend.
- Producer Price Inflation - It indicates inflation from viewpoint of the producers viz. the average selling price received for their output over a period of time. Annual change (YoY) of producer price index is reported as wholesale price inflation in the "Inflation" industry trend. As WPI captures dynamic price movements in most comprehensive way, it is widely used by governments, banks, industry, business circles and is deemed important in formulation of trade, fiscal and other economic policies. The data has been used in adjunction to consumer price inflation for better understanding the inflationary environment.
- Segmental Revenue - Segmental Revenue has been triangulated or computed and presented for all the major players in the market. It refers to the freight and logistics market specific revenue earned by the company, over the base year of study, in the geography studied (country or region as per the scope of report). It is computed through the study and analysis of major parameters like financials, service portfolio, employee strength, fleet size, investments, number of countries present in, major economies of concern, etc. that have been reported by the company in its annual reports, webpage. For companies having scarce financial disclosures, paid databases like D&B Hoovers, Dow Jones Factiva have been resorted to and verified through industry/expert interactions.
- Transport and Storage Sector GDP - Value and growth of Transport and Storage Sector GDP has a direct relation to the freight and logistics market size. Hence, this variable has been studied and presented over the review period, in value terms (USD) and as share % of total GDP, in this industry trend. The data has been supported by concise and relevant commentary around the investments, developments, and current market scenario.
- Trends in E-Commerce Industry - Enhanced internet connectivity and boom in smartphone penetration, coupled with increasing disposable incomes, has led to a phenomenal growth in the e-commerce market globally. Online shoppers require fast and efficient delivery of their orders leading to an increase in the demand for logistics services especially e-commerce fulfilment services. Hence, the Gross Merchandise Value (GMV), historial and projected growth, breakup of major commodity groups in e-commerce industry for the studied geography (country or region as per scope of the report) have been analysed and presented in this industry trend.
- Trends in Manufacturing Industry - Manufacturing industry involves the transformation of raw materials into finished products, while logistics industry ensures the efficient flow of raw materials to the factory, and the transport of manufactured products to the distributors & consumers. Demand-Supply of both industries are highly cross-linked and critical for a seamless supply chain. Hence, the Gross Value Added (GVA), breakup of GVA into major manufacturing sectors, and growth of manufacturing industry over the review period have been analysed and presented, in this industry trend.
- Trucking Fleet Size By Type - Market share of truck types is influenced by factors like geographical preferences, major end user industries, truck prices, local production, truck repair & maintenance service peneteration, customer support, technological disruptions (like electric vehicles, digitalization, autonomous trucks) etc. Hence, the distribution (share % for base year of study) of truck parc volume by type of truck, market disruptors, truck manufacturing investments, truck specifications, truck use & import regulations, and market anticipation over the forecast period have been presented in this industry trend.
- Trucking Operational Costs - The prime reasons for measuring/ benchmarking logistics performance of any trucking company are to reduce operational costs and increase profitability. On the other hand, measuring operational costs helps to identify whether and where to make operational changes to control expenses and identify areas for improved performance. Hence, in this industry trend, trucking operational costs and the variables involved viz. driver wages & benefits, fuel prices, repairs & maintenance costs, tyre costs etc. have been studied over the base year of study, and presented for the geography studied (country or region as per the scope of report).
- Warehousing and Storage - Warehousing and storage segment captures revenue earned through the operation of general merchandise, refrigerated and other types of warehousing & storage facilities. These establishments take responsibility for storing the goods and keeping them secure in lieu of charges. Value added services (VAS) they may provide are considered to be a part of the "other services" segment. Here VAS refer to a range of services, related to the distribution of a customer's goods and can include labelling, breaking bulk, inventory control & management, light assembly, order entry & fulfillment, packaging, pick & pack, price marking & ticketing and transportation arrangement.
- Wholesale and Retail Trade - This end user industry segment captures the external (outsourced) logistics expenditure incurred by the wholesalers and retailers. The end user players considered are the establishments primarily engaged in wholesaling or retailing merchandise, generally without transformation, and rendering services incidental to the sale of merchandise. Logistics Service Providers (LSPs) plays a crucial role in the reliable movement of supplies to and finished products from production houses to the distributors and finally to the end customer covering activites like material sourcing, transportation, order fulfillment, warehousing & storage, demand forecasting, inventory management etc.
| Keyword | Definition |
|---|---|
| Axle Load | The axle load of a wheeled vehicle is the total weight bearing on the roadway for all wheels connected to a given axle. |
| Back Haul | Backhaul is the return movement of a transport vehicle from its original destination to its original point of departure. |
| Bill of Lading | A bill of lading is a legal document issued by a carrier to a shipper that details the type, quantity, and destination of the goods being carried. |
| Bunkering | Bunkering is the process of supplying fuel and/or gasoil to be used to power the propulsion system of a ship (such fuel is referred to as bunker). It includes the logistics of loading and distributing the fuel among available shipboard tanks. A person dealing in trade of bunker (fuel) is called a bunker trader. |
| Bunkering Service | Bunkering service is the supply of a requested quality and quantity of bunkers to a ship. |
| C-commerce | C-commerce (Collaborative commerce) describes electronically enabled business interactions among an enterprise’s internal personnel, business partners and customers throughout a trading community. The trading community could be an industry, industry segment, supply chain or supply chain segment. |
| Cabotage | Transport by a vehicle registered in a country performed on the national territory of another country. |
| Cartage Agent | A ground transportation service that provides pickup and delivery of freight in locations not served directly by an air or ocean carrier. |
| Contract logistics | Contract logistics refers to the outsourcing of resource management tasks by one company to a third-party company specializing in logistical matters, such as transportation, warehousing, and order fulfillment. |
| Courier | A business that is used to send messages, packages, etc. Courier service refers to the fast or quick, door to door pickup and delivery service for goods or documents. It can be local or international. A company that provides such delivery services is called a courier company. A courier company hires people to provide their services. Such a person hired by the courier service company is called a courier. |
| Cross docking | Cross docking is a practice in logistics management that includes unloading incoming delivery vehicles and loading the materials directly into outbound delivery vehicles, omitting traditional warehouse logistical practices and saving time and money. |
| Cross Trade | International transport between two different countries performed by a vehicle registered in a third country. A third country is a country other than the country of loading/embarkation and than the country of unloading/disembarkation. |
| Customs Clearance | The procedures involved in getting cargo released by Customs through designated formalities such as presenting import license/permit, payment of import duties and other required documentations by the nature of the cargo such as FCC or FDA approval. |
| Customs seal | Customs seal means a seal, stamp or any other preventive means affixed by customs officials to ensure the inviolability of goods, commercial means of transport or warehouses. |
| Dangerous Goods | Dangerous goods (or hazardous materials or HAZMAT) include flammable liquids/solids, gases, compressed, liquified, dissolved under pressure, corrosives, oxidising substances, explosive substances and articles, substances, which on contact with water, emit flammable gasses, organic peroxides, toxic substances, infectious substances, radioactive materials, miscellaneous dangerous goods and articles. |
| Direct Shipment | Direct shipment is a method of delivering goods from the supplier or the product owner to the customer directly. In most cases, the customer orders the goods from the product owner. This delivery scheme reduces transportation and storage costs, but requires additional planning and administration. |
| Drayage | A drayage is a form of trucking service that connects the different modes of shipping (intermodal), such as ocean freight or air freight. It’s a short-haul trip that transports goods from one place to another, usually before or after its long-haul shipping process. Drayage trucks move cargo to and from various destinations, such as container ships, storage lots, order fulfillment warehouses, and rail yards. Typically, drayage only transports goods in short distances and operates only in one metropolitan area. It also requires only one trucker in a single shift. |
| Dry Docking | Dry docking is a term used for repairs or when a ship is taken to the service yard. During dry docking, the whole ship is brought to a dry land so that the submerged portions of the hull can be cleaned or inspected. |
| Dry van | A dry van is a type of semi-trailer that's fully enclosed to protect shipments from outside elements. Designed to carry palletized, boxed or loose freight, dry vans aren't temperature-controlled (unlike refrigerated “reefer” units) and can't carry oversized shipments (unlike flatbed trailers). |
| Feedering | Transport service whereby loaded or empty containers in a regional are transferred to a “mother ship” for a long-haul ocean voyage. |
| Final Demand | Final demand includes all types of commodities (goods as well as services) consumed as final use and might include personal consumption, or consumption by government, by businesses as capital investment, and as exports. includes all types of commodities (goods as well as services) consumed as final use and might include personal consumption, or consumption by government, by businesses as capital investment, and as exports. |
| First mile Delivery | First mile delivery refers to the first stage of the transportation. This is when the parcel leaves the seller’s warehouse and is taken by the courier pick up agent to process it or take it to the warehouse. Once the package reaches the post office or the courier’s hub, it is then sorted and transported further until it reaches the customer’s doorstep. |
| Fiscal storage services | It means a facility, clearly separated from other premises, where the excise goods are produced, processed, held, received or dispatched under a duty suspension arrangement by an authorized depositor, in the course of his business, under conditions laid down by the customs authorities. |
| Flat Bed | It has a back body that is flatly shaped for easy loading and unloading of goods. The flatbed truck is mostly used to transport heavy, oversized, wide and indelicate goods. |
| Flatbed Truck | A flatbed truck is a type of truck with rigid design. It has a back body that is flatly shaped for easy loading and unloading of goods. The flatbed truck is mostly used to transport heavy, oversized, wide and indelicate goods such as machinery, building supplies or equipment. Due to the truck open body, the goods transported with it must not be vulnerable to rain. By functionality, the flatbed truck is comparable to a flatbed trailer. |
| Freight Transit Time | Transit time is how long it takes for a shipment to be delivered to its final destination after being picked up from a designated pick up point. |
| Halal Logistics | It refers to the process of managing the logistics operations such as fleet management, storage/warehousing, and materials handling according to the principles of Shariah law in ensuring the integrity of the halal products at the point of consumption. |
| Haulage | The commercial transport of goods. |
| Inbound Logistics | Inbound logistics is the way materials and other goods are brought into a company. This process includes the steps to order, receive, store, transport and manage incoming supplies. Inbound logistics focuses on the supply part of the supply-demand equation. |
| Intermediate Demand | Intermediate demand includes goods, services, and maintenance and repair construction sold to businesses, excluding capital investment. |
| International Loaded | Place of loading of goods in reporting country (i.e., country in which the vehicle performing the transport is registered) and place of unloading in a different country. |
| International Unloaded | Place of unloading of goods in reporting country (i.e., country in which the vehicle performing the transport is registered) and place of loading in a different country. |
| Last Mile Delivery | Last mile delivery refers to the very last step of the delivery process when a parcel is moved from a transportation hub to its final destination—which, usually, is a personal residence or retail store. |
| Less than-Truck-Load (LTL) | Less-than-truckload, also known as less-than-load (LTL), is a shipping service for relatively small loads or quantities of freight. An LTL provider combines the loads and shipping requirements of several different companies on their trucks, using a hub-and-spoke system to get goods to their destinations. |
| Locomotives Haluage | The transport of coal, ore, workers, and materials underground by means of locomotive-hauled mine cars. The locomotive may be powered by battery, diesel, compressed air, trolley, or some combination such as battery-trolley or trolley-cable reel. |
| Milkrun | A Milk Run is a delivery method used to transport mixed loads from various suppliers to one customer. Instead of each supplier sending a truck every week to meet the needs of one customer, one truck (or vehicle) visits the suppliers to pick up the loads for that customer. This method of transport got its name from the dairy industry practice, where one tanker used to collect milk from several dairy farms for delivery to a milk processing company. |
| Multi country consolidation | Multi-Country Consolidation (MCC) is a cost-effective solution that consolidates ones cargo from different countries of origin to build Full Container Loads (FCL). MCC is most suitable for companies that import light volumes of goods from multiple countries but want to take advantage of the more economic FCL freight rates. |
| Multi-Modal Logistics | Multimodal transportation or multimodal shipping refers to logistics and freight processes that require multiple modes of transportation. |
| Omni Channel Logistics | Omnichannel distribution is a multichannel approach taken by companies to give customers a way to purchase and receive orders from several sales channels with one-touch seamless integration. Some of the ways include- 1. Buy online, then pick-up at the brick and mortar store; 2. Buy online, then have it delivered to the home or another location; 3.In store purchase, with the delivery either to the home or another location; 4. Drop ship from a warehouse or manufacturing center to store, home or other location; 5.Buy online, then return at store or online; 6. Buy online, then return online. |
| OOG cargo | Out of Gauge (OOG) cargo is any cargo that can not be loaded into six-sided shipping containers simply because it is too large. The term is a very loose classification of all cargo with dimensions beyond the maximum 40HC container dimensions. That is a length beyond 12.05 meters – a width beyond 2.33 meters – or a height beyond 2.59 meters. |
| Other ships | Other ships include: Liquefied petroleum gas carriers, liquefied natural gas carriers, parcel (chemical) tankers, specialized tankers, reefers, offshore supply vessels, tugboats, dredgers, cruise, ferries, other non-cargo ships |
| Other Specialised Cargo | Other specialised goods include pre-slung goods (Goods, one or more items, supplied with a sling or slings), mobile units (Mobile Self Propelled Units, Non Self Propelled Units, unrolled vehicles), oversized equipment load (light and heavy machinery that is often too big or too heavy), high value freight that needs extra protection like electronics, financial services road freight. |
| Outsourced Freight Transport | Transport for hire or reward; The carriage for remuneration of goods. |
| Pallets | Raised platform, intended to facilitate the lifting and stacking of goods. |
| Part load | A part load describes goods which only fills a truck partially. In essence, the quantity of the shipment is bigger than the Less Than Truckload (LTL) shipment. Also, the shipment cannot fully occupy a truck i.e. its capacity is much lower than a Full Truckload (FTL) shipment. |
| Paved Road | Road surfaced with crushed stone (macadam) with hydrocarbon binder or bituminized agents, with concrete or with cobblestone. |
| Q-commerce | Q-commerce, also referred to as quick commerce, is a type of e-commerce where emphasis is on quick deliveries, typically in less than an hour. |
| Quay | A stone or metal platform lying alongside or projecting into water for loading and unloading ships. |
| Recommerce | Recommerce is the selling of previously owned items through online marketplaces to buyers who reuse, recycle or resell them. |
| ReverseLogistics | Reverse logistics is a type of supply chain management that moves goods from customers back to the sellers or manufacturers. |
| Road Freight Transport Service | Hiring a trucking agency for transport of commodities (raw materials or manufactured goods including both solids and liquids) form the origin to a destination within the country (domestic) or cross-border (international) constitutes road freight transport market. The service might be Full-Truck-Load or Less than-Truck-Load, containerized or non-containerized, temperature controlled or non temperature controlled, short haul or long haul. |
| Roll-on/roll-off cargo | Roll-on/roll-off (RORO or ro-ro) ships are cargo ships designed to carry wheeled cargo, such as cars, motorcycles, trucks, semi-trailer trucks, buses, trailers, and railroad cars, that are driven on and off the ship on their own wheels or using a platform vehicle, such as a self-propelled modular transporter. |
| Swap bodies | A swap body, swop body, exchangeable container or interchangeable unit, is one of the types of standard freight containers for road and rail transport. |
| Tank Barge | A non-self-propelled vessel constructed or adapted primarily to carry liquid, solid or gaseous commodities or cargos in bulk in cargo spaces (or tanks) through rivers and inland waterways, and may occasionally carry commodities or cargos through oceans and seas when in transit from one inland waterway to another. The commodities or cargos transported are in direct contact with the tank interior. |
| Tautliner vehicle | Tautliner and curtainsider are used as generic names for curtain sided trucks/trailers. The curtains are permanently fixed to a runner at the top and detachable rails/poles at front and rear, allowing the curtains to be drawn open and forklifts used all along the sides for easy and efficient loading and unloading. When closed for travel, vertical load restraint straps are attached to a rope rail beneath the truck bed, connecting the truck bed and curtain along both sides. Winches at either end of the curtain tension it, hence the 'Tautliner' name. This stops the curtain from flapping or drumming in the wind and can also help retain light loads from slipping sideways. |
| Transloading | Transloading is a shipping term that refers to the transfer of goods from one mode of transportation to another en route to their ultimate destination. |
| Tsubo | A Japanese unit of area equal to 35.58 square feet. |
| Unpaved Road | Road with a stabilized base not surfaced with crushed stone, hydrocarbon binder or bituminized agents, concrete or cobblestone. |
| Vessel Husbandry Services | It includes ship maintenance, repairs, cleaning, upkeep of the hull and rigging and equipment. |


Research Methodology
Mordor Intelligence follows a four-step methodology in all our reports.
- Step-1: Identify Key Variables: In order to build a robust forecasting methodology, the variables and factors identified in Step-1 are tested against available historical market numbers. Through an iterative process, the variables required for market forecast are set and the model is built on the basis of these variables.
- Step-2: Build a Market Model: Market-size estimations for the forecast years are in nominal terms. Inflation is not a part of the pricing, and the average selling price (ASP) is kept constant throughout the forecast period for each country.
- Step-3: Validate and Finalize: In this important step, all market numbers, variables and analyst calls are validated through an extensive network of primary research experts from the market studied. The respondents are selected across levels and functions to generate a holistic picture of the market studied.
- Step-4: Research Outputs: Syndicated Reports, Custom Consulting Assignments, Databases & Subscription Platforms


