Space Situational Awareness (SSA) Systems Market Size and Share
Market Overview
| Study Period | 2019 - 2031 |
|---|---|
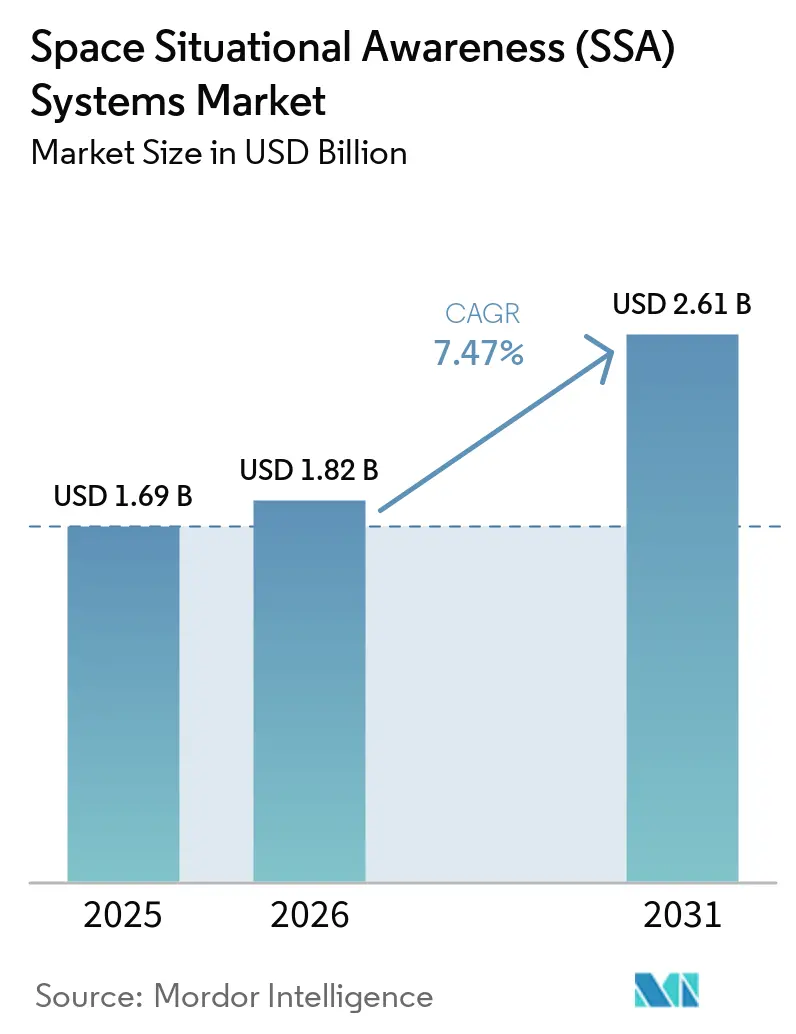
| Market Size (2026) | USD 1.82 Billion |
| Market Size (2031) | USD 2.61 Billion |
| Growth Rate (2026 - 2031) | 7.47% CAGR |
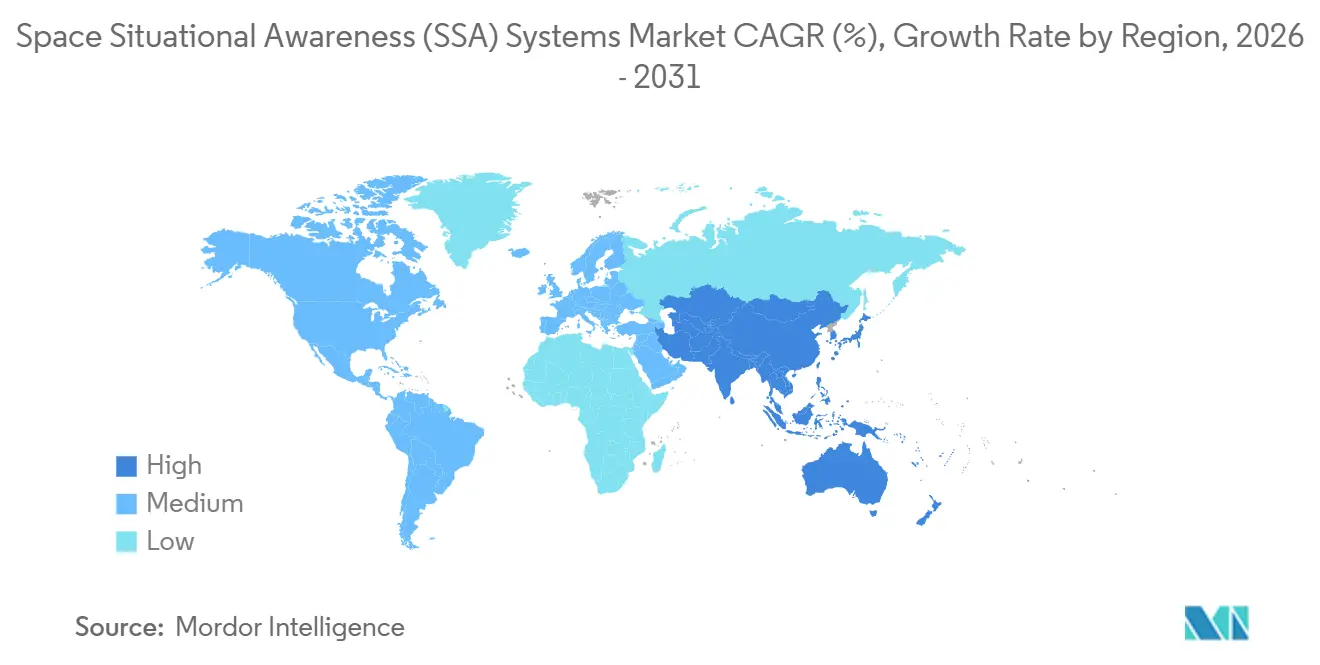
| Fastest Growing Market | Asia-Pacific |
| Largest Market | North America |
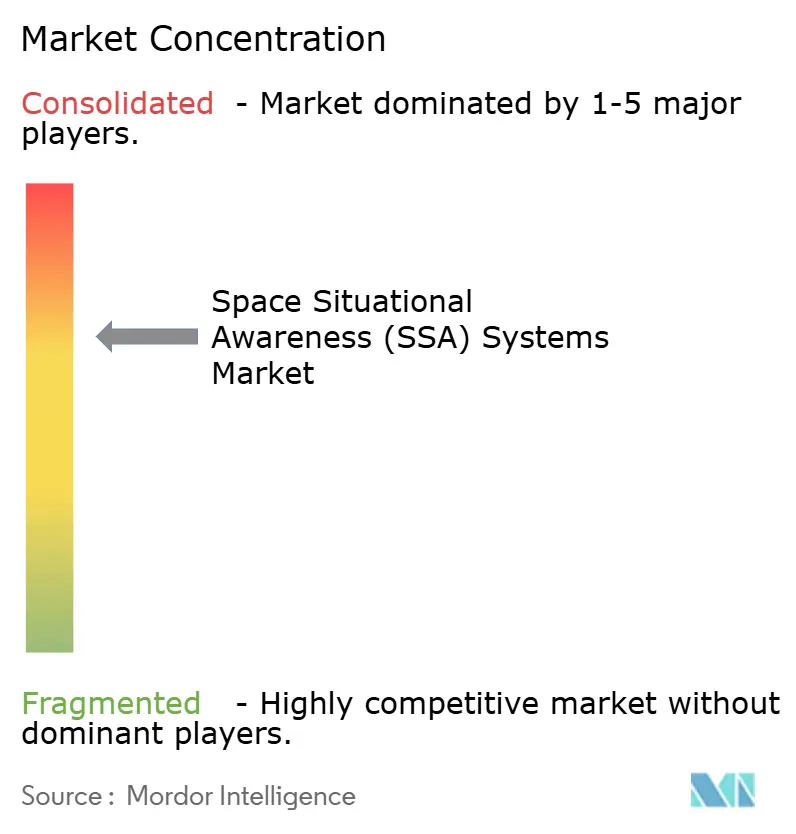
| Market Concentration | Medium |
Major Players *Disclaimer: Major Players sorted in no particular order Image © Mordor Intelligence. Reuse requires attribution under CC BY 4.0. | |
Space Situational Awareness (SSA) Systems Market Analysis by Mordor Intelligence
The space situational awareness systems market size is expected to grow from USD 1.69 billion in 2025 to USD 1.82 billion in 2026. It is forecasted to reach USD 2.61 billion by 2031 at a 7.47% CAGR over 2026-2031, reflecting a growing market size supported by sustained investments across civil and defense programs. Heightened geopolitical tensions and accelerating satellite deployments are pushing operators to upgrade ground sensors, expand space-based surveillance, and deploy AI-driven data fusion to improve custody and response times. Demand is shifting from reactive catalog maintenance to predictive orbit determination and automated decision support, driving product roadmaps toward modular, cloud-native software integrated with federated sensor networks. Government and military users remain the largest buyers of high-assurance solutions, while commercial operators are scaling up spending on collision-avoidance and compliance-ready services as constellations grow. Regional momentum is anchored in the US, with Europe and Asia complementing capability buildouts through sovereign programs, public-private partnerships, and multilateral data-sharing frameworks that improve the resilience of the space situational awareness systems market.
Key Report Takeaways
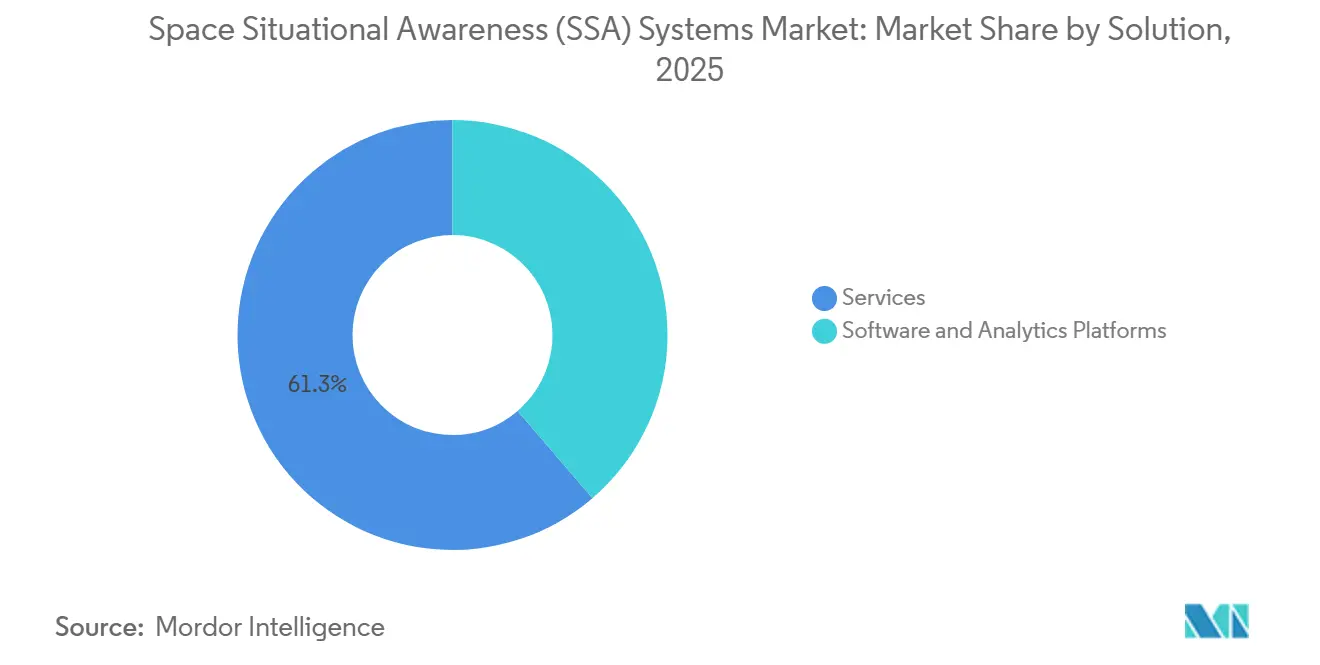
- By solution, services accounted for 61.28% of revenue in 2025, reflecting a preference for turnkey tracking, screening, and analyst support. Software and analytics platforms are projected to grow at an 8.88% CAGR through 2031, outpacing the overall market.
- By orbital range, near-Earth monitoring accounted for 72.68% of deployments in 2025, reflecting constellation density and debris risks below 2,000 kilometers. Deep-space surveillance is projected to expand at an 8.11% CAGR through 2031, driven by cislunar exploration and infrastructure plans.
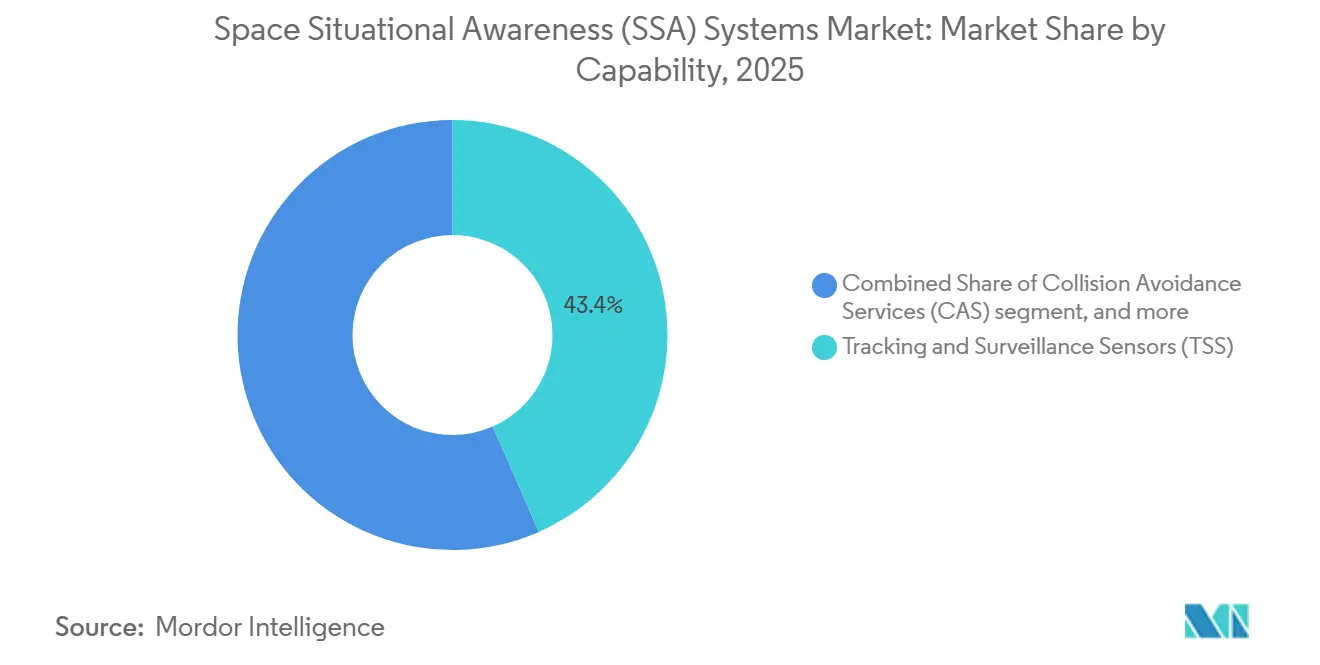
- By capability, tracking and surveillance sensors led with 43.42% share in 2025, underpinned by radar and optical network upgrades. Collision avoidance services are forecasted to be the fastest-growing capability, with a 9.39% CAGR through 2031.
- By end user, government and military operators accounted for 53.25% of revenues in 2025 as defense agencies funded resilient multi-orbit architectures. Commercial operators are projected to grow at 8.33% CAGR through 2031 as mega-constellation operators prioritize autonomy and regulatory compliance.
- By geography, North America accounted for 41.58% of revenue in 2025, supported by record US Space Force allocations for domain awareness and missile tracking. Asia-Pacific is projected to be the fastest-growing region at a 9.11% CAGR through 2031.
Note: Market size and forecast figures in this report are generated using Mordor Intelligence’s proprietary estimation framework, updated with the latest available data and insights as of January 2026.
Global Space Situational Awareness (SSA) Systems Market Trends and Insights
Drivers Impact Analysis*
| Driver | (~) % Impact on CAGR Forecast | Geographic Relevance | Impact Timeline |
|---|---|---|---|
| Strategic defense investments in space domain awareness capabilities | +1.8% | North America, Europe, Asia-Pacific core | Short term (≤ 2 years) |
| Collision avoidance imperatives from expanding commercial mega-constellations | +1.5% | Global, with concentration in LEO operators (US, EU) | Short term (≤ 2 years) |
| Rising frequency of deep-space and planetary missions | +1.2% | Global, with leadership from US, China, EU, India | Medium term (2-4 years) |
| Emerging role of AI and ML in predictive orbital analytics | +1.1% | Global, early adoption in North America, Europe | Medium term (2-4 years) |
| Growth in in-orbit servicing and active debris removal requirements | +0.9% | Global, pilot programs in EU, US, Japan | Long term (≥ 4 years) |
| Mandated compliance with global space traffic coordination frameworks | +0.8% | Global, implementation led by ITU, UNOOSA member states | Medium term (2-4 years) |
| Source: Mordor Intelligence | |||
Rising Frequency of Deep-Space and Planetary Missions
Cislunar operations and lunar surface logistics are moving off the drawing board and into active program execution, expanding surveillance perimeters and driving investments in tracking architectures that can maintain custody across Earth-Moon distances. NASA’s Artemis campaign, Lunar Gateway buildout, and sustained lunar science priorities keep deep-space requirements in focus for the remainder of the decade, prompting demand for autonomous orbit-determination and long-latency tasking that existing near-Earth systems do not fully address. European priorities outlined by the European Space Agency emphasize complementary European Space Domain Awareness measures that close visibility gaps for lunar orbits and higher regimes beyond.
As more lunar missions progress through integration and launch, operators seek higher-power-aperture sensors, multi-day correlation algorithms, and software that models perturbations beyond the classical two-body regime. These capabilities are priced at a premium due to the hardware complexity and compute demands. Yet, they provide a durable edge for agencies and firms that must safeguard rendezvous operations and high-value payloads in cislunar space. The space situational awareness systems market is therefore aligning R&D with deep-space custody challenges as lunar logistics and planetary probes mature into steady mission lines across leading national programs.
Strategic Defense Investments in Space Domain Awareness Capabilities
Defense budgets in 2026 maintain a strong focus on space domain awareness, missile warning, and resilient ground segments, supporting multi-year procurement of sensors, data fusion platforms, and commercial data services. The US Space Force's 2026 request of USD 39.9 billion, up USD 11.3 billion year over year, allocates significant resources to Ground and Space Domain Awareness, next-generation missile tracking, and cyber-hardened infrastructure. Procurement programs centered on proliferated tracking layers and infrared sensing exemplify the pivot to multi-orbit resilience and rapid refresh, with awards supporting industrial bases that supply sensors, buses, payloads, and autonomy software.
Allied modernization efforts complement this trajectory through sovereign sensors and debris mitigation initiatives that reduce reliance on single-nation networks and broaden access to federated SSA data. This investment climate favors vendors that can deliver classified-ready solutions, integrate with allied networks, and meet stringent availability metrics under firm fixed-price service models. The space situational awareness systems market is benefiting from this continuity of appropriations, which pulls through advanced telescopes, expeditionary radars, and low-latency algorithms from primes and growth-stage firms alike.
Collision Avoidance Imperatives from Expanding Commercial Mega-Constellations
The growth in active satellites and fragments increases collision risk, turning conjunction assessment, maneuver planning, and post-maneuver validation into daily operational workflows for fleet operators. Catalogs of tracked objects larger than 10 centimeters number in the tens of thousands and grow as new deployments and fragmentation events add items to the environment, underscoring the need for scalable screening and low-latency alerts. Operators are adopting automation for conjunction filtering, collision probability calculation, and maneuver generation to reduce human-in-the-loop decision time during time-critical encounters.
Civil agencies are also investing in traffic coordination platforms that distribute actionable alerts, which improve data access for smaller operators that do not own sensors or in-house flight dynamics teams. As program offices and private firms seek to harden space traffic practices, they are incorporating predictive analytics that infer behavior from sparse observations and flag anomalies for on-call analysts. The space situational awareness systems market is seeing strong pull for collision-avoidance services integrated with fleet-management consoles, creating a durable subscription base that grows with constellation scale.
Mandated Compliance with Global Space Traffic Coordination Frameworks
International and national authorities are moving from voluntary norms to binding requirements for space traffic coordination, making space safety a licensing prerequisite for many operators. The United Nations Committee on the Peaceful Uses of Outer Space documented progress on guidelines and called for stronger implementation through member-state processes, which support consistent practices in flight dynamics and reporting across jurisdictions. In the United States, the Office of Space Commerce is deploying the Traffic Coordination System for Space and migrating users, which embeds machine‑readable alerts and operator feedback into civil services that improve conjunction awareness. These measures drive the procurement of predictive analytics, automated documentation, and audit features that align with regulatory filings and cross‑border data exchange, favoring modular cloud software integrated with operator consoles. As compliance obligations scale across allied frameworks, buyer groups broaden beyond defense programs to include commercial constellation owners and emerging national agencies, which supports steady growth in the space situational awareness systems market.
Restraints Impact Analysis*
| Restraint | (~) % Impact on CAGR Forecast | Geographic Relevance | Impact Timeline |
|---|---|---|---|
| High capital expenditure required for ground-based sensor infrastructure | -1.4% | Global, particularly emerging markets | Long term (≥ 4 years) |
| Rising vulnerability of SSA networks to cybersecurity threats | -1.1% | Global, especially digitally advanced regions | Short term (≤ 2 years) |
| Atmospheric and weather-dependent limitations of optical tracking systems | -0.8% | Global, with seasonal variations by latitude | Medium term (2-4 years) |
| Talent shortages in orbital mechanics and space traffic analysis | -0.6% | North America and EU | Medium term (2-4 years) |
| Source: Mordor Intelligence | |||
High Capital Expenditure Required for Ground-Based Sensor Infrastructure
Next-generation radar and optical networks require multi-year capital programs and specialized sites, which strain public budgets and slow private deployments in regions without legacy infrastructure. NASA’s cost assessments show that large surveillance systems can demand hundreds of millions of dollars across construction and through-life sustainment, and that operations and maintenance quickly add to the total cost of ownership for multi-station concepts. Even when units are modular, logistics and site-readiness work drive timelines that complicate rapid expansion to meet rising conjunction volumes.[1]National Aeronautics and Space Administration, “Cost and Benefit Analysis of Mitigating, Tracking, and Remediating Orbital Debris,” NASA, nasa.gov Some agencies and integrators respond with federated architectures and consumption-based buying that shift costs from capital to operating budgets, but these still require secure networking and governance to maintain data integrity. While optical deployments can be less capital-intensive than deep-space radars, global distribution remains essential to offset weather, daylight, and latitude constraints, thereby increasing aggregate cost and coordination complexity. The space situational awareness systems market, therefore, sees strong interest in public-private partnerships and sensor-as-a-service to accelerate coverage without overextending individual budgets.
Rising Vulnerability of SSA Networks to Cybersecurity Threats
Space domain awareness platforms are increasingly targeted as adversaries attempt to disrupt tracking data flows, tamper with catalogs, or degrade confidence in predictive analytics. Sector information sharing flagged a higher rate of GNSS interference, jamming, and spoofing incidents coinciding with geopolitical events in 2025, prompting operators to reassess cyber defenses for mission and ground segments. Organizational readiness lags behind technology adoption, as many enterprises report that AI use outpaces security integration, which creates exposure across model pipelines, interfaces, and data-handling practices.
Satellite operators and service providers are applying zero-trust principles, network segmentation, and AI-assisted anomaly detection to reduce dwell times and isolate mission-critical functions from general IT stacks. Program offices are also raising cyber baselines for vendors supplying software or data, which elevates certification and compliance requirements for providers that integrate with defense systems. The Space Situational Awareness Systems market reflects this shift through increased security-by-design features in data fusion platforms and through audits that validate controls for handling sensitive space traffic information.
*Our forecasts treat driver/restraint impacts as directional, not additive. The impact forecasts reflect baseline growth, mix effects, and variable interactions.
Segment Analysis
By Solution: Service Contracts Dominate Yet Software Gains Momentum Through Automation
Service-based offerings captured a 61.28% share in 2025, as operators prioritized turnkey tracking, conjunction screening, and orbital analysis, supported by dedicated analysts and secure data links. Agencies continue to procure managed services that bundle sensor access, catalog maintenance, and response playbooks for operational scenarios, stabilizing budgets and improving continuity. At the same time, software and analytics platforms are projected to grow at 8.88% CAGR through 2031 as cloud-native architectures and API-driven fusion unlock automation at scale. Traffic coordination systems for space are moving from prototypes to operational services that distribute conjunction notifications and accept operator feedback, accelerating adoption among small and mid-size fleets. Service providers maintain an edge in missions that require continuous analyst oversight and classified connectivity. Software vendors win where fleets are large, and operations favor automation for screening and maneuver generation. Licensing models are diversifying, with on-premises deployments for classified enclaves and subscription-based SaaS for commercial fleets.


By Orbital Range: Near-Earth Surveillance Anchors Revenue While Cislunar Tracking Accelerates
Near-Earth monitoring accounted for 72.68% in 2025, as low-Earth orbit (LEO) and medium-Earth orbit (MEO) host the most active satellites and debris, driving higher conjunction volumes and stronger regulatory oversight. Deep-space surveillance is projected to grow at an 8.11% CAGR through 2031, with cislunar logistics, lunar surface missions, and extended exploration trajectories expanding the area of interest for national programs. Artemis priorities and Lunar Gateway planning sustain demand for architectures that can maintain custody at Earth-Moon distances under sparse observations and longer communication delays. European efforts to strengthen space safety include initiatives to address visibility gaps in lunar orbits and higher orbits to complement terrestrial networks. These shifts raise requirements for algorithmic robustness and sensor performance, favoring suppliers. The emerging role of AI and ML in predictive orbital analytics that integrate orbital mechanics models to account for perturbations and develop correlation windows for multi-day custody.
Near-Earth systems benefit from mature radar and optical stacks that detect objects across a wide field of view with rapid tasking and low latency. Large object counts and fragment populations increase demand for screening at scale and for standardized reporting formats that integrate with operator consoles. Deep-space architectures are evolving with higher sensitivity receivers and improved astrometric techniques to maintain custody over long arcs and during lunar occultations.
By Capability: Tracking Sensors Maintain Lead Yet Collision Services Surge on Mega-Constellation Pressure
Tracking and surveillance sensors accounted for 43.42% in 2025, with ground radars, optical telescopes, and space-based imagers generating the raw observations for catalog maintenance. Data fusion and predictive software refine state vectors and propagate uncertainties to deliver actionable conjunction alerts for operators. Collision avoidance services are projected to expand at 9.39% through 2031 as fleets grow and operators institutionalize automated decision support for frequent close approaches. Continuous improvement in radar transmit/receive modules and telescopes with advanced optics increases sensitivity to smaller debris, thereby improving environmental models for screening and mitigation. Upgrades at key telescopes, including international facilities supporting geostationary surveillance, underscore the emphasis on detecting smaller targets that could endanger high-value platforms.
Vendors differentiate collision avoidance by alert latency and decision support depth, ranging from basic probability and miss distance to maneuver windows with delta-v and pointing constraints. Integrations increasingly include automated documentation for regulators and insurers, reducing operational overhead and improving auditability. Partnerships with national programs and defense innovation channels help commercial providers extend sensor coverage and validate analytics under operational demands.
By End-User: Government Dominance Persists While Commercial Sector Scales Through Autonomous Solutions
Government and military operators held 53.25% in 2025 as defense ministries and civil agencies funded resilient architectures, data sovereignty, and sustained operations across multiple orbits. Commercial operators are projected to grow at 8.33% CAGR through 2031, reflecting the needs of mega-constellation owners to minimize downtime risks and maintain compliance with national and international norms. The US appropriations for space domain awareness and missile tracking in 2026 reinforce continuity of demand for sensors, ground infrastructure, and secure software services. Multi-vendor awards for proliferated infrared tracking underscore allied expectations for persistent coverage and rapid reconstitution, which benefits prime contractors and supply chain partners. At the same time, civil traffic coordination platforms continue to onboard users and shift workflows toward modern presentation layers and APIs for machine-to-machine data exchange.
Commercial traction is visible in licensing deals for commercial object catalogs that augment government sensors and feed unified data libraries. Providers are expanding expeditionary radar deployments and securing programmatic funding to scale coverage and accelerate post-launch custody for rideshare payloads. As regulators and insurers align incentives, commercial operators adopt advanced SSA services to document maneuvers, lower premiums, and meet evolving licensing conditions. The market continues to balance high-assurance government demand with fast-moving commercial requirements that reward automation and modular integration.
Geography Analysis
North America accounted for 41.58% in 2025, reflecting sustained investment in domain awareness, missile warning layers, and cyber-hardened ground segments that underpin regional leadership. The Space Development Agency made multi-award selections in December 2025 to build 72 tracking layer satellites, reinforcing the industrial base and deepening North American system integration across space and ground.[2]Space Development Agency, “Space Development Agency Makes Awards to Build 72 Tracking Layer Satellites for Tranche 3,” SDA, sda.mil Canada funded enhancements to SSA data processing to improve the identification of unknown objects in space-based optical observations, signaling regional coordination on catalog capacity. North American firms expanded their radar footprint and secured joint licensing arrangements for commercial object catalogs, integrating with civil traffic coordination services to enhance safety in LEO.
Europe advanced sovereign capabilities and debris-mitigation programs that help close coverage gaps and reduce reliance on non-European networks. ESA's leadership in active debris removal includes the world's first contracted debris removal service and follow-on initiatives for in-orbit services that progress toward operational missions.[3]European Space Agency, “ESA Purchases World-First Debris Removal Mission from Start-up,” ESA, esa.int National programs complement these efforts with upgraded telescopes and data fusion platforms that interface with the European SST framework, which improves shared situational awareness across member states. European providers secured awards for refurbishment and performance enhancements at critical telescopes, strengthening detection of small targets in high-value orbits.
Asia-Pacific is projected to register the fastest growth at 9.11% CAGR from 2026 through 2031, underpinned by expanding satellite fleets and national investments in indigenous tracking capabilities. Radar deployments and space-based sensing initiatives improve revisit rates and expand operators' custody within and beyond the region. Regional allies are collaborating on telescope upgrades and data sharing, while domestic firms align their offerings with national security and civil space priorities. Commercial providers are also scaling expeditionary radar systems, with deployments that enhance tracking across Pacific corridors and support operators' responses to higher launch activity.

Competitive Landscape
The space situational awareness systems market reflects a dual structure, with Tier-1 primes leading integrated defense programs and commercial providers expanding analytics and sensor access through subscription models. Lockheed Martin, L3Harris, and Northrop Grumman received awards in December 2025 to deliver tracking-layer satellites for a proliferated architecture supporting global missile warning and tracking. These programs create opportunities for sensor upgrades, data-fusion software, and operational support, influencing vendor roadmaps across the market. Growth-stage companies are winning deals by demonstrating catalog quality and integration with public traffic coordination systems. LeoLabs reported expanded government contracts and joint licensing of its commercial object catalog to civil and defense users. Slingshot Aerospace secured program awards to integrate AI agents into training ranges and deliver presentation layers for national traffic coordination services.
Strategic moves include portfolio expansions and productization of in-orbit services. Lockheed Martin progressed payloads that enhance the resilience of navigation and timing constellations. Astroscale advanced development for active debris removal and in-orbit servicing in Europe, while partnering to build deorbiting capabilities. Across the competitive field, differentiation is shifting toward AI accuracy, sensor-to-decision latency, and modular APIs.
Space Situational Awareness (SSA) Systems Industry Leaders
Lockheed Martin Corporation
Kratos Defense & Security Solutions, Inc.
Parsons Corporation
Peraton Corp.
L3Harris Technologies, Inc.
- *Disclaimer: Major Players sorted in no particular order

Recent Industry Developments
- February 2026: Slingshot Aerospace obtained Cybersecurity Maturity Model Certification Level 2, confirming its capability to safeguard Controlled Unclassified Information (CUI) for Department of Defense (DoD) missions. This certification enables the secure deployment of AI-powered tracking, modeling, and mission-planning solutions in DoD environments that require advanced CUI protection.
- August 2025: L3Harris Technologies, Inc. successfully upgraded the Ground-Based Electro-Optical Deep Space Surveillance telescopes at White Sands Missile Range, New Mexico, allowing the US Space Force to declare operational acceptance.
- June 2025: BAE Systems secured a USD 1.2 billion US Space Systems Command contract to build 10 missile-tracking satellites and develop ground systems for the US Space Force. These systems will enable the space-based tracking of ballistic missiles and hypersonic threats.


Research Methodology Framework and Report Scope
Market Definitions and Key Coverage
Our study defines the space situational awareness (SSA) systems market as the full suite of ground- and space-based sensors, analytics platforms, and subscription services that detect, track, characterize, and predict the behavior of objects orbiting Earth, covering near-Earth through cislunar space. We include recurring software licenses, data-as-a-service contracts, and government or commercial tracking networks that supply collision-avoidance, threat-warning, and orbital-health insights.
Scope Exclusion. We deliberately omit revenues from launch vehicles, generic earth-observation payloads, and any debris-removal hardware whose sole purpose is physical remediation rather than information provision.
Segmentation Overview
- By Solution
- Services
- Software and Analytics Platforms
- By Orbital Range
- Near-Earth
- Deep Space
- By Capability
- Tracking and Surveillance Sensors (TSS)
- Data Fusion and Predictive Software (DFPS)
- Collision Avoidance Services (CAS)
- By End-User
- Government and Military
- Commercial Operators
- By Geography
- North America
- United States
- Canada
- Mexico
- Europe
- United Kingdom
- France
- Germany
- Russia
- Rest of Europe
- Asia-Pacific
- China
- India
- Japan
- South Korea
- Rest of Asia-Pacific
- South America
- Brazil
- Rest of South America
- Middle East and Africa
- Middle East
- Saudi Arabia
- United Arab Emirates
- Rest of Middle East
- Africa
- South Africa
- Rest of Africa
- Middle East
- North America
Detailed Research Methodology and Data Validation
Primary Research
Mordor analysts speak with program managers in the U.S., Europe, and Asia, satellite-fleet operators, and software-as-a-service providers. Interviews clarify average selling prices for optical-tracking data bundles, realistic sensor uptime, and likely regulatory impacts, allowing us to refine utilization factors that secondary sources leave uncertain.
Desk Research
We begin with open data that anchors the physical environment: U.S. Space Surveillance Network catalogs, ESA DISCOS debris statistics, and launch logs kept by the United Nations Register of Objects. Trade associations such as the Satellite Industry Association, academic journals like Acta Astronautica, and filings to the U.S. FCC on constellation approvals give us granular launch cadence, mass class, and expected orbital lifetimes. To quantify spending, we read defense-budget justifications, NASA and ESA program plans, and investor presentations from listed sensor-network operators. Where deeper company financials are needed, we tap D&B Hoovers and Dow Jones Factiva. This list is illustrative; many additional public sources were consulted to close gaps and validate numeric ranges.
The second desk pass maps demand drivers. We review procurement forecasts posted on SAM.gov, patent filings from Questel that highlight emergent sensing modalities, and customs data from Volza that show radar-grade gallium nitride exports. These feeds help us size potential capacity additions and price curves before we cross-check totals with primary insights.
Market-Sizing & Forecasting
We begin with a top-down reconstruction built from tracked-object growth, average sensor coverage hours, and per-object monitoring spend. Results are then compared with sampled bottom-up roll-ups of major sensor operators' revenues and cloud-platform usage fees. Key variables in our model include annual LEO launch count, average satellite cross-sectional area, FCC five-year de-orbit compliance rates, defense space-domain awareness outlays, and commercial constellation insurance premiums. A multivariate regression projects these drivers to 2030, while scenario analysis adjusts for megaconstellation deployment delays. Gaps in sampled provider data are bridged using median service-price discovery from recent procurement tenders.
Data Validation & Update Cycle
Before release, a second analyst audits the workbook, variance flags trigger re-contact with at least one source, and totals are matched against new UN launch filings. The study is refreshed yearly, with mid-cycle amendments if a material sensor constellation or regulation is announced.
Why Mordor's Space Situational Awareness (SSA) Systems Baseline Commands Credibility
Published SSA values frequently diverge because firms pick different orbital ranges, object-size cut-offs, and price-loading assumptions.
Our disciplined scope and annual refresh narrow these gaps, and we favor observable launch and tracking metrics over broad defense-IT spending pools.
Benchmark comparison
| Market Size | Anonymized source | Primary gap driver |
|---|---|---|
| USD 1.69 B (2025) | Mordor Intelligence | - |
| USD 2.18 B (2025) | Global Consultancy A | Includes debris-removal hardware revenues and projects higher service inflation |
| USD 1.48 B (2024) | Industry Association B | Excludes software-only analytics platforms and uses static currency rates |
| USD 1.60 B (2023) | Regional Consultancy C | Stops at GEO, omitting emerging cislunar surveillance spend |
These comparisons show that when scope creep or narrow orbital focus skews totals, Mordor's balanced mix of object-centric tracking spend, validated ASPs, and up-to-date launch data provides decision-makers with a dependable, transparent baseline.


Key Questions Answered in the Report
What is the outlook for the Space Situational Awareness Systems market through 2031?
The space situational awareness systems market is projected to grow from USD 1.82 billion in 2026 to USD 2.61 billion by 2031 at a 7.47% CAGR, supported by defense modernization, rising constellation deployments, and adoption of AI-enabled analytics.
Which customer segment drives the most spending in Space Situational Awareness Systems?
Government and military users led with 53.25% in 2025 due to programs focused on resilient sensing architectures and sovereign control of data, while commercial operators are the fastest risers with an 8.33% growth trajectory.
What deployment domain shows the strongest growth in Space Situational Awareness Systems?
Deep-space surveillance is projected to expand at 8.11% CAGR through 2031 as cislunar logistics, lunar missions, and Gateway operations increase the need for custody beyond GEO.
Which capability area is scaling fastest within Space Situational Awareness Systems?
Collision avoidance services lead growth at 9.39% as operators automate conjunction screening and maneuver planning to manage frequent close approaches in congested orbits.
Which region holds the largest share in Space Situational Awareness Systems?
North America led with 41.58% in 2025, anchored by US investments in domain awareness, missile tracking layers, and secure ground infrastructure.
What technologies are most influential in Space Situational Awareness Systems today?
AI-driven fusion, modular cloud-native software, expeditionary radars, and upgraded optical telescopes that detect smaller targets are shaping product roadmaps and procurement priorities.
Page last updated on:


