Space Electronics Market Size and Share
Market Overview
| Study Period | 2020 - 2031 |
|---|---|
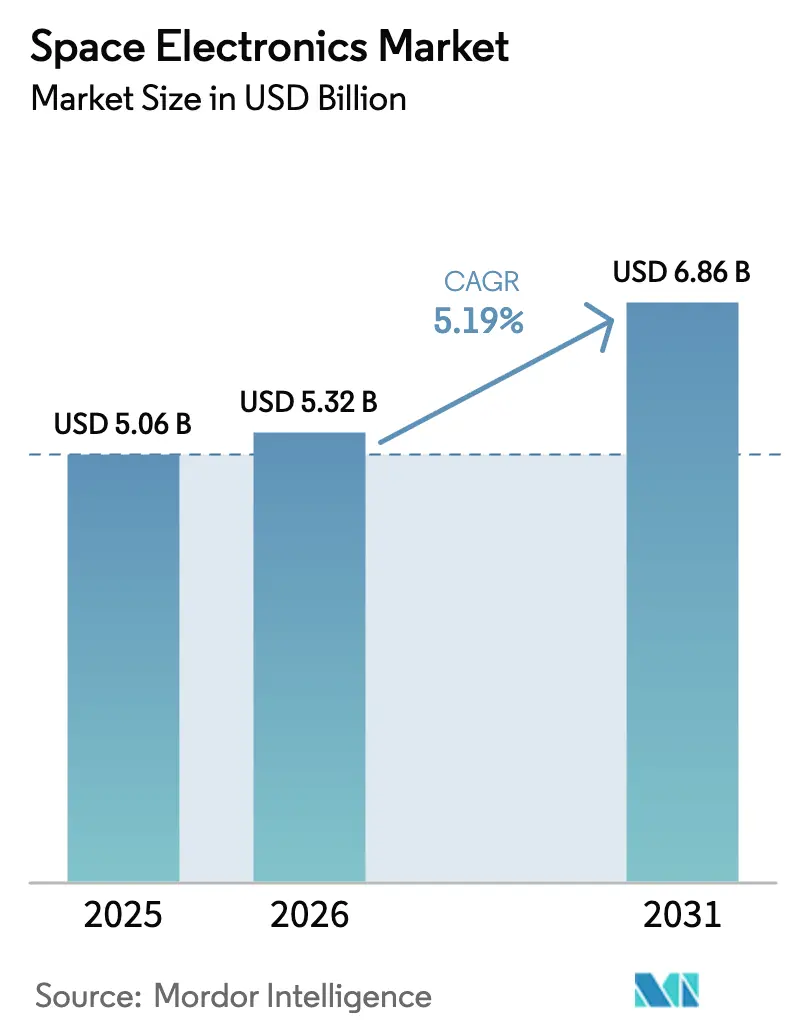
| Market Size (2026) | USD 5.32 Billion |
| Market Size (2031) | USD 6.86 Billion |
| Growth Rate (2026 - 2031) | 5.19% CAGR |
| Fastest Growing Market | Asia Pacific |
| Largest Market | North America |
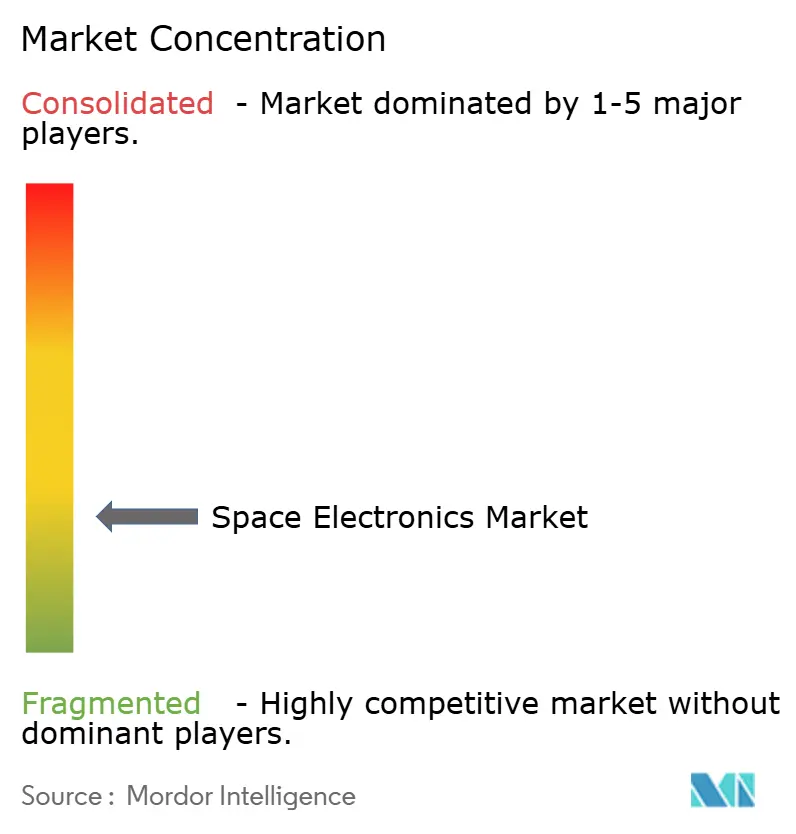
| Market Concentration | Low |
Major Players *Disclaimer: Major Players sorted in no particular order Image © Mordor Intelligence. Reuse requires attribution under CC BY 4.0. | |
Space Electronics Market Analysis by Mordor Intelligence
The space electronics market size is expected to grow from USD 5.06 billion in 2025 to USD 5.32 billion in 2026 and is forecast to reach USD 6.86 billion by 2031 at 5.19% CAGR over 2026-2031. The steady trajectory signals a transition from early-decade prototype launches to scalable production runs that embed autonomous computing, high-efficiency power devices, and radiation-tolerant designs into every mission class. Momentum coalesces around three themes: multi-orbit broadband constellations seeking thousands of satellites, deep-space exploration programs that need onboard decision-making far from Earth, and small-sat manufacturing lines that deliver commercial-grade pricing without sacrificing radiation resilience. Supply-chain tightness for radiation-hardened wafers remains a structural headwind, while export-control reforms modestly widen collaborative opportunities within trusted partner networks. Competitive strategies increasingly pair space-heritage firms with commercial semiconductor partners so that innovations in edge-AI, wide-bandgap power devices, and modular avionics flow quickly into flight hardware.
Key Report Takeaways
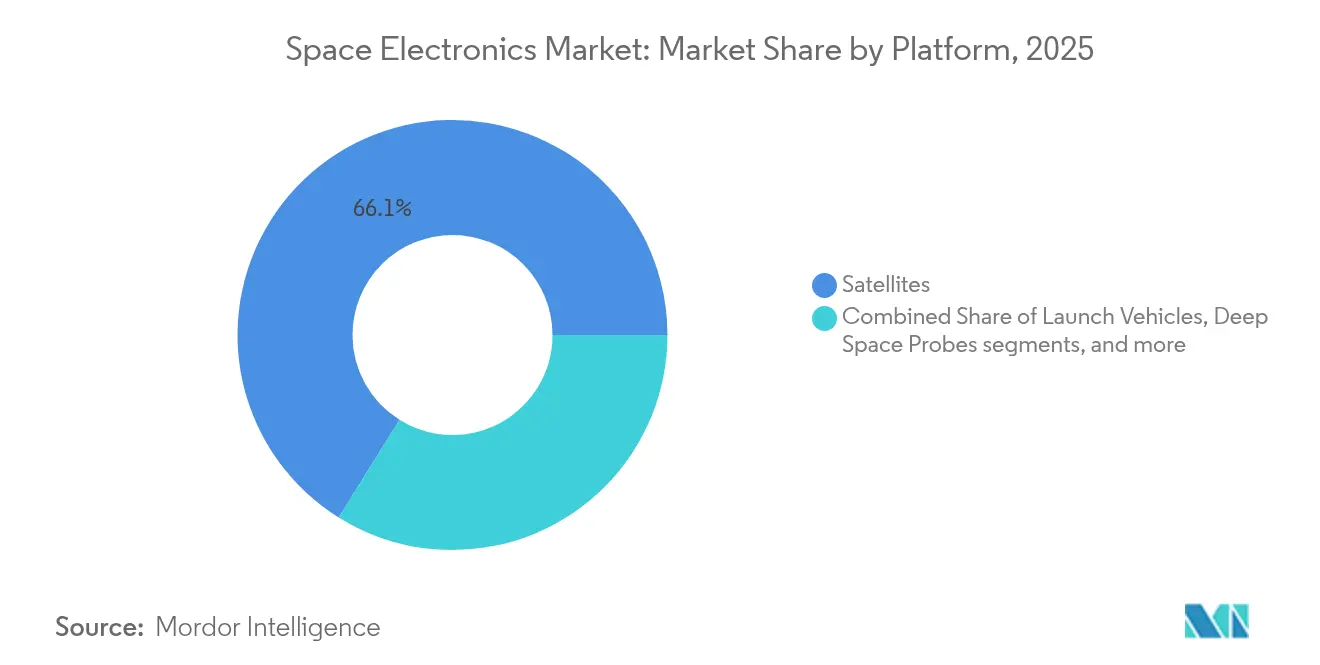
- By platform, satellites led the space electronics market with 66.12% of the share in 2025, whereas deep-space probes are projected to grow at a 8.74% CAGR through 2031.
- By application, communication systems commanded 44.62% revenue share in 2025; scientific and technology-demonstration missions hold the fastest outlook at an 7.88% CAGR.
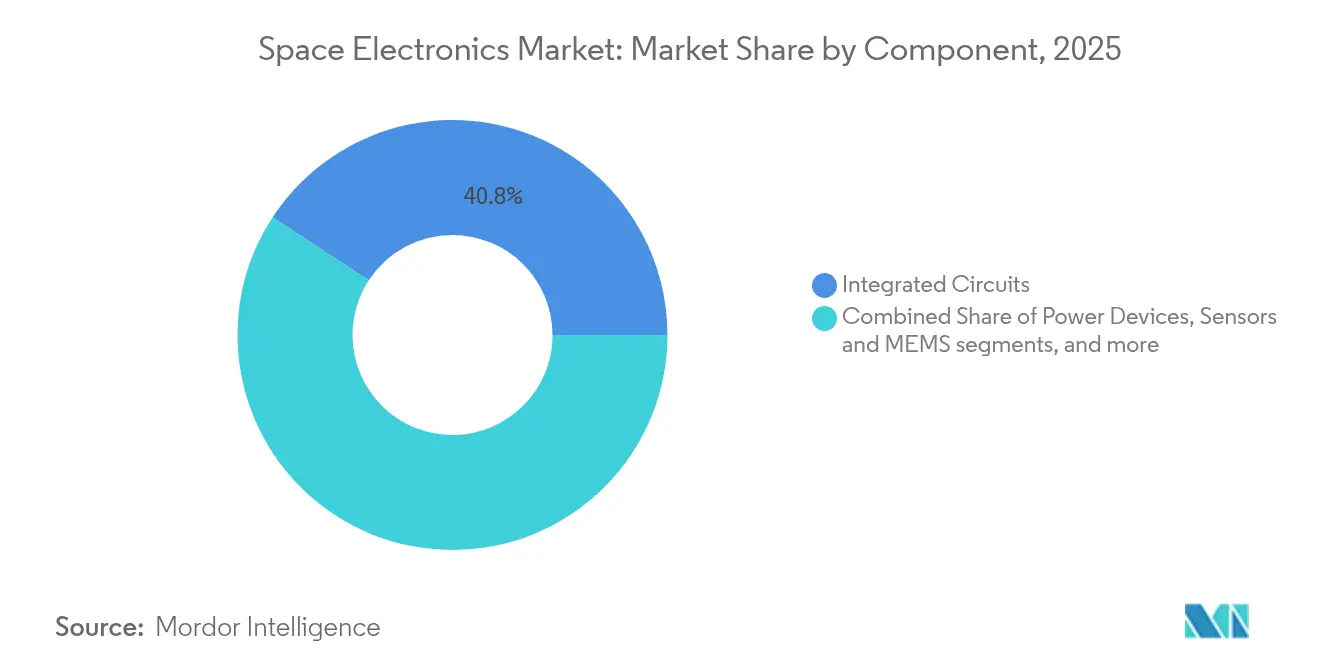
- By component, integrated circuits held a 40.78% share of the space electronics market in 2025, while power devices are set to advance at an 7.73% CAGR between 2026 and 2031.
- By type, radiation-hardened parts retained a 62.12% share in 2025; radiation-tolerant parts show the highest 8.95% CAGR through 2031.
- By end-user, commercial operators accounted for 54.63% of 2025 revenue, whereas military and defense demand is forecasted to rise at a 9.28% CAGR.
- By geography, North America captured 36.45% of 2025 revenue; Asia-Pacific is the fastest-growing region at a 9.07% CAGR through 2031.
Note: Market size and forecast figures in this report are generated using Mordor Intelligence’s proprietary estimation framework, updated with the latest available data and insights as of 2026.
Global Space Electronics Market Trends and Insights
Drivers Impact Analysis*
| Driver | (~) % Impact on CAGR Forecast | Geographic Relevance | Impact Timeline |
|---|---|---|---|
| Rapid deployment of large LEO constellations | +1.8% | Global focus in North America and Asia-Pacific | Medium term (2-4 years) |
| Expansion of deep-space exploration missions | +1.2% | North America and EU with emerging APAC support | Long term (≥ 4 years) |
| On-board edge-AI and high-bandwidth processing | +0.9% | Technology leaders in North America and EU | Medium term (2-4 years) |
| Miniaturization and mass production of smallsats | +0.7% | Global with APAC cost advantages | Short term (≤ 2 years) |
| Venture-capital funding of space-based IoT infrastructure | +0.6% | North America and EU primary, expanding to APAC | Medium term (2-4 years) |
| Defense-led demand for secure, space-qualified microprocessors | +0.5% | North America, EU, select APAC allies | Long term (≥ 4 years) |
| Source: Mordor Intelligence | |||
Rapid Deployment of Large LEO Satellite Constellations
Projected fleets exceeding 10,000 spacecraft turn each launch manifest into a bulk-electronics procurement event that scales volume demand several-fold. The average small-sat mass is rising toward 200 kg, allowing more processing, memory, and optical-link hardware while staying under aggressive launch-cost envelopes. Radiation-tolerant COTS devices now satisfy most LEO lifetimes, tilting budgets away from fully rad-hard solutions and drawing commercial semiconductor houses into the Space electronics market.
Increasing Deep-Space Exploration Missions
One-way light-time delays to Mars render ground control impractical, so spacecraft need processors that deliver 100x the performance of prior generations yet maintain 300 kilorad tolerance. NASA’s High-Performance Spaceflight Computing project exemplifies this need, pairing fault-tolerant RISC-V cores with AI acceleration for autonomous navigation.[1] NASA, “High-Performance Spaceflight Computing,” nasa.gov Demand also rises for SiC and GaN devices that endure 100 K–390 K lunar temperature swings.
On-Board Edge-AI and High-Bandwidth Payload Processing
Edge-AI reduces downlink volumes by up to 90% through in-orbit analytics, freeing spectrum and enabling real-time decision chains. Neuromorphic experiments demonstrate ultra-low power inference with intrinsic fault-tolerance to single-event upsets. Early flight heritage gained in 2024 proves that GPU-class performance can coexist with space-qualified thermal budgets, opening revenue streams in adaptive beamforming, collision avoidance, and responsive Earth observation.
Miniaturization and Mass Production of Smallsats
CubeSat heritage shows higher scientific output per dollar than traditional missions, validating small-platform economics. MEMS-based sensors and modular avionics kits shrink payload stacks while maintaining electromagnetic compatibility within ever-denser boards. Assembly lines adapted from consumer-electronics practices now deliver dozens of identical satellites per month, an essential tempo for constellation refresh cycles. Quality-assurance protocols evolve to balance statistical sampling with space-flight reliability, cutting non-recurring costs and speeding schedules.
Restraints Impact Analysis*
| Restraint | (~) % Impact on CAGR Forecast | Geographic Relevance | Impact Timeline |
|---|---|---|---|
| Export-control and compliance complexities | -0.8% | Global, heavy on US-origin transfers | Medium term (2-4 years) |
| Rad-hard foundry capacity bottlenecks | -1.1% | Concentrated in US and EU fabs | Long term (≥ 4 years) |
| Stringent space-qualification and heritage requirements | -1.0% | Global, with highest impact in North America and EU | Long term (≥ 4 years) |
| High development cost vs. relatively low volumes | -0.9% | Global, particularly affecting emerging market entrants | Medium term (2-4 years) |
| Source: Mordor Intelligence | |||
Export-Control and Compliance Complexities
In October 2024, Space Rules simplified licensing for civil programs yet left stringent requirements on defense-linked payloads, obliging manufacturers to segregate product lines and documentation workflows. Even with new license exceptions for allied nations, compliance teams must map part provenance at the wafer level, extending design-to-flight cycles and raising overhead costs.
Rad-Hard Foundry Capacity Bottlenecks
Only a handful of lines can process 300 kilorad-capable wafers at economically viable yields. CHIPS-Act grants of USD 59.4 million slightly widen capacity but lag behind projected demand for deep-space missions.[2]NIST, “CHIPS Incentives Awards to BAE Systems and Rocket Lab,” nist.gov Designers, therefore, face lead times exceeding 18 months, forcing early-stage prototype buys and inventory buffers that elevate working capital.
*Our forecasts treat driver/restraint impacts as directional, not additive. The impact forecasts reflect baseline growth, mix effects, and variable interactions.
Segment Analysis
By Platform: Autonomous capability reshapes platform demand
Satellites accounted for 66.12% of 2025 revenue, demonstrating how constellation operators anchor the space electronics market. Deep-space probes are forecast to expand at 8.74% CAGR, and the space electronics market size for these vehicles is expected to reach USD 1.23 billion by 2031 alongside rising Artemis traffic. Launch vehicles preserve a core niche because guidance and avionics must tolerate extreme vibration, while space-station refresh cycles hold steady demand for life-support electronics.
The satellite leads signals a volume-based business model: radiation-tolerant designs balance cost and life expectancy, allowing operators to refresh hardware more frequently. Deep-space missions, in contrast, rely on radiation-hardened microprocessors such as the 64-bit PIC64-HPSC, which integrates eight cores for AI workflows. Across platforms, thermal budgets constrain component selection, prompting wider use of wide-bandgap power switches that cut dissipation at high switching frequencies.


By Application: Data-centric missions widen application mix
Communication payloads retained a 44.62% share in 2025, driven by broadband and trunking services that require beamforming ASICs and precision timing. The Space electronics market size for scientific and technology demonstration missions will grow at an 7.88% CAGR, reflecting agency grants for in-orbit AI validation and materials-science studies. Earth-observation operators adopt onboard processing to deliver analytics instead of raw pixels, while navigation and surveillance missions need ultra-stable oscillators and radiation-screened GNSS receivers.
Scientific payload growth underscores a pivot toward experiment-ready satellites that can reconfigure in-flight. Field-programmable gate arrays with triplicated logic mitigate radiation faults, letting researchers load fresh algorithms during missions. Communication fleets also migrate to laser cross-links, raising data-rate demands on electro-optical transceivers and pushing clock-distribution networks into multi-gigahertz terrains.
By Component: Power efficiency lifts wide-bandgap uptake
Integrated circuits delivered 40.78% of 2025 revenue. Though smaller today, power devices will compound at 7.73% CAGR as satellites adopt SiC and GaN switches for higher conversion efficiency and reduced radiator mass. Sensors, MEMS, RF, and microwave parts follow the broader miniaturization curve, embedding multi-axis functionality into single packages.
Behind the numbers, power-device evolution is pivotal: SiC MOSFETs rated to 300 kilorads combine lower on-resistance with high-temperature headroom, enabling simplified thermal planes. System architects increasingly orchestrate point-of-load converters around these switches to trim harness weight, freeing mass for payload instruments or propellant.
By Type: Cost calculus tilts toward radiation-tolerant designs
Radiation-hardened devices still command 62.12% of 2025 spending, especially for exploration and defense assets. Yet radiation-tolerant lines will grow at 8.95% CAGR as COTS-based designs prove reliable in LEO. Satellites destined for five-year lives now accept devices screened to 30 kilorads, reducing bill-of-materials cost by factors reaching ten.
Suppliers close the gap by hardening process libraries at the mask level, harvesting inherent node-shrink benefits without the full pedigree burden. Mixed-signal controllers capable of 200 kilorad survival while staying pin-compatible with consumer parts bridge avionics and commercial ecosystems, inviting new entrants into the space electronics market.
By End-User: Dual-use procurement broadens customer base
Commercial operators represented 54.63% of 2025 revenue, anchored by broadband and Earth-observation constellations that refresh satellites within five to seven years. Military and defense budgets will record the sharpest 9.28% CAGR, underpinning resilient LEO architectures designed to withstand kinetic and cyber threats. Civil-agency demand stays stable, financing science payloads and technology-risk reduction missions.
Defense planners seek mesh-networked constellations, adopting identical hardware blocks to pull volume discounts from the same supply chains that serve commercial fleets. This convergence accelerates the Space electronics industry's adoption of security-hardened firmware, anti-tamper packaging, and zero-trust networking stacks.
Geography Analysis
North America commanded 36.45% of 2025 revenue, sustained by robust Department of Defense outlays and NASA’s deep-space portfolio that funnels high-value avionics contracts to domestic suppliers. CHIPS-Act incentives totalling USD 59.40 million finance additional radiation-hardened wafer runs, easing long-term lead-time risks and preserving the region’s dominant share. Export-control updates further open co-development pathways with Australia, Canada, and the UK, enabling allied spacecraft to source classified electronics without reallocating production lines.
Asia-Pacific delivers the fastest regional CAGR at 9.07%. National programs in China, India, and Japan galvanize private capital into satellite manufacturing clusters, while lower labor costs shorten breakeven points for mass-produced avionics sub-assemblies. Indigenous lunar and Mars missions also promote domestic chip initiatives, adding diversity to the Space electronics market supply chain and accelerating technology diffusion beyond North American and European strongholds.
Europe maintains a stable trajectory as ESA and national agencies commit to long-term exploration agendas under the 2040 strategy. Compared with US levels, funding limitations temper overall expansion, yet IRIS² and other sovereign-communications schemes lock in demand for secure, space-qualified processors and encryption ASICs. The Middle East and South America are emerging contributors; policy moves such as the UAE Supreme Space Council and Brazil’s technology-safeguards agreement create procurement channels, though infrastructure build-outs still trail mature markets.


Competitive Landscape
The space electronics market fragments along technology lines: memory chips, flight processors, and rad-hard power devices exhibit higher concentration, whereas sensors and discrete semiconductors remain contested by dozens of small vendors. Heritage suppliers leverage decades of flight qualification to justify premium pricing, while newcomers exploit commercial fabs and design-for-test automation to slash unit cost. Honeywell’s purchase of CAES underscores how incumbents consolidate to retain scale in rad-hard microelectronics, reinforcing barriers to entry for niche wafer processes.
Technology differentiation now hinges on computational throughput per watt, radiation survivability per dollar, and time-to-qualify. Microchip’s PIC64-HPSC family exemplifies this triad, offering eight-core 64-bit performance with AI acceleration inside a radiation-tolerant envelope. In parallel, neuromorphic architectures tested by the Air Force Research Laboratory hint at step-function gains in fault-tolerant inference, potentially displacing traditional von Neumann CPUs over the next decade.[4]Air Force Research Laboratory, “Neuromorphic Computing Flight Experiments,” af.mil
Partnerships knit the landscape together. Space-heritage primes pair with commercial chipmakers to co-develop power-conversion ASICs, while satellite OEMs invite cloud-computing specialists to port ML frameworks onto in-orbit GPUs. Such collaborations compress development cycles, spread non-recurring engineering costs, and accelerate cross-pollination between defense and commercial markets—a synergistic pattern defining the next growth phase of the Space electronics market.
Space Electronics Industry Leaders
Microchip Technology Inc.
BAE Systems plc
Honeywell International Inc.
Northrop Grumman Corporation
STMicroelectronics NV
- *Disclaimer: Major Players sorted in no particular order

Recent Industry Developments
- May 2025: After acquiring Capella Space, IonQ announced plans for the world’s first space-based quantum-key-distribution network, advancing quantum security in orbit.
- July 2024: Microchip unveiled the PIC64-HPSC microprocessor family, featuring a 64-bit architecture with eight CPU cores and vector-processing capabilities for autonomous spacecraft.


Research Methodology Framework and Report Scope
Market Definitions and Key Coverage
Our study defines the space electronics market as all radiation-hardened and radiation-tolerant integrated circuits, discrete semiconductors, sensors, power devices, and on-board subsystems that are designed, qualified, and sold for use on satellites, launch vehicles, deep-space probes, and associated in-orbit infrastructure. Components intended solely for ground support equipment, manufacturing test rigs, or non-space aerospace platforms are excluded.
Scope exclusion: terrestrial avionics and ground-based tracking electronics are not counted.
Segmentation Overview
- By Platform
- Satellites
- Launch Vehicles
- Deep Space Probes
- Space Stations
- By Application
- Communication
- Earth Observation
- Navigation and Surveillance
- Scientific and Technology Demonstration
- Other Applications
- By Component
- Integrated Circuits
- Power Devices
- Sensors and MEMS
- RF and Microwave Devices
- Discrete Semiconductors and Opto-electronics
- By Type
- Radiation-Hardened
- Radiation-Tolerant
- By End-User
- Commercial
- Military and Defense
- Civil Government and Space Agencies
- Geography
- North America
- United States
- Canada
- Mexico
- Europe
- United Kingdom
- Germany
- France
- Russia
- Rest of Europe
- Asia-Pacific
- China
- India
- Japan
- South Korea
- Rest of Asia-Pacific
- South America
- Brazil
- Rest of South America
- Middle East and Africa
- Middle East
- United Arab Emirates
- Saudi Arabia
- Rest of Middle East
- Africa
- South Africa
- Rest of Africa
- Middle East
- North America
Detailed Research Methodology and Data Validation
Primary Research
Mordor analysts hold structured interviews with subsystem engineers at launch integrators, procurement leads at commercial constellation operators across North America, Europe, and Asia-Pacific, and radiation-test house managers, which helps us validate mission-level bill-of-materials shares, component derating factors, and expected learning-curve price drops.
Desk Research
We first map the addressable universe using open datasets such as NASA's Satellite Database, UN-ODA's launch registry, ESA's ARTES market fact sheets, and customs shipment records from Volza. Technical demand cues are drawn from peer-reviewed IEEE papers on single-event effects, WSTS semiconductor sales splits, and budget releases of space agencies, which ground our platform and component splits. Company 10-Ks, IPO filings, and credible trade press then provide recent average selling prices and new program pipelines. This desktop phase gives our analysts foundational volumes and pricing brackets; many other reputable secondary sources supplement the list cited here.
Market-Sizing & Forecasting
A top-down launch manifest and production backlog build is overlaid with payload-level electronics content ratios, after which selective bottom-up checks, supplier roll-ups of rad-hard IC shipments and sampled ASPx volume tests, fine-tune totals. Key variables include annual satellite launches, average electronics mass per kilogram of payload, radiation qualification yield loss, small-sat constellation replacement cycles, and SiC/GaN adoption rates. Five-year forecasts rely on multivariate regression paired with scenario analysis for launch cadence shifts.
Data Validation & Update Cycle
Outputs pass two-step peer review, variance checks against external spend trackers, and anomaly flags from Factiva news feeds. Models refresh each year, with mid-cycle updates triggered by material events such as major constellation awards or rad-hard foundry outages.
Why Mordor's Space Electronics Baseline Commands Reliability
Published figures often diverge because firms mix orbital platforms with ground gear, apply different ASP erosion curves, or refresh data irregularly.
By centering on space-qualified hardware only and revisiting inputs after every significant launch window, Mordor delivers a balanced baseline clients can trust.
Benchmark comparison
| Market Size | Anonymized source | Primary gap driver |
|---|---|---|
| USD 5.06 B | Mordor Intelligence | - |
| USD 9.44 B (2024) | Global Consultancy A | Includes ground stations and power subsystems, uses static ASPs |
| USD 2.80 B (2025) | Industry Association B | Counts factory gate revenues only, omits aftermarket replacements |
| USD 1.60 B (2022) | Regional Consultancy C | Historic base year, conservative launch manifest, no price-learning factor |
The comparison shows how varying scopes and assumptions widen the spread, whereas Mordor's disciplined variable selection, timely refresh, and dual-path validation keep our estimate both transparent and decision-ready.


Key Questions Answered in the Report
What is the current value of the Space electronics market?
The Space electronics market size reached USD 5.32 billion in 2026 and is forecasted to grow to USD 6.86 billion by 2031, expanding at a 5.19% CAGR over 2026-2031.
Which platform segment leads the market today?
Satellites dominate with a 66.12% share of 2025 revenue due to large LEO broadband constellations.
Why are radiation-tolerant parts gaining traction?
Radiation-tolerant components cut cost up to tenfold versus fully rad-hard parts and meet the shorter mission lives of LEO satellites, driving a 8.95% CAGR through 2031.
Which region is expanding fastest?
Asia-Pacific shows the highest growth at a 9.07% CAGR, supported by expanding programs in China, India, and Japan.
How are edge-AI capabilities shaping satellite design?
Onboard AI reduces downlink bandwidth needs by up to 90%, enabling real-time analytics and autonomous operations, which in turn boosts demand for high-performance yet radiation-resistant processors.
What is the main supply-chain bottleneck?
Limited rad-hard wafer capacity in US and EU fabs constrains deliveries, lengthening lead times and influencing design choices toward radiation-tolerant or COTS-based alternatives.
Page last updated on:


