Space Robots Market Size and Share
Market Overview
| Study Period | 2020 - 2031 |
|---|---|
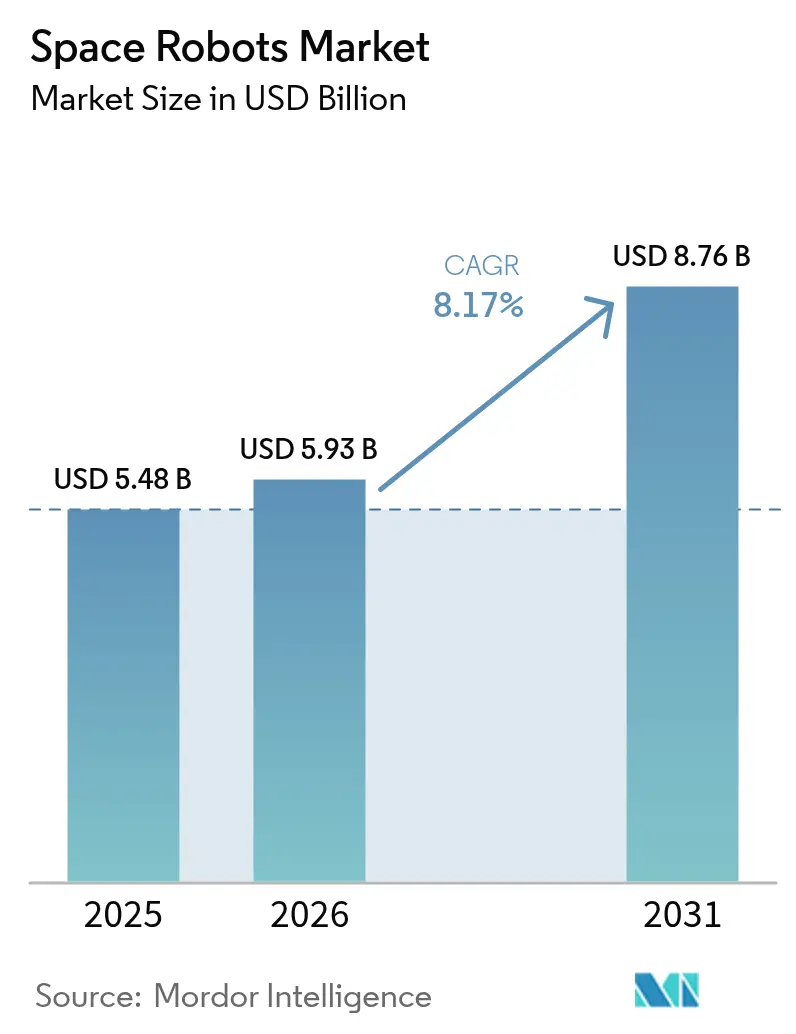
| Market Size (2026) | USD 5.93 Billion |
| Market Size (2031) | USD 8.76 Billion |
| Growth Rate (2026 - 2031) | 8.17% CAGR |
| Fastest Growing Market | Middle East and Africa |
| Largest Market | North America |
| Market Concentration | Medium |
Major Players *Disclaimer: Major Players sorted in no particular order Image © Mordor Intelligence. Reuse requires attribution under CC BY 4.0. | |
Space Robots Market Analysis by Mordor Intelligence
The space robots market size is expected to grow from USD 5.48 billion in 2025 to USD 5.93 billion in 2026 and is forecast to reach USD 8.76 billion by 2031 at 8.17% CAGR over 2026-2031. Growing demand for autonomous servicing of aging satellites, expanding government exploration programs, and falling launch costs collectively strengthened near-term revenue growth. Large public contracts, such as the Canadian Space Agency’s USD 999.8 million award for Canadarm3, confirmed sustained capital inflows from national space agencies.[1]Source: Government of Canada, “Canada begins detailed design, construction and testing of Canadarm3,” canada.ca Commercial initiatives around active-debris-removal, on-orbit manufacturing, and lunar logistics further widened addressable opportunities. Meanwhile, relaxed US export-control rules improved international collaborations, lowering regulatory friction. Market entry remained costly, yet reusable launch vehicles reduced mission budgets and allowed smaller operators to field specialized robotic platforms.
Key Report Takeaways
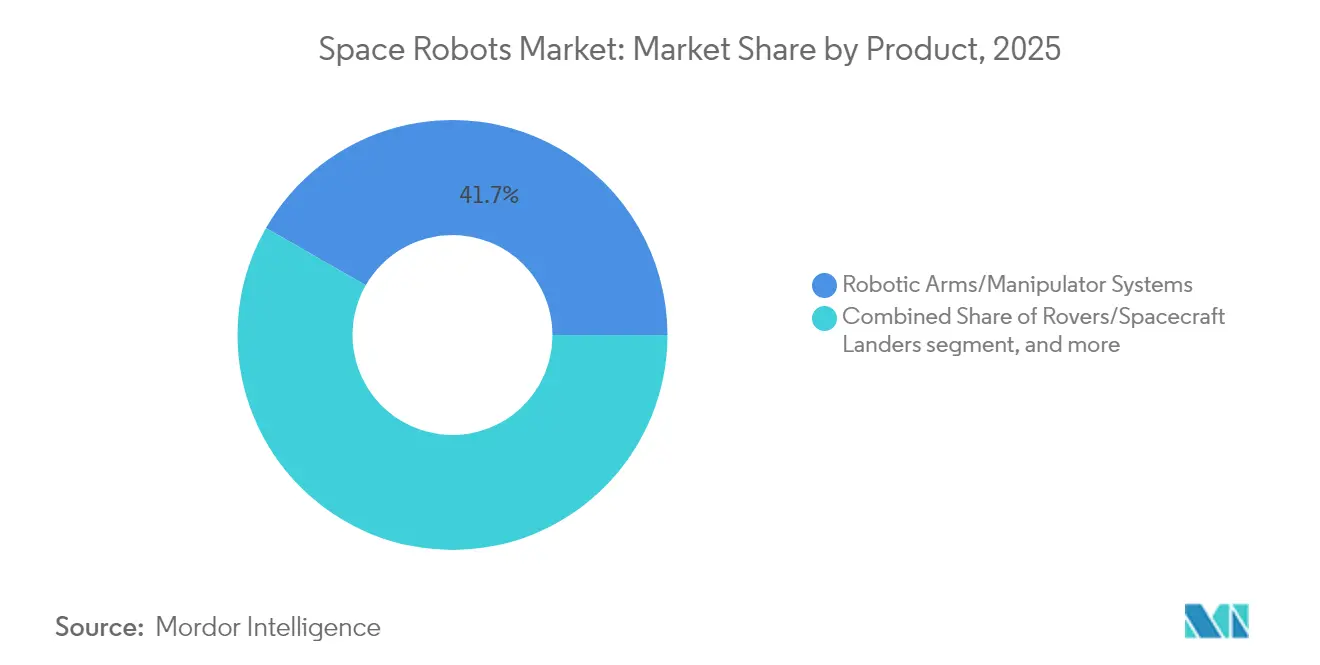
- By product, robotic arms and manipulator systems led with 41.72% revenue share in 2025; on-orbit servicing vehicles are projected to grow at a 9.33% CAGR through 2031.
- By mission type, near-space operations held 65.12% of the space robots market share in 2025, while deep-space missions are poised for a 9.86% CAGR to 2031.
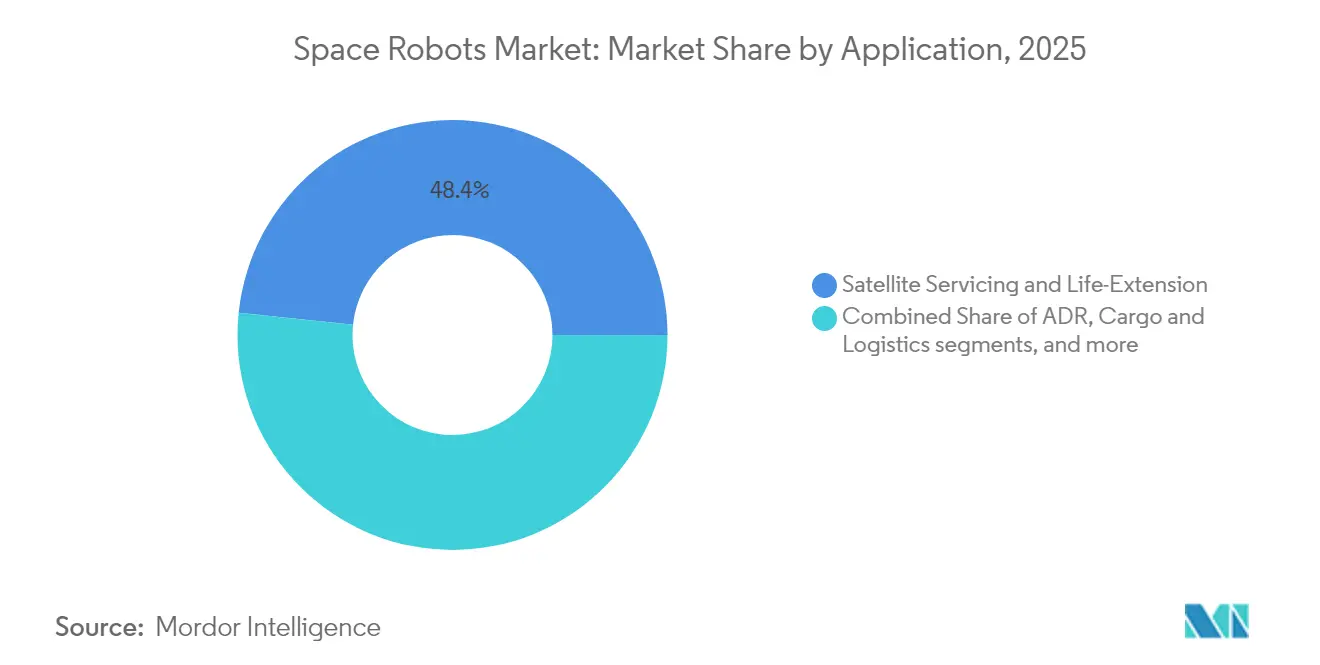
- By application, satellite servicing accounted for 48.35% of the space robots market size in 2025; active debris removal is advancing at a 11.92% CAGR.
- By end user, government entities held a 69.05% share of the space robots market in 2025, while commercial operators showed the fastest 10.22% CAGR.
- By component, hardware represented 71.88% of the space robots market size in 2025, yet software is rising at an 11.08% CAGR.
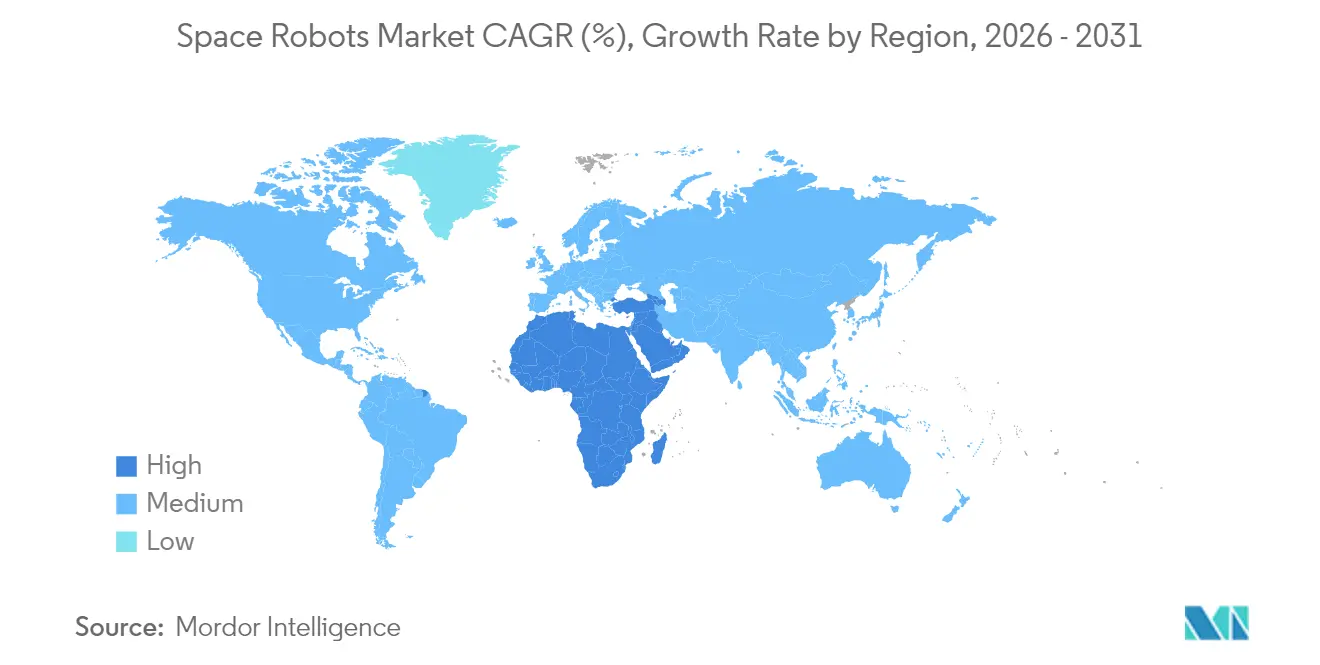
- By geography, North America led with 55.97% market share in 2025, while the Middle East and Africa region is expanding at a 11.78% CAGR.
Note: Market size and forecast figures in this report are generated using Mordor Intelligence’s proprietary estimation framework, updated with the latest available data and insights as of 2026.
Global Space Robots Market Trends and Insights
Drivers Impact Analysis*
| Driver | (~) % Impact on CAGR Forecast | Geographic Relevance | Impact Timeline |
|---|---|---|---|
| Surge in on-orbit satellite-servicing demand | +2.1% | Global, concentrated in GEO belt operators | Medium term (2-4 years) |
| Government-funded lunar and Mars exploration programs | +1.8% | North America, Europe, Asia-Pacific core | Long term (≥ 4 years) |
| Falling launch costs from reusable launchers | +1.5% | Global, with early gains in US and China | Short term (≤ 2 years) |
| Expansion of commercial lunar logistics corridors | +1.2% | North America and EU, spill-over to APAC | Long term (≥ 4 years) |
| Growth in in-space manufacturing and 3-D printing needs | +0.9% | Global, early adoption in ISS operations | Medium term (2-4 years) |
| Defense-led demand for autonomous ISR rendezvous | +0.8% | National security focused regions | Medium term (2-4 years) |
| Source: Mordor Intelligence | |||
Surge in On-Orbit Satellite-Servicing Demand
High replacement costs for geostationary satellites, often surpassing USD 400 million, made life-extension missions economically compelling. Intelsat’s 2024 agreement with Starfish Space set a commercial precedent for robotic servicing, with the first mission slated for 2026. Northrop Grumman progressed toward a 2026 robot-armed Mission Extension Pod launch, validating confidence in near-term revenue. Parallel activity at the European Space Agency, which advanced its Geostationary Servicing Vehicle toward a 2028 debut, signaled agency-wide endorsement.[2]Source: ESA, “ESA moves ahead with In-Orbit Servicing missions,” esa.int Collectively, these milestones underpinned recurring demand for refueling, relocation, and inspection services, boosting predictable cash flows for in-orbit robotics providers.
Government-Funded Lunar and Mars Exploration Programs
NASA’s Artemis framework continued to allocate multi-year funding to robotic systems, evidenced by the CADRE rover network that passed integrated testing in March 2025. ESA’s Argonaut lunar lander target for 2031 introduced a 1,500 kg cargo capacity, supporting large-scale surface logistics. China accelerated its robotic lunar research outpost timeline by 2035, intensifying technology competition. These parallel programs stimulated demand for rugged manipulators, autonomous navigation software, and modular mobility platforms tailored to harsh lunar and Martian environments.
Falling Launch Costs from Reusable Launchers
SpaceX’s Falcon 9 drove launch prices down to USD 2,700 per kg to low Earth orbit, a fraction of historical expendable-vehicle rates. This pricing shift enabled more frequent missions and justified smaller, specialized robotic payloads. Chinese launch providers, including LandSpace, announced commercially reusable vehicles for 2025, adding competitive pressure. Lower cost-to-orbit dynamics encouraged venture investment in CubeSat-class servicing systems, shortening payback periods and spurring faster product cycles.
Expansion of Commercial Lunar Logistics Corridors
Venture funding flowed to private lunar-resource companies, such as Starpath Robotics' USD 12 million raise to develop mining systems. NASA's Commercial Lunar Payload Services contracts awarded to multiple firms institutionalized routine cargo delivery to the Moon. Partnerships like Astroport and Orbit Fab's in-space refueling initiative illustrated the private-sector commitment to a cis-lunar economy. With these logistics plans, demand for robotic cargo handling, excavation, and maintenance platforms rose in lockstep.
Restraints Impact Analysis*
| Restarint | (~) % Impact on CAGR Forecast | Geographic Relevance | Impact Timeline |
|---|---|---|---|
| High development and qualification costs | -1.4% | Global, particularly affecting smaller players | Long term (≥ 4 years) |
| Export-control (ITAR/EAR) complexities | -0.8% | US-centric, affecting international partnerships | Medium term (2-4 years) |
| Legal liability over active-debris-removal missions | -0.6% | Global, regulatory uncertainty | Long term (≥ 4 years) |
| Lack of open interface standards for servicing ports | -0.5% | Global, industry standardization needed | Medium term (2-4 years) |
| Source: Mordor Intelligence | |||
High Development and Qualification Costs
Space-qualified components required extensive radiation testing, fault-tolerant design, and niche manufacturing, inflating non-recurring engineering expenses. Smaller entrants faced capital hurdles exceeding USD 50 million before first revenue, limiting new competition.[3]Source: Aerospace America, “Expanding the final frontier with robots,” aerospaceamerica.aiaa.org Government cost-sharing grants alleviated some burden, yet long design cycles still restrained near-term market acceleration.
Export-Control Complexities
Despite recent US reforms, International Traffic in Arms Regulations continued to require detailed licensing for space robotics hardware. Multinational projects often experienced month-long approval processes that delayed integration schedules. Partners outside the United States sought ITAR-free subsystems, fragmenting supply chains and increasing qualification testing redundancies.
*Our forecasts treat driver/restraint impacts as directional, not additive. The impact forecasts reflect baseline growth, mix effects, and variable interactions.
Segment Analysis
By Product: Manipulator Systems Maintain Revenue Leadership
Robotic arms dominated 2025 revenue, generating 41.72% of total sales from critical station maintenance and satellite capture assets. The space robots market size for manipulator systems is forecast to expand steadily through 2031 on the back of the Canadarm3 program. Complex joints, multi-sensor end-effectors, and radiation-hardened electronics supported premium pricing. Growth also stemmed from planetary rovers using lightweight arm variants to collect regolith and deploy instruments.
On-orbit servicing vehicles posted the quickest 9.33% CAGR outlook, reflecting operator interest in modular spacecraft hosting robotic arms and refueling pods. Service providers secured anchor customers through multi-year performance-based contracts, signaling confidence in pay-per-thrust business models. Gripping and docking mechanisms gained traction as agencies converged on standard interfaces, while emerging concepts such as surgical robots aboard the ISS captured niche R&D budgets.


By Mission Type: Near Space Dominance with Deep Space Momentum
Near-space activities within Earth’s gravitational sphere attained a 65.12% market share in 2025 thanks to high satellite density and immediate revenue opportunities. Robust demand for inspection, relocation, and station upkeep kept fleet operators focused on reliable robotic assets. As governments prioritize orbital safety, the market share for space robots for near-space platforms will remain elevated through mid-decade.
Deep-space missions recorded a smaller base but posted a leading 9.86% CAGR forecast. Investments in autonomous navigation, radiation-tolerant actuators, and adaptive AI allowed spacecraft to operate with longer communication delays. NASA’s Mars Ascent Vehicle program advanced reinforcement-learning algorithms for off-world ascent guidance. ESA’s 2028 ExoMars Rosalind Franklin rover and China’s sample-return initiatives defined sustained demand for sophisticated robotic explorers.
By Application: Servicing Leads While Debris-Removal Surges
Satellite servicing held 48.35% of 2025 revenue because fleet operators viewed life extension as cheaper than replacement. The space robots market size for servicing solutions is projected to post steady gains through dedicated life-extension contracts. Active debris removal, although nascent, achieved the fastest 11.92% CAGR projection after Astroscale’s ADRAS-J fly-around demonstration in July 2024. Agencies and insurers are increasingly considering regulatory measures that may soon mandate debris-mitigation services.
On-orbit assembly grew alongside in-space manufacturing proofs such as ESA’s Metal 3D Printer on the ISS. Exploration and scientific research applications retained stable budgets through planned planetary missions. Cargo and logistics robotics registered rising venture interest as commercial lunar operations crystallized.
By End User: Public Sector Still Dominant, Commercial Gains Pace
Governments captured a 69.05% market share in 2025, reflecting the historic dominance of space exploration budgets. Space agencies funded flagship lunar infrastructure, while defense organizations procured inspection and surveillance robots. The market size for space robots for government programs will grow steadily, yet the absolute share is set to decline marginally as commercial entities scale.
Commercial operators posted the 10.22% CAGR, supported by geostationary satellite owners adopting service contracts and NewSpace startups deploying micro-satellites. Research institutes partnered with agencies to test novel mobility concepts, while venture-backed startups such as GITAI raised USD 129 million to commercialize cost-effective arms. Market sentiment indicated a growing appetite for risk-sharing models, accelerating private technology validation.
By Component: Hardware Commands Spend, Software Drives Innovation
Hardware comprised 71.88% of 2025 sales, reflecting material-intensive structural, actuator, and sensor systems. The space robots market share for hardware remained high because qualified components demand premium margins. Composite booms, radiation-hardened processors, and redundant electromechanical joints dominated procurement budgets.
Software generated smaller revenue but delivered the highest 11.08% CAGR. AI-based autonomy stacks enabled spacecraft to evaluate contingencies without ground intervention. India’s Chandrayaan-3 landing sequence, guided by onboard machine-learning vision algorithms, highlighted the software’s rising mission-critical role. Sensor-fusion frameworks combined lidar, optical, and inertial data, while secure middleware managed time-sensitive commands over constrained bandwidth links.
Geography Analysis
North America retained a 55.97% market share in 2025, supported by NASA’s Artemis contracting pipeline and a vibrant commercial launch ecosystem. In June 2025, SpaceX secured a USD 843 million contract to build an ISS deorbit vehicle. Canadian expertise in robotic manipulators, anchored by MDA Space’s Canadarm heritage, further reinforced regional leadership.
Asia-Pacific sustained strong double-digit growth as China funded six-legged asteroid-mining robots to cut reliance on terrestrial rare metals. Japan’s JAXA awarded GITAI a concept study for a lunar rover arm in April 2025. India prepared its next generation of autonomous lunar rovers, while Australian startups explored robotic regolith processing, collectively widening the regional supplier base.
The Middle East and Africa region achieved the fastest 11.78% CAGR outlook. The UAE advanced sovereign AI-enabled spacecraft through state-backed programs, including secure communication contracts worth USD 5.1 billion. The African Space Agency, inaugurated in Cairo in May 2025, coordinated continental R&D objectives for satellite production and orbital debris management.
Europe maintained stable expansion, supported by ESA’s PERASPERA initiative, which pooled EU funding for modular servicing vehicles and dexterous manipulators. Regulatory clarity under the EU Space Law proposal bolstered investor confidence in cross-border robotics projects. Cooperative missions such as Hera, targeting asteroid-deflection rehearsals with robotic probes, underscored the region’s emphasis on planetary defense.
South America represented an early-stage opportunity. Brazil renewed discussions with ESA on hosting autonomous robotic testbeds at the Alcântara launch site, yet funding constraints limited near-term deliveries. Emerging public-private consortia signaled intent to participate once launch prices ease.

Competitive Landscape
The competitive field featured a blend of heritage aerospace firms and venture-backed specialists. Northrop Grumman, MDA Space, and Lockheed Martin leveraged decades of flight heritage and longstanding customer trust to secure flagship contracts such as NASA’s OSAM-2 architecture. Their vertically integrated production lines supported high-reliability subsystems.
Mid-size innovators targeted niche services. Astroscale specializes in debris-capture and secured a critical design review for OneWeb cleanup in June 2025. Starfish Space signed Intelsat for a 2026 life-extension mission, validating pay-per-maneuver economics. GITAI opened a US defense subsidiary to access classified opportunities, highlighting the strategic value of local presence.
Technology differentiation centered on autonomy. Apptronik partnered with Google DeepMind to embed large-language-model reasoning in humanoid robots to reduce teleoperator workload. Standardized docking interfaces emerged as a white-space opportunity, as inconsistent ports hindered multi-vendor cooperation. Startups promoting open standards sought early-mover advantages in servicing interoperability.
Investment dynamics favored dual-use capabilities that attracted both civil and defense customers. DARPA’s Robotic Servicing of Geosynchronous Satellites program remained a bellwether for advanced inspection and manipulation technologies. Private equity funds monitored upcoming regulatory decisions requiring debris-removal compliance, potentially unlocking recurring revenue akin to compulsory aircraft maintenance.
Space Robots Industry Leaders
Northrop Grumman Corporation
Lockheed Martin Corporation
Maxar Technologies Holdings Inc.
Astroscale Holdings Inc.
MDA Space Ltd.
- *Disclaimer: Major Players sorted in no particular order


Recent Industry Developments
- April 2025: GITAI secured a JAXA study contract for a lunar-rover arm concept, supporting Japan’s Artemis contribution.
- March 2025: NASA completed testing of the CADRE network of small lunar rovers.
- November 2024: Atomic-6 partnered with Starpath Robotics on a lunar power-tower concept.


Research Methodology Framework and Report Scope
Market Definitions and Key Coverage
Mordor Intelligence defines the space robots market as revenue from newly manufactured robotic hardware, embedded software, and control systems that execute inspection, logistics, construction, servicing, or scientific tasks in Earth orbit and on celestial bodies. Covered products include rovers or landers, robotic arms and manipulators, gripping or docking units, space probes, and dedicated on-orbit servicing vehicles.
Scope exclusion: consumer educational kits and ground-only test platforms are not counted.
Segmentation Overview
- By Product
- Rovers/Spacecraft Landers
- Robotic Arms/Manipulator Systems
- Space Probes
- Gripping and Docking Systems
- On-Orbit Servicing Vehicles
- Others Products
- By Mission Type
- Deep Space
- Near Space
- By Application
- Satellite Servicing and Life Extension
- Active Debris Removal
- On-Orbit Assembly and Manufacturing
- Exploration and Scientific Research
- Cargo and Logistics
- By End-User
- Commercial
- Commercial Satellite Operators
- Research Institutes
- NewSpace Start-ups
- Government
- Space Agencies
- Defence and Intelligence
- Commercial
- By Component
- Hardware
- Manipulators
- Structural and Mobility Platform
- Sensor and Vision Systems
- Power Subsystems
- Commuincation System
- Software
- Autonomy and Navigation Software
- Sensor Fusion and Data Processing
- Commuincation and Data Management Software
- Others
- Hardware
- By Geography
- North America
- United States
- Canada
- Mexico
- South America
- Brazil
- Rest of South America
- Europe
- United Kingdom
- Germany
- France
- Russia
- Rest of Europe
- Asia-Pacific
- China
- Japan
- India
- South Korea
- Australia
- Rest of Asia-Pacific
- Middle East and Africa
- Middle East
- Saudi Arabia
- Israel
- United Arab Emirates
- Rest of Middle East
- Africa
- South Africa
- Rest of Africa
- Middle East
- North America
Detailed Research Methodology and Data Validation
Primary Research
Short interviews and surveys with mission planners at space agencies, engineers inside prime contractors, and founders of NewSpace robotics firms supplied average selling prices, payload mass breakouts, and adoption intentions, letting us challenge secondary numbers and close information gaps.
Desk Research
We screened open sources such as the UNOOSA launch register, NASA's SSDCA payload archive, ESA expenditure statements, and HS-880260 export records. We then layered insights from peer-reviewed papers on IEEE Xplore. Contract values and shipment clues were extracted from company 10-Ks and procurement notices stored in D&B Hoovers, while news wires gathered through Dow Jones Factiva flagged upcoming missions. These titles illustrate our range; many other public and proprietary documents underpinned the dataset.
Market-Sizing & Forecasting
Our top-down model begins with projected launch manifests by mass class and mission type, multiplies them by average robotics payload per launch, and layers expected service revenue where robotic vehicles provide life extension or debris removal contracts. Bottom-up checks, supplier shipment samples and channel ASP data, temper the totals. Core variables include launch cadence, on-orbit servicing contract count, lunar surface funding, propulsion cost to LEO, and autonomous software update frequency. Multivariate regression with scenario analysis extends results through 2030; gaps in shipment data are patched using proportional scaling tied to verified launch counts.
Data Validation & Update Cycle
Outputs face variance checks against independent satellite databases and an internal peer review. We refresh the model each year and issue interim revisions when funding awards, launch delays, or pivotal demonstrations materially change the inputs.
Credibility Behind Mordor's Space Robots Baseline
Published estimates differ because providers mix dissimilar product sets, lock exchange rates, or extend speculative mission scenarios.
Mordor's tight scope, quarterly currency updates, and evidence-based contract tracking give decision makers a dependable baseline.
Benchmark comparison
| Market Size | Anonymized source | Primary gap driver |
|---|---|---|
| USD 5.48 B (2025) | Mordor Intelligence | - |
| USD 4.70 B (2023) | Global Consultancy A | Counts ground-only robotics and uses static 2022 pricing |
| USD 5.41 B (2024) | Regional Consultancy B | Scales one ISS contract to the entire market |
| USD 2.88 B (2018) | Trade Journal C | Outdated baseline; excludes servicing revenue |
These contrasts show how Mordor's regularly audited, launch-linked approach yields a balanced, transparent figure that clients can reproduce with clear assumptions and up-to-date inputs.


Key Questions Answered in the Report
What was the size of the space robots market in 2026?
The market reached USD 5.93 billion in 2026.
What return on investment can a satellite operator expect from on-orbit servicing contracts?
Life-extension services commonly defer USD 400 million replacement costs for five to seven years, producing payback periods under two years for GEO fleet owners that spend USD 50–100 million per servicer mission.
Which robotic technologies are most likely to reach Technology Readiness Level 9 by 2028?
Autonomous manipulator arms qualified for the lunar Gateway and standardized grappling fixtures for GEO servicing vehicles are already at TRL 7–8 in 2025 and are scheduled for flight validation on commercial missions before 2028.
Which region is expanding most rapidly?
The Middle East and Africa are forecasted to grow at a 11.78% CAGR due to recent national space programs.
Which workforce skills will be most constrained over the next five years?
Deep-space autonomy software engineers, radiation-hardened avionics designers, and orbital dynamics specialists remain in short supply, with projected demand outpacing the current talent pool by at least 20% through 2030.
How should space insurers adjust risk models for missions that rely on autonomous servicers?
Actuarial teams increasingly apply a 5–10% premium discount when operators use flight-proven docking interfaces and redundancy-rich robotic arms, yet add a surcharge if debris-removal tasks involve uncooperative tumbling objects.
Page last updated on:


