
Aerospace & Defense
8th MayFeasibility Analysis for FBO Services in East Africa
3 Min Read
The Space Power Electronics Market Report is Segmented by Component (Power Integrated Circuits, Power Discrete Devices, Power Modules, and More), Voltage Range (less Than 28 V, and More), Platform (Satellites, Launch Vehicles, and More), Application (Communication, and More), End-User (Commercial, and More), and Geography (North America, Europe, and More). The Market Forecasts are Provided in Terms of Value (USD).
Market Overview
| Study Period | 2020 - 2031 |
|---|---|
| Market Size (2026) | USD 413.71 Million |
| Market Size (2031) | USD 933.72 Million |
| Growth Rate (2026 - 2031) | 17.68 % CAGR |
| Fastest Growing Market | Asia Pacific |
| Largest Market | North America |
| Market Concentration | Medium |
Major Players *Disclaimer: Major Players sorted in no particular order. Image © Mordor Intelligence. Reuse requires attribution under CC BY 4.0. |
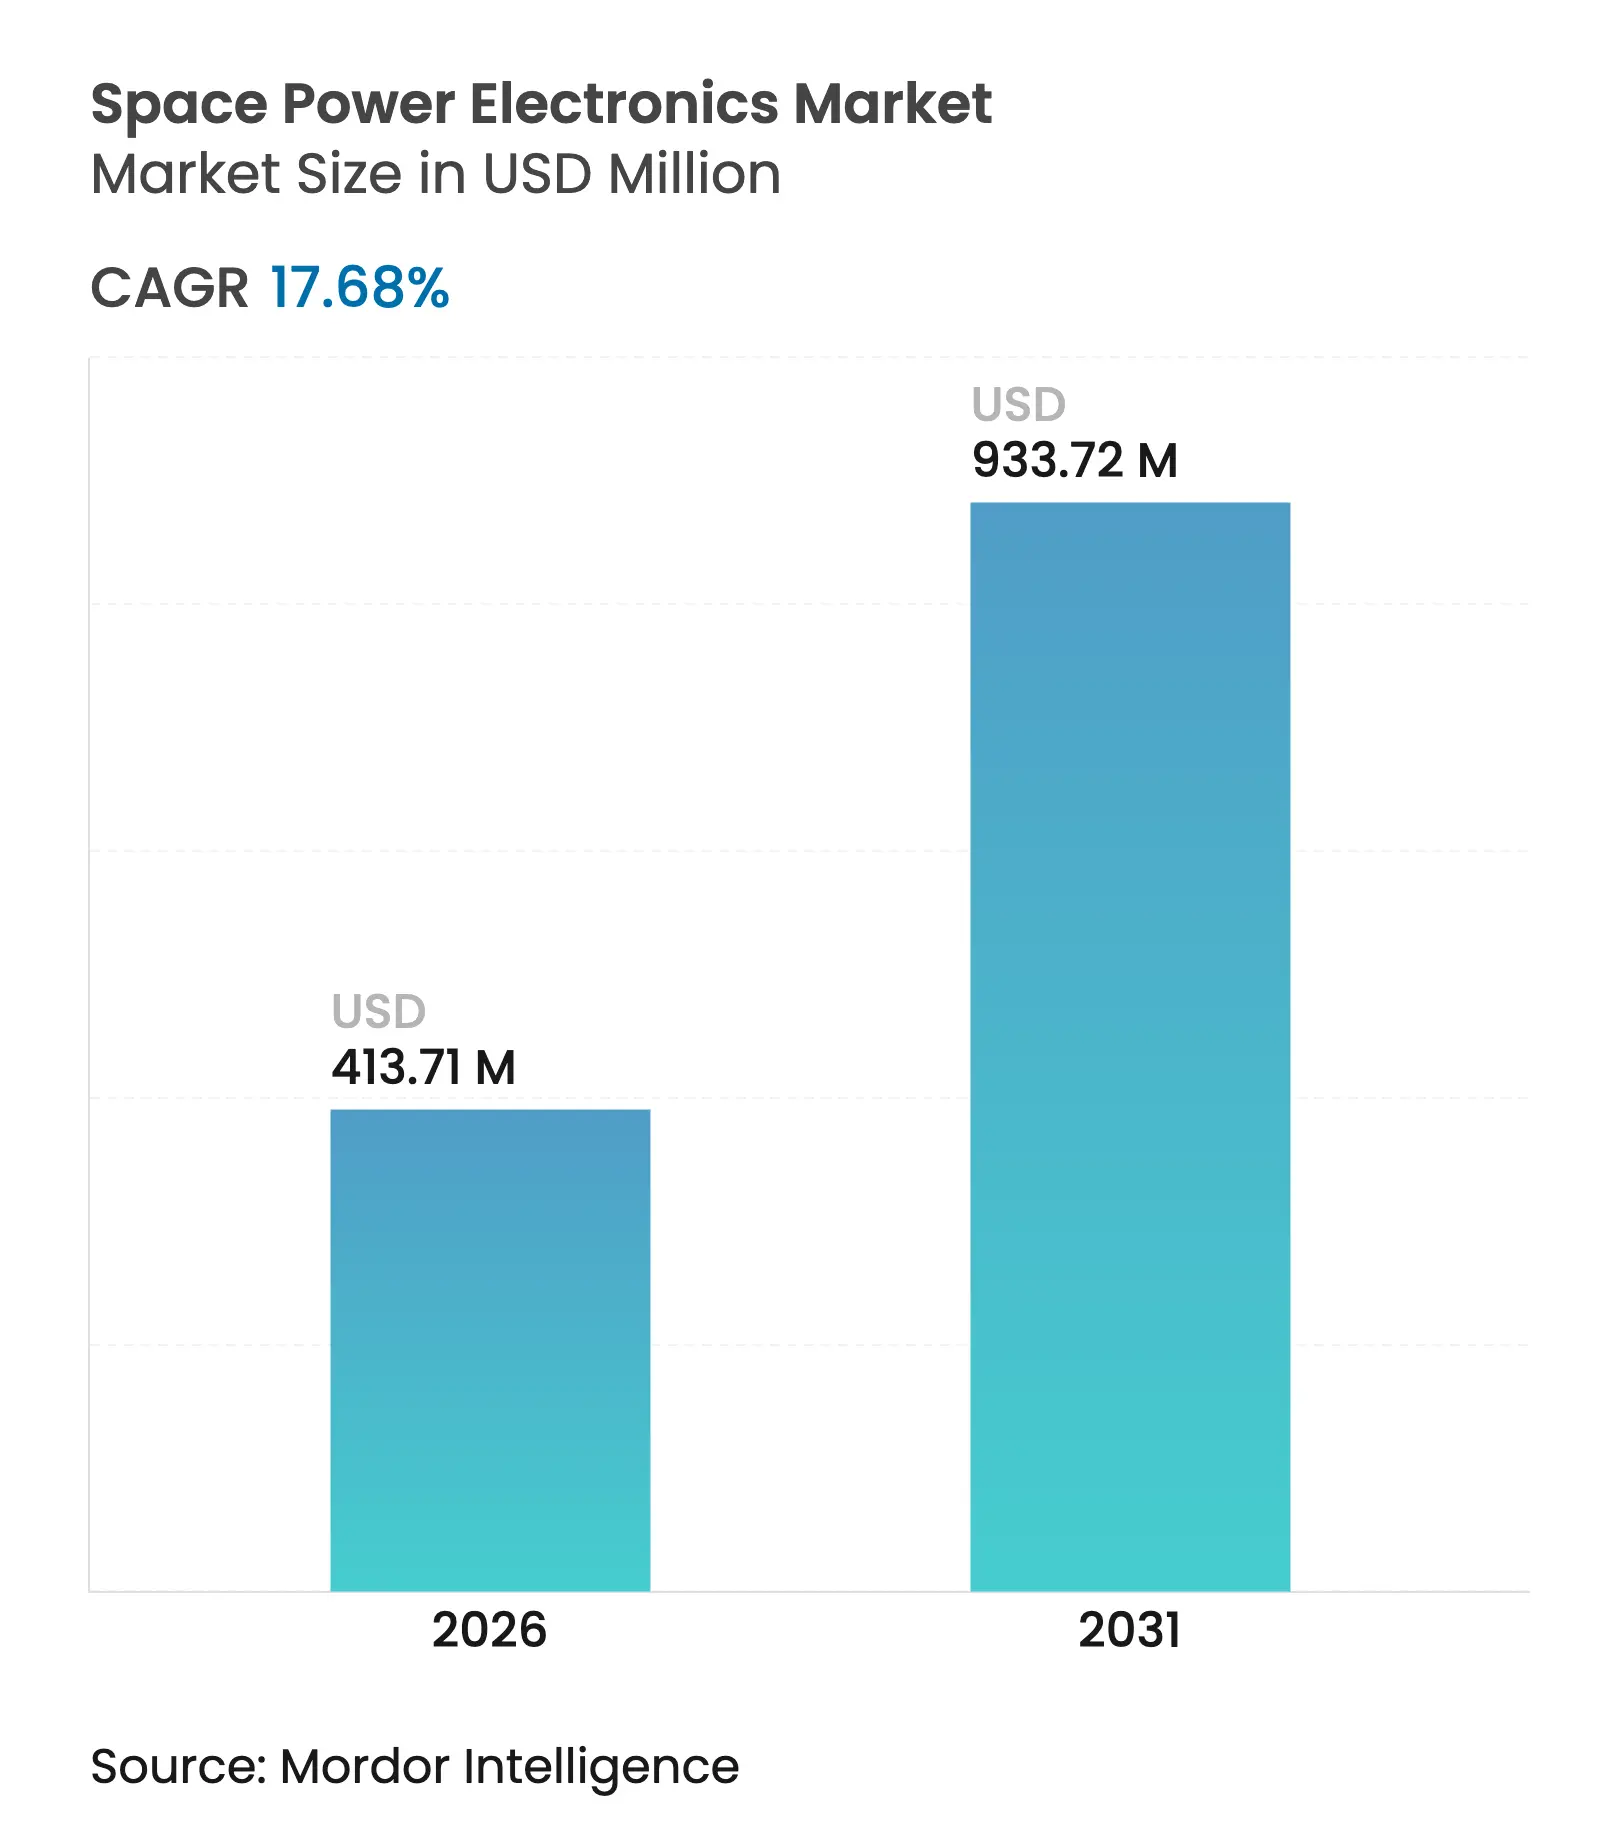
The space power electronics market size was valued at USD 351.56 million in 2025 and estimated to grow from USD 413.71 million in 2026 to reach USD 933.72 million by 2031, at a CAGR of 17.68% during the forecast period (2026-2031). The growth reflects rising demand for compact, high-density power architectures that support proliferating small-satellite constellations and expanding government deep-space programs. Adoption of gallium nitride (GaN) and silicon carbide (SiC) devices has accelerated because these wide-bandgap materials offer 3–5 times higher power density and improved radiation tolerance compared with legacy silicon, allowing designers to shrink converter footprints and ease thermal constraints. Satellite operators also specify higher bus voltages to feed electric propulsion, optical communications, and active array antennas, pushing power‐processing units toward SiC-based 100 V-plus topologies. Supply-chain resilience has become a parallel growth driver as the US, the European Union (EU), and Japan invest in domestic GaN–SiC manufacturing to lower reliance on gallium sourced almost entirely from China. Market entrants that can deliver radiation-tolerant, high-integration modules at automotive-style volumes are positioned to capture share as the constellation wave crests through the decade.
Key Report Takeaways
Note: Market size and forecast figures in this report are generated using Mordor Intelligence's proprietary estimation framework, updated with the latest available data and insights as of 2026.
Drivers Impact Analysis
| Driver | (~) % Impact on CAGR Forecast | Geographic Relevance | Impact Timeline | |||
|---|---|---|---|---|---|---|
High-density power architectures for small-satellite constellations High-density power architectures for small-satellite constellations | +4.2% | North America, Asia-Pacific | Medium term (2–4 years) | (~) % Impact on CAGR Forecast:+4.2% | Geographic Relevance:North America, Asia-Pacific | Impact Timeline:Medium term (2–4 years) |
Surge in high-throughput and optical-communication satellites Surge in high-throughput and optical-communication satellites | +3.8% | Global | Short term (≤ 2 years) | |||
Reusable launch vehicles requiring rugged power control Reusable launch vehicles requiring rugged power control | +2.9% | North America, Asia-Pacific | Medium term (2–4 years) | |||
Rapid penetration of gallium nitride (GaN) and silicon carbide (SiC) power semiconductors Rapid penetration of gallium nitride (GaN) and silicon carbide (SiC) power semiconductors | +4.5% | Asia-Pacific, Europe | Medium term (2–4 years) | |||
Adoption of electric and hybrid propulsion systems necessitating efficient power conditioning Adoption of electric and hybrid propulsion systems necessitating efficient power conditioning | +3.1% | Global, with early adoption in North America and Europe | Long term (≥ 4 years) | |||
Government deep-space and lunar missions requiring radiation-hardened electronics Government deep-space and lunar missions requiring radiation-hardened electronics | +2.7% | North America, Europe, Asia-Pacific, emerging in Middle East | Long term (≥ 4 years) | |||
| Source: Mordor Intelligence | ||||||
Miniaturization-driven high-density power architectures for small-satellite constellations
Small-satellite builders now expect power stages delivering 20-30-fold higher current within CubeSat-class envelopes, forcing suppliers to combine advanced packaging, multiphase regulation, and sophisticated thermal interfaces in a single module.[1]Vicor Corporation, “Radiation-Tolerant Power Modules,” vicorpower.com Higher density lets manufacturers devote more mass to revenue-generating payloads, a priority as constellation counts accelerate into the thousands. NASA notes that solar-array efficiency topping 32% further amplifies current levels that converters must handle. European start-ups such as SPHERICAL exploit this shift by developing software-defined power systems that dynamically reallocate bus capacity, a capability made possible by tightly integrated power modules funded under the European Innovation Council.
Surge in high-throughput and optical-communication satellites elevating power budgets
Next-generation GEO and MEO satellites use digital processors and optical links that raise the payload draw to tens of kilowatts, compelling centralised power-supply units capable of clean DC delivery under rapid load swings. Missions like NASA’s Europa Clipper illustrate this change: the craft carries solar arrays that still produce 700 W at the end of life, supported by lithium-ion batteries to bridge eclipses. Similar optical crosslinks aboard constellations must maintain tight power-noise specs to avoid beam jitter, prompting surge-rated point-of-load converters and radiation-tolerant regulators.
Reusable launch vehicles stimulating demand for rugged power control modules
Multiple-flight launchers such as SpaceX Starship expose avionics power chains to repetitive acoustic, thermal, and vibrational stress. Suppliers now qualify modules for hundreds of hot-fire cycles and cryogenic transitions. Chinese vehicle makers developing reusable methane–oxygen rockets set the same requirements, widening the addressable market for automotive-derived GaN half-bridges repackaged to survive deep-vacuum operation. Wireless power transfer schemes are also being studied to simplify stage separation harnesses, demanding high-frequency converters with soft-switching topologies.
Rapid penetration of gallium nitride (GaN) and silicon carbide (SiC) power semiconductors
European programs such as ESA’s GREAT2 have built a regional supply chain for radiation-hardened GaN microwave devices, while parallel SiC breakthroughs deliver 40% lower RDS(on)×Area than prior generations. STMicroelectronics already leads terrestrial SiC sales and is migrating trench-based super-junction structures to space-grade packages. The materials combine high breakdown field with superior thermal conductivity, enabling smaller, lighter converters that tolerate bus voltages above 100 V without derating. As qualification datasets expand, GaN and SiC are poised to dominate new-build constellations launched after 2027.
Restraints Impact Analysis
| Restraint | (~) % Impact on CAGR Forecast | Geographic Relevance | Impact Timeline | |||
|---|---|---|---|---|---|---|
High non-recurring engineering (NRE) and lengthy rad-hard qualification High non-recurring engineering (NRE) and lengthy rad-hard qualification | -2.8% | North America, Europe | Long term (≥ 4 years) | (~) % Impact on CAGR Forecast:-2.8% | Geographic Relevance:North America, Europe | Impact Timeline:Long term (≥ 4 years) |
Supply-chain constraints in high-performance semiconductor substrates Supply-chain constraints in high-performance semiconductor substrates | -3.2% | Global | Medium term (2–4 years) | |||
Obsolescence risk from misaligned satellite development and semiconductor lifecycle timelines Obsolescence risk from misaligned satellite development and semiconductor lifecycle timelines | -1.9% | Global, most pronounced in commercial space sector | Short term (≤ 2 years) | |||
Elevated certification costs due to fragmented radiation-hardening standards across international space agencies and commercial stakeholders Elevated certification costs due to fragmented radiation-hardening standards across international space agencies and commercial stakeholders | -2.1% | Global, with regional variations in standards adoption | Long term (≥ 4 years) | |||
| Source: Mordor Intelligence | ||||||
High non-recurring engineering (NRE) and lengthy rad-hard qualification
Space programs still require device screening for total ionising dose, single-event effects, and outgassing, extending product introductions by 18–36 months. NASA classifies electrical parts into three performance levels, with Level 1 parts undergoing exhaustive testing that inflates unit costs. To ease budgets, suppliers such as Microchip offer radiation-tolerant COTS variants that blend commercial die with enhanced process control, trimming validation time, yet meet mission reliability demands.
Supply-chain constraints in high-performance semiconductor substrates
China produces 98% of global gallium, and export controls have restricted gallium shipments to US defense contractors, complicating access to GaN wafers. Europe has reacted with the EUR 89.3 million (USD 102.65 million) TRANSFORM project, linking 33 partners to create a cradle-to-packaged-device SiC supply chain across seven countries.[2]TRANSFORM Project, “Building a European SiC Supply Chain,” transformproject.eu The US is likewise channeling CHIPS Act grants to companies such as BAE Systems plc and Rocket Lab to build domestic epi-growth and substrate capability.
By Component: Power Modules Drive Integration
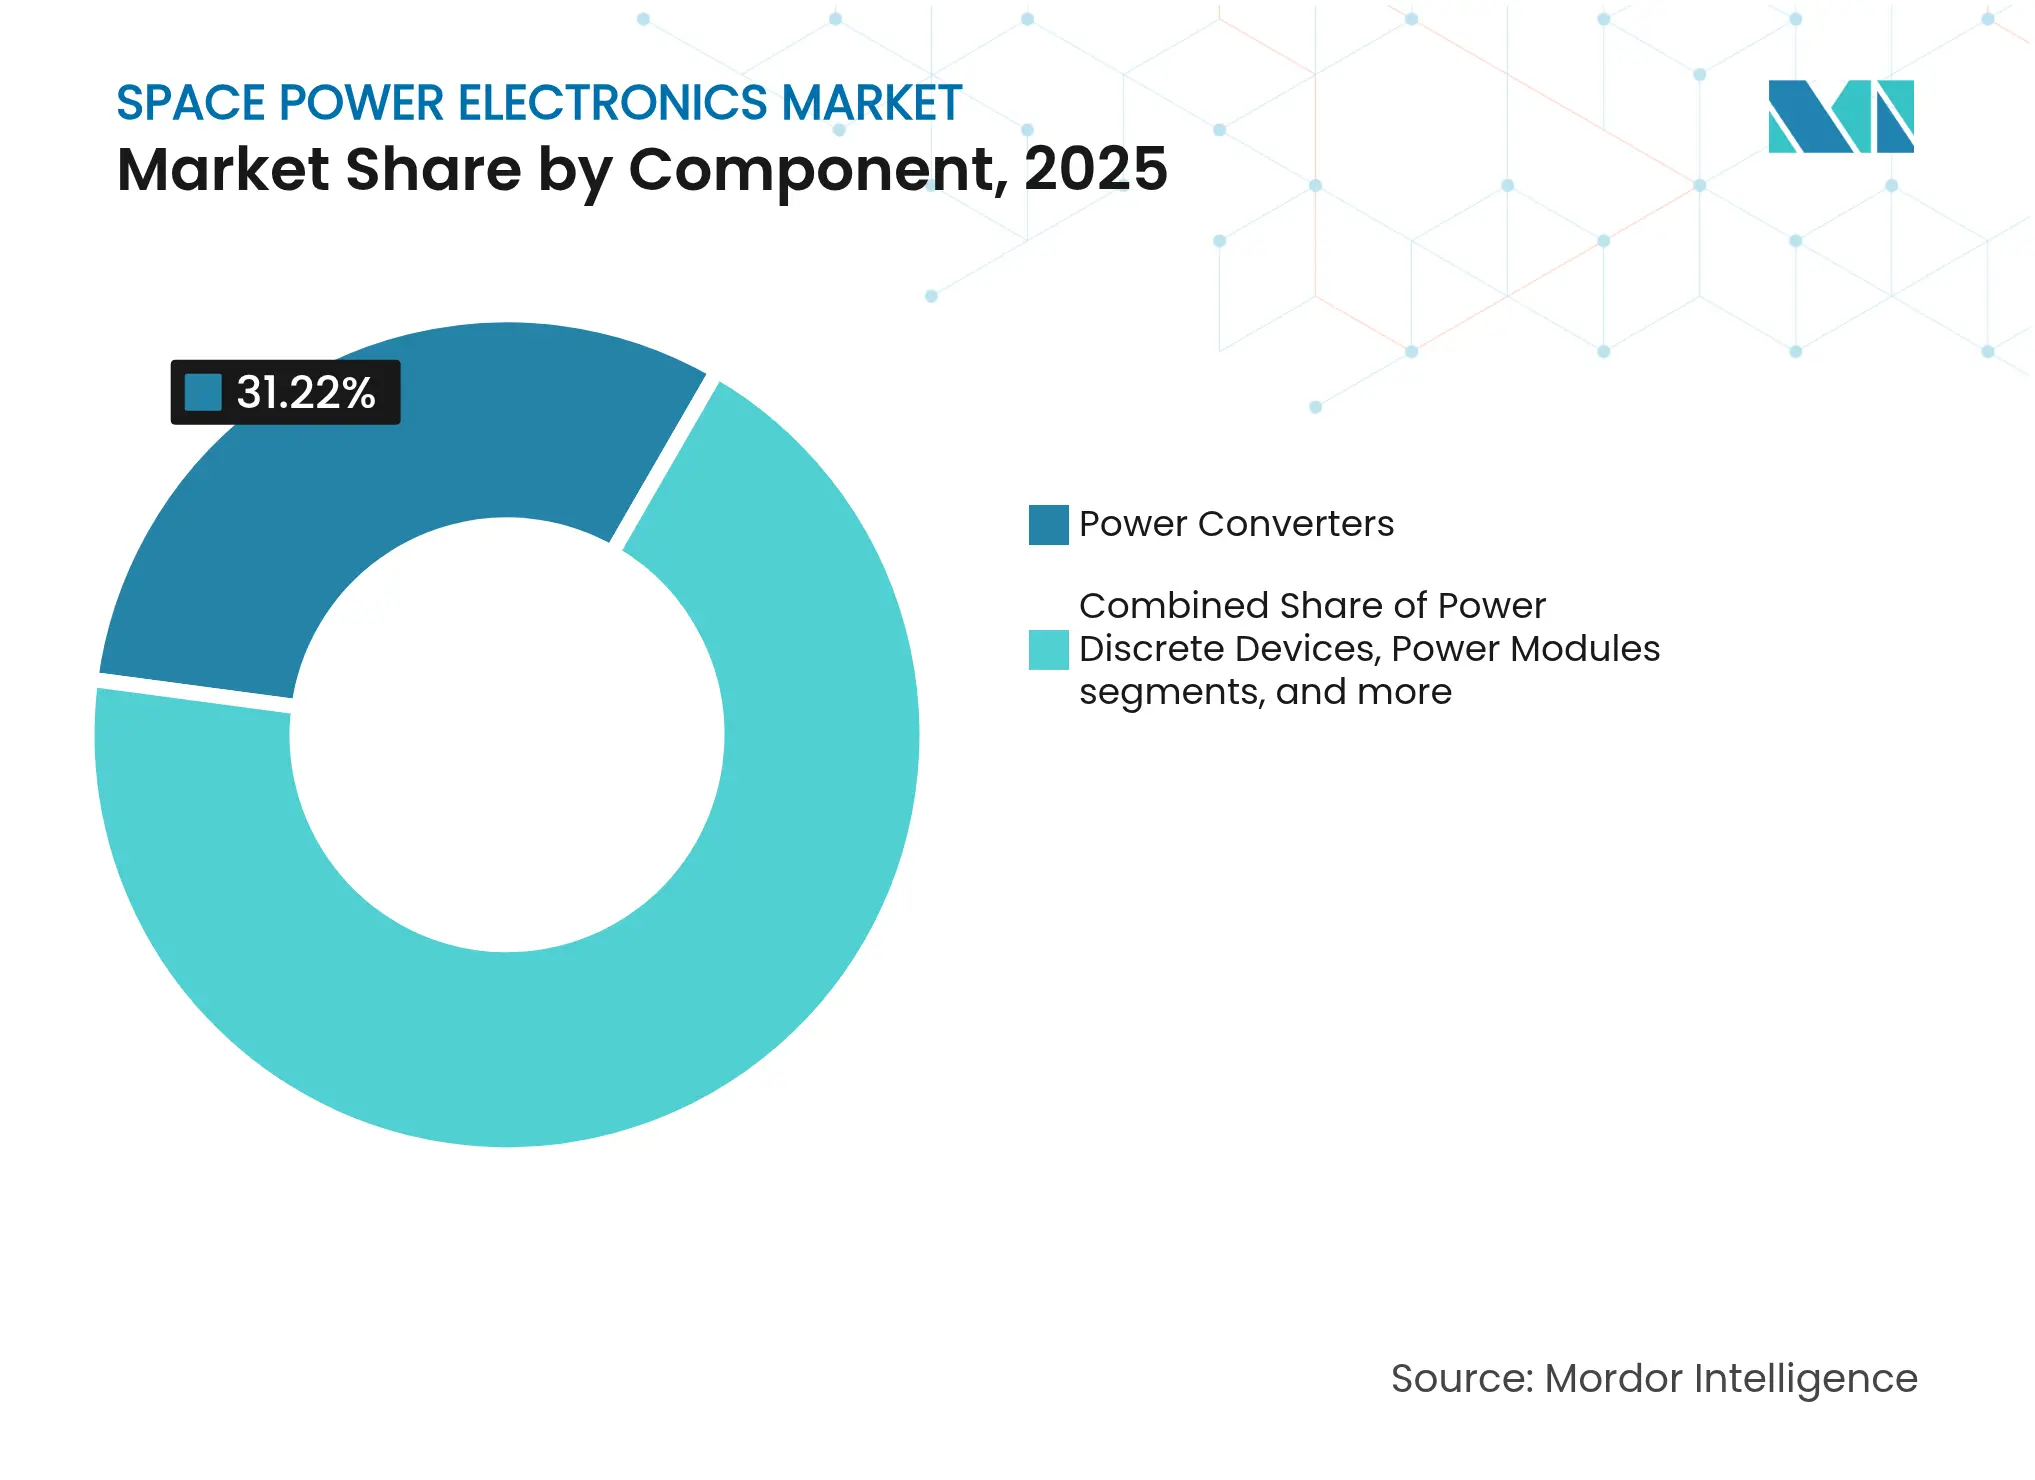
Power converters held the top position with 31.22% of the space power electronics market share in 2025, underscoring their central role in regulating energy from arrays and batteries under harsh orbital conditions. Though smaller in revenue, power modules are scaling at 18.74% CAGR as designers integrate control, switching, and thermal spreaders into single bricks that halve board area and boost mean time between failures. The shift dovetails with mission planners’ push toward factory-style spacecraft production, where common module footprints simplify assembly lines.
The emphasis on wide-bandgap switches accelerates module uptake because GaN and SiC junction temperatures can exceed 200 °C, allowing higher-density stacking without derating. Vicor’s radiation-tolerant modules illustrate this trend by delivering 104 W/in³ while withstanding 50 krad total-dose exposure. Filters and regulators remain essential to curb conducted noise, yet their value share is flat as larger functions collapse inside digital power-system-on-chip devices. Collectively, these dynamics keep the space power electronics market on a path toward functional consolidation that mirrors terrestrial server architectures.
Note: Segment shares of all individual segments available upon report purchase
By Voltage Range: High-Power Systems Accelerate
Platforms below 28 V retained 37.55% of the space power electronics market size in 2025 because legacy 28 V buses dominate LEO and GEO spacecraft. However, segments above 100 V are expanding fastest at 17.95% CAGR, fueled by electric propulsion stages and high-throughput payloads that demand kilowatt-class power delivered with minimal I²R losses. Constellation builders opt for 100–120 V primary buses so the same harness feeds thrusters, antennas, and processors without multiple intermediate converters.
Systems in the 28–50 V band remain relevant where military heritage and standardized connectors simplify cross-platform reuse. The 50–100 V niche grows steadily for synthetic-aperture radar (SAR) microsatellites that need moderate power with tighter efficiency targets. As GaN devices comfortable at 650 V line become standard, manufacturers are rethinking internal distribution to cut copper weight. This design pivot strengthens the long-term outlook for the space power electronics market.
By Platform: Deep-Space Missions Lead Growth
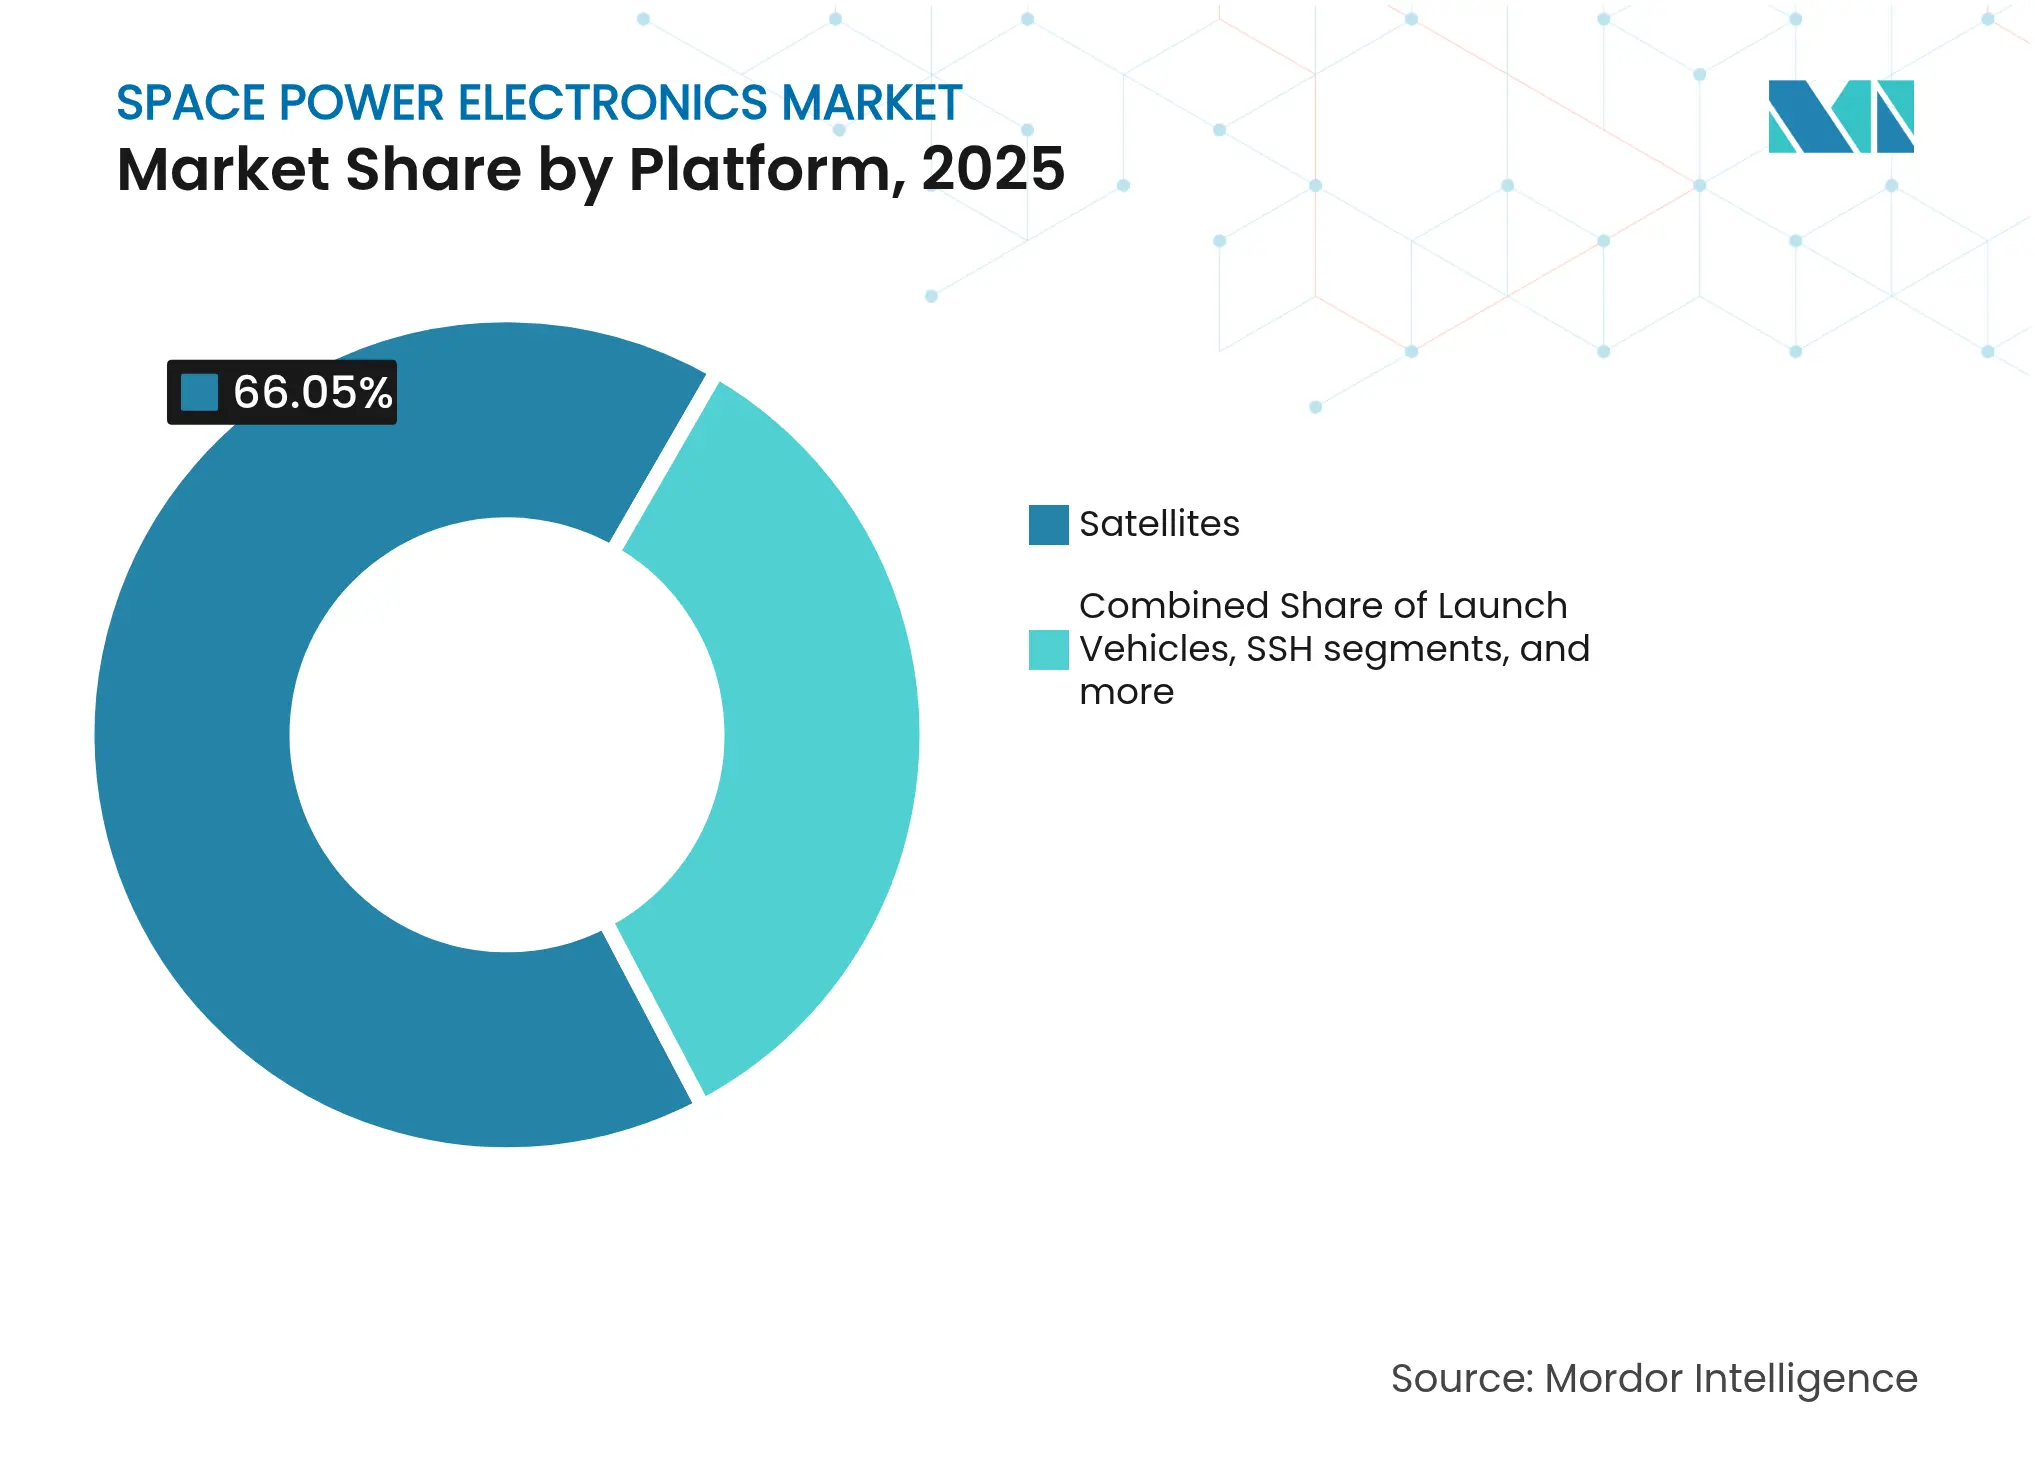
Satellites delivered 66.05% of 2025 revenue for the space power electronics market, spanning cube-class imagery birds to 20 kW GEO broadband craft. Yet deep-space probes and landers display the highest momentum with a 19.98% CAGR because Artemis, Mars Sample Return, and lunar base initiatives all require radiation-hardened converters able to operate through multi-year cruise and eclipse phases.
Launch vehicles account for a smaller share but are strategically important as reusable boosters impose new cycling stresses on avionics. Space-station and habitat projects—commercial LEO stations and planned lunar surface power plants—add another avenue for demand as life-support loads need redundant, human-safe power channels. Together, these platforms diversify revenue streams and reinforce the multi-segment strength of the space power electronics market.
Note: Segment shares of all individual segments available upon report purchase
By Application: In-Orbit Servicing Emerges
Communication satellites retained 41.50% of revenue in 2025, confirming that broadband constellations remain the primary engine for the space power electronics market. In-orbit servicing and debris-removal craft exhibit a 23.35% CAGR as insurers and regulators pressure operators to de-risk crowded orbits. These vehicles depend on precision power control for robotic arms, proximity sensors, and electric propulsion that execute fine-delta-V maneuvers.
Earth-observation continues to expand for climate analytics, while navigation and surveillance programs invest in jam-resilient payloads that need ultra-clean converter outputs. Government science missions—planetary probes and heliophysics observatories—drive requirements for ultra-stable power over decades-long timelines, pushing component makers to extend qualification protocols, a factor that ultimately deepens barriers to entry within the space power electronics market.
By End-User: Scientific Sector Accelerates
Commercial customers contributed 54.70% of 2025 sales as investment flowed into megaconstellations, on-demand launch services, and nascent space tourism. Military and civil government agencies remain anchor buyers for deep-space and secure-communications birds, but the scientific-academic community is the fastest mover at 18.92% CAGR. University-led CubeSat programs leverage low-cost launch rideshares to run experiments on power-point tracking, autonomous battery management, and thermal regulation, thereby priming demand for versatile, low-price COTS-plus components.
This broadening end-user base cushions revenue volatility and underscores why the space power electronics industry maintains resilience despite cyclical launch rates. Vendors that tailor part numbers to scientific grant budgets while keeping radiation tolerance intact will capture an incremental share as collaborative science missions rise.
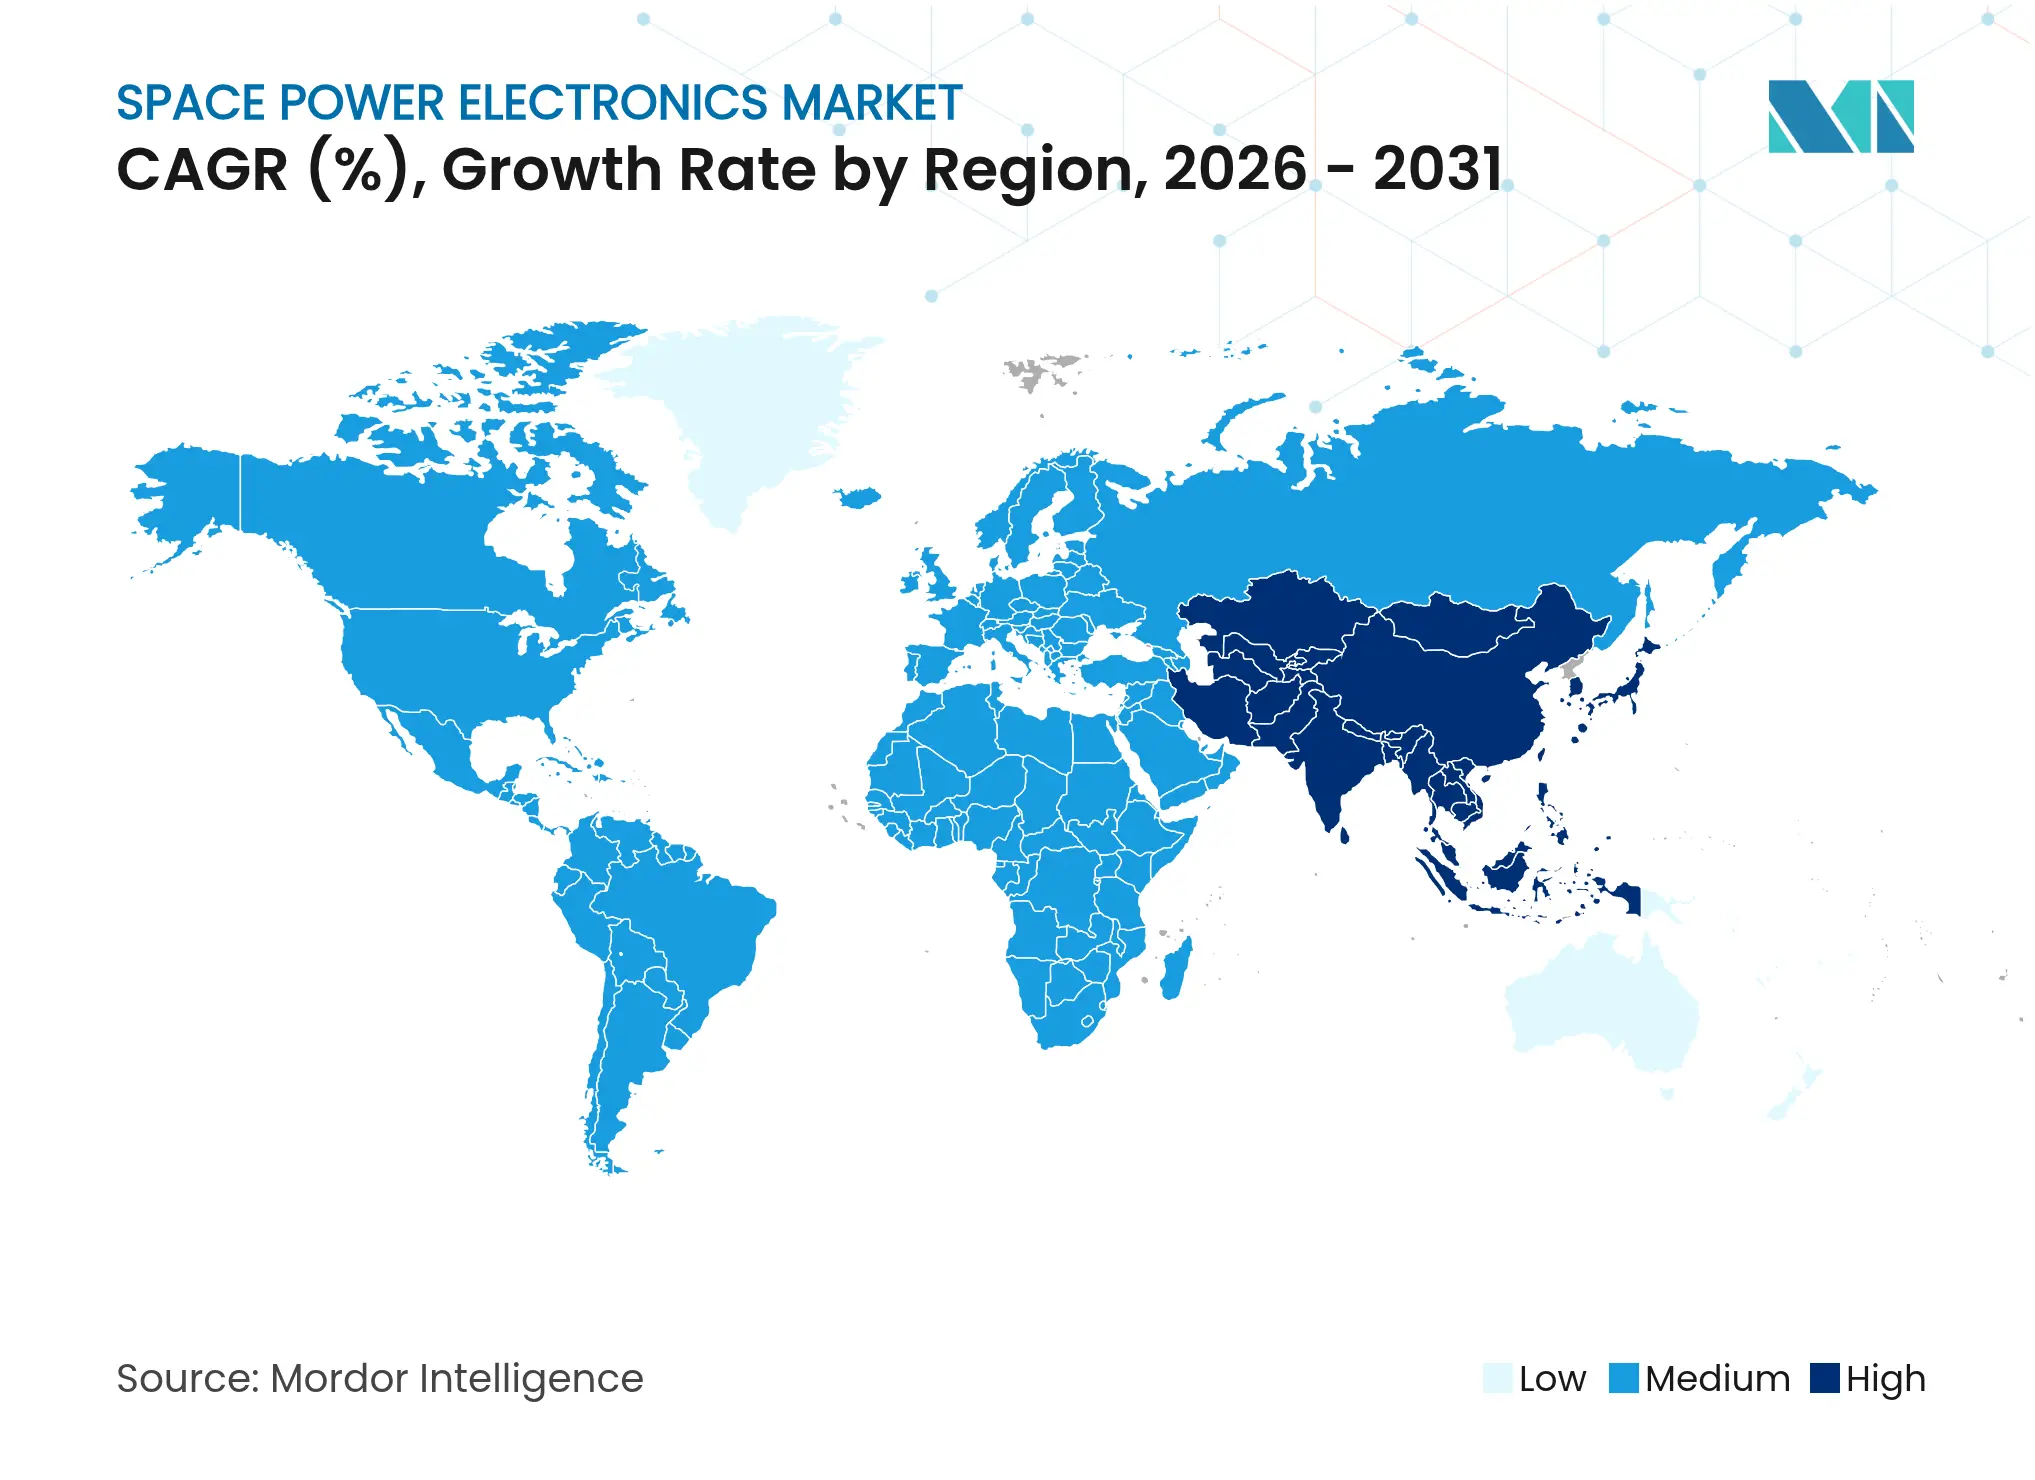
North America generated 36.40% of 2025 revenue thanks to NASA’s multibillion-dollar moon-to-Mars roadmap, Pentagon satellite-security upgrades, and a cluster of NewSpace firms clustered around California, Colorado, and Florida. Strong venture funding and CHIPS Act incentives boost the regional manufacturing footprint for GaN and SiC epi-wafers, increasing resilience against gallium supply shocks. Canada adds niche payload power expertise, while Mexico nurtures a small but growing satellite-assembly ecosystem anchored by university technology parks.
Asia-Pacific is the fastest-growing theatre, expanding at an 18.29% CAGR. China counts over 500 private space companies and invests heavily in low-Earth-orbit communications and lunar sample-return craft, spurring domestic demand for rad-hard converters. India’s cost-efficient missions and Japan’s robotics focus likewise lift regional uptake. South Korea and emerging ASEAN members join the supply chain via subsystem exports and small launchers, collectively solidifying Asia-Pacific as a focal point for the future space power electronics market.
Europe holds a strong position due to ESA’s technology programs, the European Component Initiative, and national investments in space-based solar-power demonstrators. Germany, France, and Italy host leading GaN MMIC fabs, while the United Kingdom concentrates on satellite assembly and in-orbit servicing. The SOLARIS study on gigawatt-class orbital power stations could unlock lengthy high-voltage converter runs unachievable on today’s spacecraft. Elsewhere, Brazil spearheads South American activity, and the Middle East accelerates as the UAE and Saudi Arabia each commit multi-billion-dollar budgets to space infrastructure, bolstering regional demand for flight-qualified power stages.
Market Concentration
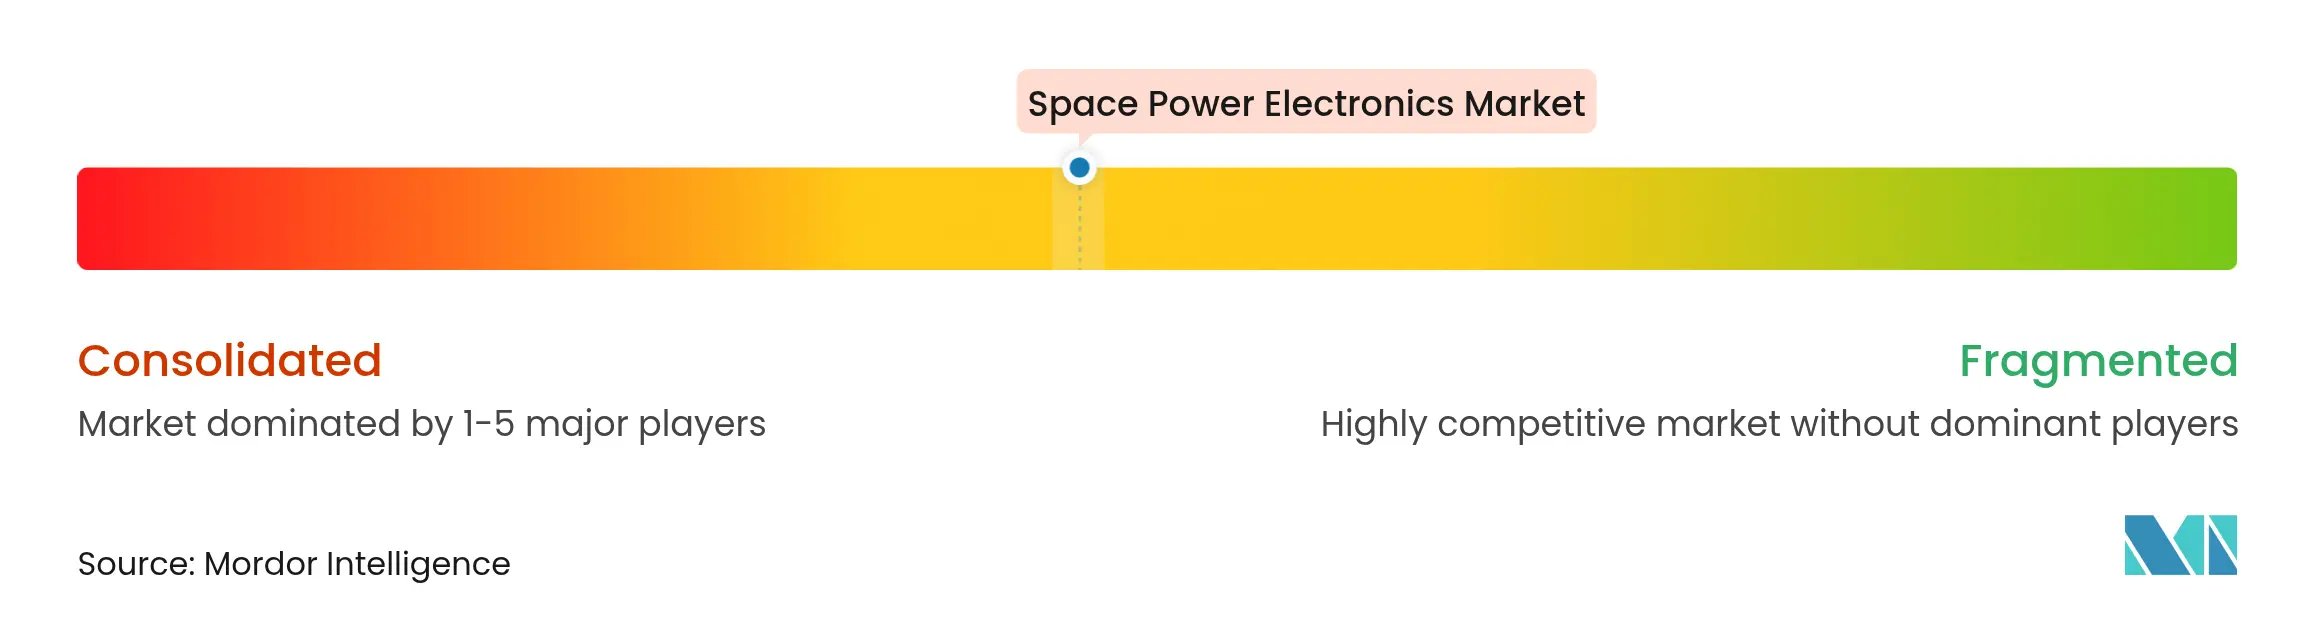
Competitive intensity is moderately consolidated. Many legacy aerospace suppliers—Microchip Technology, Texas Instruments, Honeywell, and STMicroelectronics—control broad catalogues of radiation-hardened voltage regulators, PWM controllers, and point-of-load converters. STMicroelectronics owns 32.6% of the global SiC device segment, giving it scale advantages in substrate sourcing.[4]Semiconductor Today, “ST Leads 2024 SiC Device Market,” semiconductor-today.com These incumbents pair heritage flight data with long-term procurement agreements, making displacement difficult.
Strategic differentiation centres on wide-bandgap integration. Honeywell’s USD 1.9 billion purchase of CAES broadens its rad-hard microelectronics offering. At the same time, onsemi acquired Qorvo’s Silicon Carbide Junction Field-Effect Transistor (SiC JFET) assets to bolster a discrete-to-module stack aimed at electric vehicles and spacecraft alike. Niche innovators such as Vicor target board-level architectures with Factorized Power solutions that cut distribution losses, winning sockets in high-throughput satellites. Government backing further influences rivalry: Teledyne’s USD 710 million Excelitas buy enhances optical power control, and BAE Systems plus Rocket Lab each secured CHIPS grants to scale US-based foundry capacity.
New entrants must clear high capital thresholds for radiation assessment, substrate purity, and hermetic packaging. Yet white-space prospects exist in in-orbit servicing vehicles, lunar surface microgrids, and space-based solar-power rectennas. Firms that bundle wide-bandgap switches with digital telemetry, fault isolation, and cyber-secure firmware are poised to carve niche positions as the space power electronics market expands beyond traditional satellite buses.

*Disclaimer: Major Players sorted in no particular order
1. INTRODUCTION
2. RESEARCH METHODOLOGY
3. EXECUTIVE SUMMARY
4. MARKET LANDSCAPE
5. MARKET SIZE AND GROWTH FORECASTS (VALUE)
6. COMPETITIVE LANDSCAPE
7. MARKET OPPORTUNITIES AND FUTURE OUTLOOK
Market Definitions and Key Coverage
Segmentation Overview
Detailed Research Methodology and Data Validation
Primary Research
Desk Research
Market-Sizing & Forecasting
Data Validation & Update Cycle
Why Mordor's Space Power Electronics Baseline Commands Reliability
Benchmark comparison
| Market Size | Anonymized source | Primary gap driver | ||
|---|---|---|---|---|
USD 351.56 million (2025) | Mordor Intelligence | - | Anonymized source:Mordor Intelligence | Primary gap driver:- |
USD 297.4 million (2023) | Regional Consultancy A | Excludes converters and regulators; relies mainly on customs codes | ||
USD 205 million (2021) | Global Consultancy B | Early base year, outdated ASPs, minimal private launch data | ||
USD 1.62 billion (2024) | Industry Journal C | Bundles solar arrays and battery packs with power electronics |
Feasibility Analysis for FBO Services in East Africa
3 Min Read
Strategic Expansion in the Russia Laundry Appliances Market
3 Min Read
When decisions matter, industry leaders turn to our analysts. Let’s talk.