Electric Propulsion Satellites Market Size and Share
Market Overview
| Study Period | 2019 - 2031 |
|---|---|
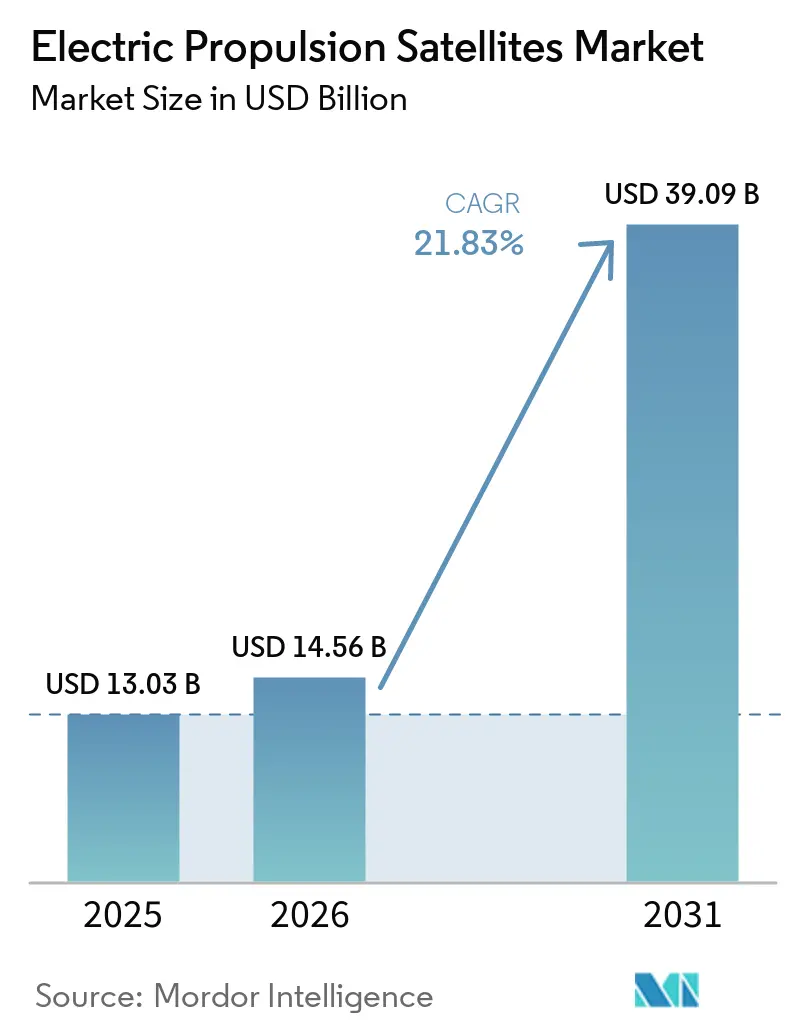
| Market Size (2026) | USD 14.56 Billion |
| Market Size (2031) | USD 39.09 Billion |
| Growth Rate (2026 - 2031) | 21.83% CAGR |
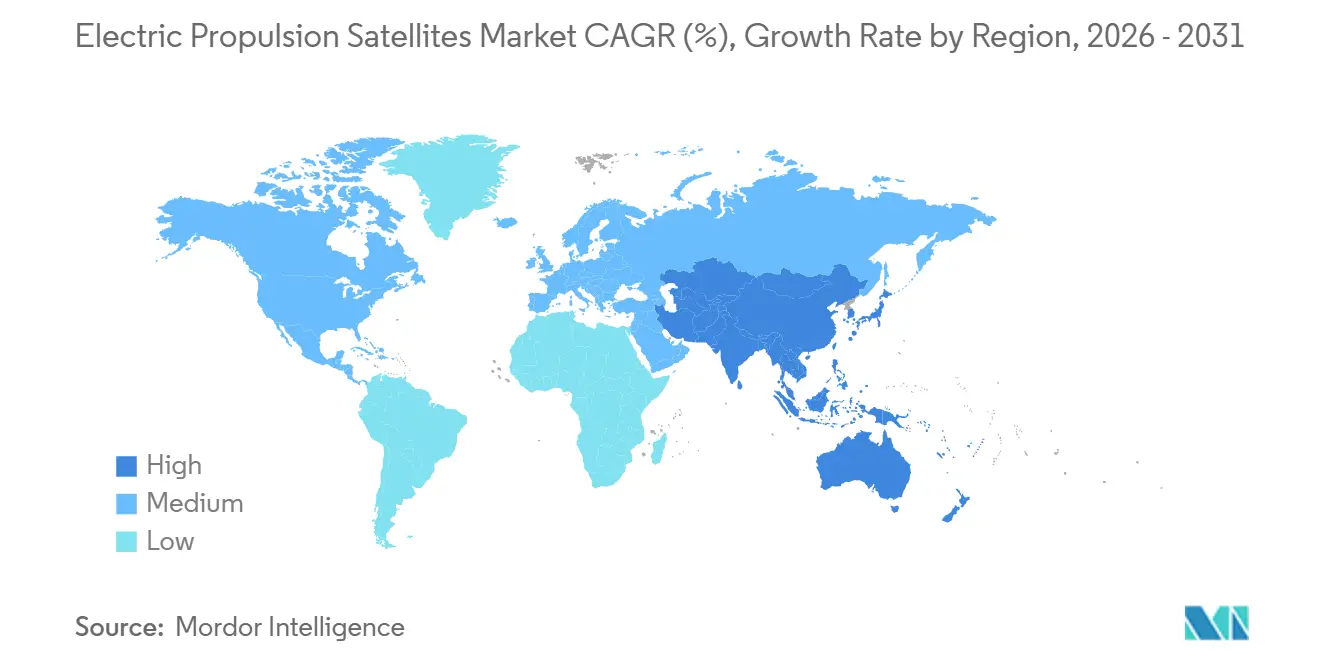
| Fastest Growing Market | Asia-Pacific |
| Largest Market | North America |
| Market Concentration | Medium |
Major Players *Disclaimer: Major Players sorted in no particular order Image © Mordor Intelligence. Reuse requires attribution under CC BY 4.0. | |
Electric Propulsion Satellites Market Analysis by Mordor Intelligence
The electric propulsion satellites market size was valued at USD 13.03 billion in 2025 and is projected to grow from USD 14.56 billion in 2026 to USD 39.09 billion by 2031, at a CAGR of 21.83% during 2026 to 2031. The global market for electric propulsion satellites is growing due to advancements in propulsion technology and the transition from specialized subsystems to more integrated design features in commercial and government satellite projects. This shift is largely driven by the rise of large satellite constellations, which require dependable solutions for orbit raising, station-keeping, maneuvering, collision avoidance, and end-of-life disposal. The growing adoption of high-volume manufacturing methods is moving demand away from the traditional aerospace low-volume, customized approach toward mass production. For instance, SpaceX's Starlink satellites are projected to exceed 10,000 units by 2026. Similarly, Amazon's Project Kuiper deployed over 200 satellites by early 2026.
The electric propulsion satellites market benefits from economic advantages, including reduced spacecraft mass that enhances launch efficiency and lowers the cost of placing usable payloads into orbit. Additionally, regulations addressing orbital debris management and satellite disposal are driving demand for maneuverable propulsion systems capable of performing deorbit operations and expanding opportunities for low- and medium-power propulsion systems, while also emphasizing the importance of flight heritage and successful qualification processes among suppliers.
Key Report Takeaways
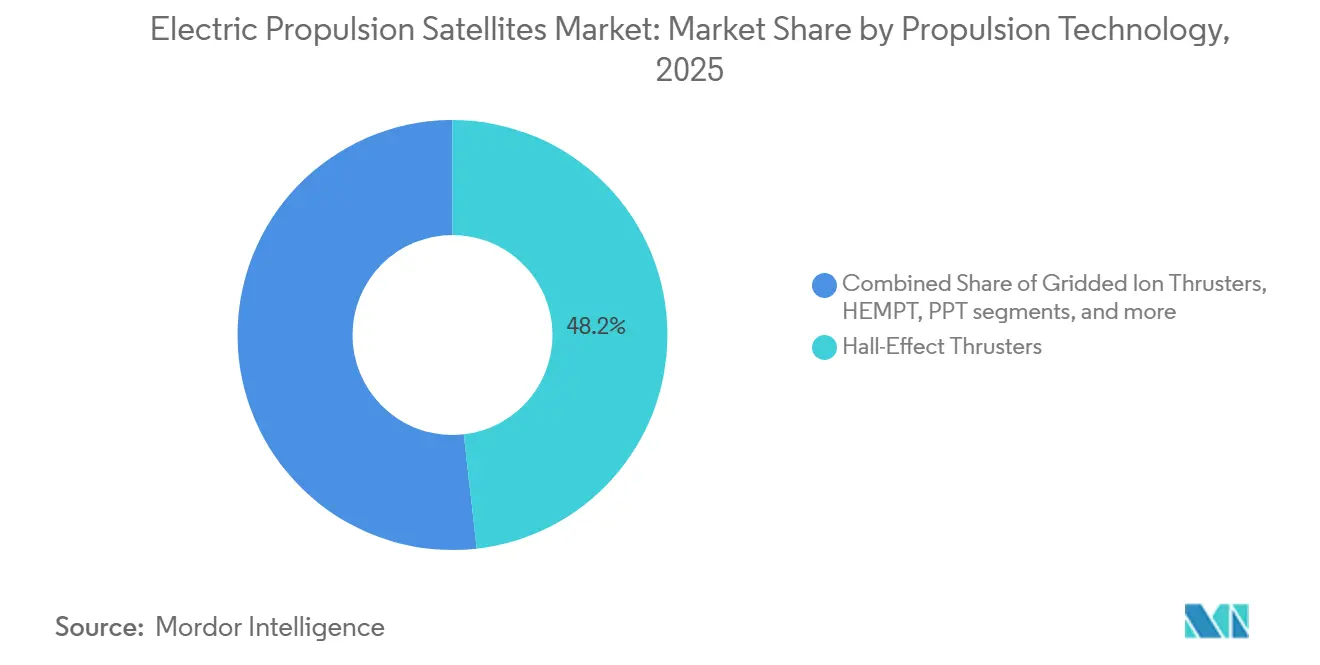
- By propulsion technology, Hall-effect thrusters accounted for 48.20% of revenue in 2025, while HEMPT is forecast to expand at a 22.71% CAGR through 2031.
- By satellite mass, medium satellites (weighing 500 kg to less than 2,000 kg) accounted for 52.45% of revenue in 2025, while small satellites (under 500 kg) are projected to grow at a 22.83% CAGR through 2031.
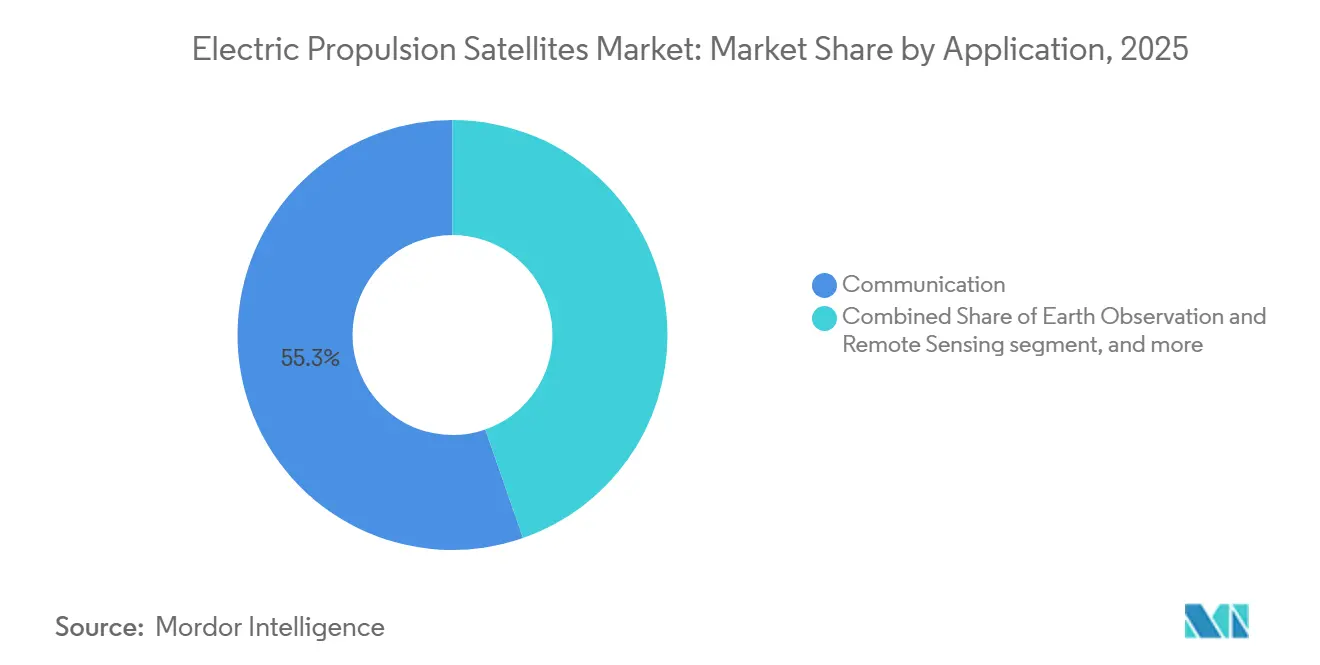
- By application, communication accounted for 55.32% of the electric propulsion satellites market size in 2025, while earth observation and remote sensing are forecast to expand at 23.91% CAGR through 2031.
- By end user, the commercial segment held 55.12% of the electric propulsion satellites market share in 2025 and is projected to grow at a 24.52% CAGR through 2031.
- By geography, North America held 53.77% of the electric propulsion satellites market share in 2025, while Asia-Pacific is forecast to grow at 24.63% CAGR through 2031.
Note: Market size and forecast figures in this report are generated using Mordor Intelligence’s proprietary estimation framework, updated with the latest available data and insights as of January 2026.
Global Electric Propulsion Satellites Market Trends and Insights
Drivers Impact Analysis*
| RIVER | (~) % IMPACT ON CAGR FORECAST | GEOGRAPHIC RELEVANCE | IMPACT TIMELINE |
|---|---|---|---|
| Rapid growth of LEO broadband mega-constellations | 5.20% | Global, with highest throughput in North America and emerging Asia-Pacific constellation builds | Short term (≤ 2 years) |
| Rising demand for high-throughput data services | 4.10% | Global, with Asia-Pacific and Sub-Saharan Africa showing the strongest new subscriber demand | Short term (≤ 2 years) |
| Launch cost savings via lighter all-electric satellites | 3.80% | Global, most pronounced on Falcon 9 and Ariane 6 rideshare economics | Medium term (2-4 years) |
| Government deep-space exploration initiatives | 2.90% | North America, Europe, and Asia-Pacific | Long term (≥ 4 years) |
| Adoption of iodine and krypton propellants | 2.30% | Global, with Europe leading HEMPT and krypton work, and North America and China advancing iodine | Medium term (2-4 years) |
| Electric propulsion-enabled on-orbit servicing and debris removal | 1.80% | Global, with early commercial activity in LEO and GEO | Medium term (2-4 years) |
| Source: Mordor Intelligence | |||


Rapid Growth of LEO Broadband Mega-constellations
The rapid expansion of low Earth orbit (LEO) broadband mega-constellations is a significant driver for the electric propulsion satellites market. Large constellation operators increasingly rely on efficient propulsion technologies to support high-volume satellite deployment and long-term fleet management. SpaceX and Amazon have both moved their constellations into a deployment phase where propulsion demand is tied to repeat launch cadence and fleet replenishment rather than one-time spacecraft procurement.[1]Amazon Staff, “Amazon Leo Set to Accelerate Satellite Production,” Amazon News, aboutamazon.com The primary demand driver is the simultaneous deployment of multiple competing broadband constellations, each requiring hundreds of satellites equipped with electric propulsion systems. Electric propulsion systems facilitate orbit raising, station keeping, collision avoidance, and controlled end-of-life disposal while reducing spacecraft mass and enhancing payload efficiency. As operators expand global broadband networks through multi-satellite architectures, the focus is shifting from limited satellite production to industrial-scale deployment models. This shift is driving increased adoption of electric propulsion solutions due to their operational efficiency, lower launch costs, and suitability for constellation-based missions.
Launch Cost Savings via Lighter All-electric Satellites
The electric propulsion satellites market is also benefiting from all-electric and hybrid-electric spacecraft designs that reduce the propellant mass needed on board and free more of the satellite for payload and mission hardware. The HEMPT-NG project noted that all electric satellites can save up to 80% of propellant mass compared to chemical alternatives, strengthening the business case for electric systems beyond simple launch price comparisons.[2]HEMPT-NG Project, “HEMPT-NG Highly Efficient Multistage Plasma Thruster – Next Generation,” HEMPT-NG, hempt-ng.eu SpaceX’s reporting on a lighter V2 Mini configuration shows how iterative mass reduction can directly improve spacecraft packing per launch, which further reinforces the value of electric architecture at scale.[3]Starlink, “Progress 2024,” SpaceX, starlink.com Hence, buyers increasingly treat propulsion choice as a core financial decision in the electric propulsion satellites market rather than merely an engineering trade-off.
Rising Demand for High-throughput Data Services
The growing demand for high-speed data services is driving the electric-propulsion satellites market. This demand is linked to the expansion of satellite owners' capacities to provide increased bandwidth for broadband, cloud services, video streaming, mobility solutions, and other communication network requirements. The need for faster data delivery and broader network coverage supports the adoption of satellite technology designed for greater efficiency and extended operational lifetimes. Electric propulsion satellites offer advantages such as reduced overall satellite mass, improved payload placement, and precise orbital control.
Government Deep-space Exploration Initiatives
The initiation of government-led deep-space exploration programs has been identified as a significant factor driving the market for electric propulsion satellites. National space agencies and government-funded projects have made significant advances and investments in deep-space exploration, including lunar missions, planetary exploration, and space operations. Electric propulsion engines are notably more fuel-efficient than chemical propulsion engines, making them well-suited for extended operations and deep-space maneuvers where optimizing propellant use is critical. These engines are effectively utilized for orbit maintenance, insertion, station keeping, and deep-space trajectory corrections. As efforts to develop lunar infrastructure and conduct missions to Mars and asteroids increase, alongside expanded deep space research, the demand for efficient propulsion technologies has grown. Electric propulsion engines are expected to gain further prominence in the coming years due to their operational advantages.
Restraints Impact Analysis*
| RESTRAINT | (~) % IMPACT ON CAGR FORECAST | GEOGRAPHIC RELEVANCE | IMPACT TIMELINE |
|---|---|---|---|
| Space-debris-driven licensing hurdles | -1.20% | Global, with the FCC the most active national regulator and the ITU framework shaping international access | Short term (≤ 2 years) |
| Xenon supply constraints and price volatility | -1.10% | Global, with Europe and North America more exposed to supply disruption | Medium term (2-4 years) |
| High development cost of electric propulsion subsystems | -0.90% | Global, with the sharpest burden on new entrants and small satellite operators | Long term (≥ 4 years) |
| Insurance qualification hurdles for new electric propulsion technology | -0.70% | Global, especially restrictive for novel thrusters and alternative propellant systems | Medium term (2-4 years) |
| Source: Mordor Intelligence | |||
Space-debris Driven Licensing Hurdles
Stringent debris compliance rules are constraining the electric propulsion satellites market, as operators must now demonstrate disposal capability and propulsion reliability earlier in the licensing process. The FCC’s five-year post-mission disposal rule for new LEO satellite licenses became effective in September 2024, which turned propulsion from a performance enhancer into a compliance-relevant subsystem for many missions.[4]Federal Communications Commission, “FAQ: Orbital Debris,” Federal Communications Commission, fcc.gov In the electric propulsion satellites market, that rule tends to favor established suppliers, because qualification campaigns, endurance testing, and insurer review are expensive and time-consuming for new entrants with limited flight heritage. Smaller operators and newer thruster developers therefore face a harder path to commercial acceptance, even when their technology offers real cost or mass advantages. The electric propulsion satellites market still benefits in the long run because compliance increases the need for onboard propulsion, but the near-term effect is a more selective procurement environment. Standards such as ISO 24113 and ISO 26872 reinforce this direction by raising the minimum expectation for debris mitigation performance and spacecraft operations discipline.
High Development Cost of EP Subsystems
The high costs associated with the development process of electric propulsion systems pose a significant challenge to the growth of the electric propulsion satellites market. Developing electric propulsion systems requires substantial investments in engineering and testing to ensure their functionality under harsh space conditions. The expenses incurred during environmental testing, qualification, and validation processes further increase the overall development costs. For small satellite manufacturers, emerging space companies, and other cost-sensitive organizations, adopting this technology can be challenging despite its numerous benefits. Additionally, the limited flight heritage of newer electric propulsion systems and satellite operators' preference for established systems may act as significant barriers to market growth.
*Our forecasts treat driver/restraint impacts as directional, not additive. The impact forecasts reflect baseline growth, mix effects, and variable interactions.
Segment Analysis
By Propulsion Technology: HEMPT's Erosion-Free Design Challenges Hall-Effect Dominance
Hall-effect thrusters led this segment with 48.20% of revenue in 2025, which kept them at the center of the electric propulsion satellites market across commercial and government programs. Their position reflects a long record in GEO communications, scientific missions, and large-scale constellation use, where buyers value a balance of thrust density, specific impulse, and manageable production scale. In the electric propulsion satellites market, that combination keeps Hall systems attractive for satellite classes that need practical maneuvering capability without moving into the highest-complexity range. Gridded ion thrusters still play an important role in missions where very high specific impulse and mission endurance justify the added subsystem complexity. HEMPT is the fastest-growing propulsion type in this segment, with the electric propulsion satellites market for HEMPT projected to expand at a 22.71% CAGR through 2031. Thales and the European Commission have both highlighted HEMPT’s core advantages, especially erosion-free plasma confinement and the ability to operate with xenon, krypton, and argon without redesign, which directly addresses lifetime and supply concerns. In the electric propulsion satellites industry, multi-propellant flexibility matters because customers want fewer design changes when they shift fuel strategy across mission sets.


By Satellite Mass: Small Satellite Growth Pressures Propulsion Supply Chains
Medium-weight satellites (500 kg to less than 2,000 kg) accounted for 52.45% of revenue in 2025, making them the largest mass class in the electric propulsion satellites market, reflecting the continued relevance of GEO communications buses and medium LEO platforms, both of which still generate meaningful propulsion demand because they combine long operating lives with more capable mission profiles. In the electric propulsion satellites market, medium-class platforms also benefit from the widest pool of qualified propulsion options, especially Hall systems that already support orbit raising, station keeping, and life extension.
Small satellites are the fastest-growing mass class, with the electric propulsion satellites market for this category projected to grow at a 22.83% CAGR from 2026 to 2031. The main driver is the continued spread of broadband, earth observation, and defense-related constellations, where fleet counts are rising quickly, and propulsion systems must meet strict mass, power, and volume limits. In the electric propulsion satellites market, this changes supplier requirements because many heritage systems were designed for larger buses and do not translate cleanly into compact platforms.
By Application: Earth Observation Manoeuvring Requirements Differentiates the Next Growth Phase
Communication remained the largest application in 2025, accounting for 55.32% of revenue, making it the demand anchor of the electric propulsion satellites market. That share reflects the scale of broadband infrastructure programs and the long operating lives of GEO communications satellites, both of which require regular orbit control and station-keeping over many years. In the electric propulsion satellites market, communication missions also create a large base of recurring demand, as constellation replenishment requires repeat orders even when propulsion specifications are relatively standardized. Earth observation and remote sensing is the fastest-growing application, with the electric propulsion satellites market for this application projected to grow at a 23.91% CAGR through 2031. The reason is that newer earth observation architectures, especially hyperspectral, SAR, and very low Earth orbit (VLEO) systems, impose greater active maneuvering demands than many legacy imaging missions. In the electric propulsion satellites market, VLEO spacecraft must continuously counter atmospheric drag, making propulsion central to operating economics rather than a secondary subsystem.
By End User: Commercial Dominance Masks a Structural Shift Toward National Security Demand
Commercial held 55.12% of revenue in 2025 and is forecast to grow at a 24.52% CAGR through 2031, making it both the largest and fastest-expanding end-user group in the electric propulsion satellites market, reflecting the move from low-frequency spacecraft orders to factory-style procurement, where constellation operators need repeated deliveries of near-identical thrusters across many missions and replenishment cycles. In the electric propulsion satellites market, commercial buyers are therefore placing greater emphasis on domestic supply, manufacturing consistency, and schedule confidence than on marginal performance gains alone.
Government and defense accounted for the remaining 44.88% of 2025 revenue, but their role in the electric propulsion satellites market is much larger than their market share would suggest. National security and civil space programs set some of the most stringent qualification standards, including very long operational life, high power-handling capability, and strong radiation tolerance. NASA’s Gateway propulsion work and wider sovereign space efforts in the US, Europe, China, India, and Japan are keeping the electric propulsion satellites market focused on endurance, standard testing, and mission assurance.
Geography Analysis
Electric Propulsion Satellites Market in Rest of World
North America held 53.77% of the global electric propulsion satellites market in 2025, making it the leading regional center for both demand and propulsion subsystem production. The region benefits from the concentration of major constellation operators, a dense base of spacecraft manufacturers, and steady procurement from NASA, the Space Development Agency, and the US Space Force. The US remains the core national market in the region because Starlink deployment alone creates significant recurring demand for in-house propulsion capability, fleet replenishment, and related power-processing hardware. The electric propulsion satellites market in North America is also shaped by stronger domestic supply preferences, especially where government procurement prioritizes local manufacturing and documented heritage. Safran’s Colorado production move shows how suppliers are responding to that demand by building US manufacturing capacity closer to end customers in the small satellite segment.
Europe remained the second-largest region in the electric propulsion satellites market, supported by a long-standing industrial base across propulsion, satellite manufacturing, and public research funding. The region’s position is reinforced by companies such as Thales Alenia Space, Safran, OHB, and ArianeGroup, as well as European Commission-backed programs that continue to support next-generation propulsion work. CORDIS-backed projects such as HEMPT-NG and related development programs have helped keep Europe competitive in propellant-flexible, lifetime-oriented electric propulsion designs. South America is still a small contributor to the electric propulsion satellites market. Still, its long-term position is improving as lower launch costs and broader connectivity needs make smaller satellite programs more practical.
Asia-Pacific is the fastest-growing region, with the electric propulsion satellites market in this geography expected to expand at a 24.63% CAGR through 2031. China is a major driver because state-directed commercial constellations and domestic propulsion development are advancing in tandem, providing local thruster suppliers a path from research to repeat deployment. India is also strengthening regional momentum through ISRO’s propulsion capabilities and a broader domestic push for space manufacturing. Japan adds another important dimension to the electric propulsion satellites market through ETS-9, where JAXA has highlighted the role of long-life Hall thruster capability in building domestic commercial relevance. The Middle East and Africa remain an emerging geography in the electric propulsion satellites market, with demand likely to come mainly from satellite procurement by established primes rather than from local propulsion manufacturing in the near term.

Competitive Landscape
The electric propulsion satellites market is moderately fragmented, with large aerospace primes, specialized propulsion firms, and vertically integrated satellite manufacturers competing for position. Heritage still matters because flight qualification, insurer comfort, and customer trust are hard to replace in mission-critical spacecraft subsystems. At the same time, the electric propulsion satellites market is no longer defined solely by historical incumbents, as specialist suppliers now compete on lead time, production scale, and fuel flexibility as much as on technical specifications. This has created a two-layer field in which legacy firms retain credibility advantages while newer companies pursue faster output, smaller form factors, and lower-cost architectures. The electric propulsion satellites market, therefore, rewards both proven reliability and operational responsiveness, which is why competition remains active across several tiers rather than consolidating around a single leader.
The recent strategy has been shaped by product launches, manufacturing localization, and moves toward tighter supply chain control. Rocket Lab introduced the Gauss Hall thruster in April 2026, featuring heaterless cathode technology, magnetic shielding, and a production target of more than 200 units per year, clearly aimed at high-volume constellation demand. Safran’s US manufacturing expansion is another clear example, because it aligns propulsion output with North American customer preferences for local sourcing and faster delivery. Enpulsion’s Nexus platform also shows how smaller, focused players are trying to secure space in the electric propulsion satellites market by targeting compact spacecraft that need tank-free solid propellant solutions.
White space in the electric propulsion satellites market is most visible where customers want both high-volume output and genuine freedom from xenon dependence, because few suppliers yet meet both conditions at scale. This is why product development is converging on lifetime, power-processing efficiency, and broader propellant compatibility rather than on thrust alone. HEMPT-related work in Europe and iodine-related programs from several developers show that the electric propulsion satellites market is actively seeking architectures that reduce erosion, ease storage, or lower fuel exposure without creating a new qualification burden. Compliance also shapes competition, as FCC disposal rules and broader international coordination requirements raise the commercial value of documented heritage and reliable testing. The electric propulsion satellites market is therefore competitive. However, it still gives companies an edge that combines qualification depth, production credibility, and a fuel strategy aligned with the next generation of constellation economics.
Electric Propulsion Satellites Industry Leaders
Airbus SE
Northrop Grumman Corporation
Safran SA
Thales Alenia Space
The Boeing Company
- *Disclaimer: Major Players sorted in no particular order

Recent Industry Developments
- May 2026: NASA completed testing of a lithium-fed magnetoplasmadynamic (MPD) ion engine operating at approximately 120 kW, significantly exceeding the power capability of existing spacecraft ion propulsion systems. The development is intended to support future deep-space exploration and long-duration missions requiring higher propulsion efficiency.
- May 2026: Vast introduced a new family of high-power satellite buses intended for communication, Earth observation, national security, and orbital data center applications. The platforms integrate advanced spacecraft technologies, including propulsion systems, and support increasing demand for high-capability satellite architectures.
- June 2025: Astroscale's ELSA-M spacecraft completed its Critical Design Review, confirming readiness for the world's first commercial end-of-life satellite removal service designed to capture multiple prepared satellites in LEO.
- May 2025: Enpulsion introduced Nexus, its next-generation electric propulsion platform designed for spacecraft up to 500 kg. The system offers increased thrust capability and improved orbit-raising performance to address expanding small satellite and constellation deployment requirements.
- September 2024: Starfish Space received a USD 15 million Phase III SBIR contract from NASA for its SSPICY mission, in which the Otter spacecraft, using electric propulsion, will inspect multiple defunct US satellites in LEO, with launch targeted for late 2026.


Global Electric Propulsion Satellites Market Report Scope
The electric propulsion satellites market comprises satellites equipped with electric propulsion systems that utilize electric power to generate thrust. These systems are used for functions such as orbit raising, station keeping, attitude control, collision avoidance, and end-of-life satellite disposal. The analysis covers operational and commercially deployed electric propulsion technologies and related satellite programs. The study excludes satellites relying solely on chemical propulsion systems, sounding rockets, high-altitude platforms, launch vehicle propulsion systems, and experimental propulsion technologies without operational deployment.
The electric propulsion satellites market is segmented by propulsion technology, satellite mass, application, and end user. By propulsion technology, the market includes Hall-effect thrusters, gridded ion thrusters, high-efficiency multi-stage plasma (HEMPT) thrusters, pulsed plasma thrusters (PPT), and other propulsion technologies. Based on satellite mass, the market is categorized into small satellites (less than 500 kg), medium satellites (500 kg to less than 2,000 kg), and large satellites (more than 2,000 kg). Based on application, the market covers communication, Earth observation and remote sensing, navigation and positioning, science and exploration, and technology demonstration missions. By end user, the market is divided into commercial and government and defense sectors. The report also covers market sizes and forecasts for the electric propulsion satellites market in major countries worldwide. For each segment, the market size is provided in terms of value (USD).
| Hall-Effect Thrusters |
| Gridded Ion Thrusters |
| High-Efficiency Multi-Stage Plasma Thrusters (HEMPT) |
| Pulsed Plasma Thrusters (PPT) |
| Others |
| Small (Less than 500 kg) |
| Medium (500 kg to Less than 2,000 kg) |
| Large (More than 2,000 kg) |
| Communication |
| Earth Observation and Remote Sensing |
| Navigation and PNT |
| Science and Exploration |
| Technology Demonstration |
| Commercial |
| Government and Defense |
| North America | United States | |
| Canada | ||
| Mexico | ||
| Europe | United Kingdom | |
| France | ||
| Germany | ||
| Italy | ||
| Russia | ||
| Rest of Europe | ||
| Asia-Pacific | China | |
| India | ||
| Japan | ||
| South Korea | ||
| Australia | ||
| Rest of Asia-Pacific | ||
| South America | Brazil | |
| Argentina | ||
| Rest of South America | ||
| Middle East and Africa | Middle East | Saudi Arabia |
| United Arab Emirates | ||
| Turkey | ||
| Rest of Middle East | ||
| Africa | South Africa | |
| Nigeria | ||
| Rest of Africa | ||
| By Propulsion Technology | Hall-Effect Thrusters | ||
| Gridded Ion Thrusters | |||
| High-Efficiency Multi-Stage Plasma Thrusters (HEMPT) | |||
| Pulsed Plasma Thrusters (PPT) | |||
| Others | |||
| By Satellite Mass | Small (Less than 500 kg) | ||
| Medium (500 kg to Less than 2,000 kg) | |||
| Large (More than 2,000 kg) | |||
| By Application | Communication | ||
| Earth Observation and Remote Sensing | |||
| Navigation and PNT | |||
| Science and Exploration | |||
| Technology Demonstration | |||
| By End User | Commercial | ||
| Government and Defense | |||
| By Geography | North America | United States | |
| Canada | |||
| Mexico | |||
| Europe | United Kingdom | ||
| France | |||
| Germany | |||
| Italy | |||
| Russia | |||
| Rest of Europe | |||
| Asia-Pacific | China | ||
| India | |||
| Japan | |||
| South Korea | |||
| Australia | |||
| Rest of Asia-Pacific | |||
| South America | Brazil | ||
| Argentina | |||
| Rest of South America | |||
| Middle East and Africa | Middle East | Saudi Arabia | |
| United Arab Emirates | |||
| Turkey | |||
| Rest of Middle East | |||
| Africa | South Africa | ||
| Nigeria | |||
| Rest of Africa | |||


Market Definition
- FULL-SERVICE RESTAURANTS - A foodservice establishment where customers are seated at a table, give their order to a server and are served food at a table.
- QUICK SERVICE RESTAURANTS - A foodservice establishment that provides customers convenience, speed, and food offerings at lower prices. Customers usually help themselves and carry their own food to their tables.
- CAFES & BARS - A type of foodservice business that include bars and pubs that are licensed to serve alcoholic drinks for consumption, cafes that serve refreshments and light food items, as well as specialty tea and coffee shops, dessert bars, smoothie bars, and juice bars.
- CLOUD KITCHEN - A foodservice business that utilizes a commercial kitchen for the purpose of preparing food for delivery or takeout only, with no dine-in customers.
| Keyword | Definition |
|---|---|
| Attitude Control | The orientation of the satellite relative to the Earth and the sun. |
| INTELSAT | The International Telecommunications Satellite Organization operates a network of satellites for international transmission. |
| Geostationary Earth Orbit (GEO) | Geostationary satellites in Earth orbit 35,786 km (22,282 mi) above the equator in the same direction and at the same speed as the earth rotates on its axis, making them appear fixed in the sky. |
| Low Earth Orbit (LEO) | Low Earth Orbit satellites orbit from 160-2000km above the earth, take approximately 1.5 hours for a full orbit and only cover a portion of the earth’s surface. |
| Medium Earth Orbit (MEO) | MEO satellites are located above LEO and below GEO satellites and typically travel in an elliptical orbit over the North and South Pole or in an equatorial orbit. |
| Very Small Aperture Terminal (VSAT) | Very Small Aperture Terminal is an antenna that is typically less than 3 meters in diameter |
| CubeSat | CubeSat is a class of miniature satellites based on a form factor consisting of 10 cm cubes. CubeSats weigh no more than 2 kg per unit and typically use commercially available components for their construction and electronics. |
| Small Satellite Launch Vehicles (SSLVs) | Small Satellite Launch Vehicle (SSLV) is a three-stage Launch Vehicle configured with three Solid Propulsion Stages and a liquid propulsion-based Velocity Trimming Module (VTM) as a terminal stage |
| Space Mining | Asteroid mining is the hypothesis of extracting material from asteroids and other asteroids, including near-Earth objects. |
| Nano Satellites | Nanosatellites are loosely defined as any satellite weighing less than 10 kilograms. |
| Automatic Identification System (AIS) | Automatic identification system (AIS) is an automatic tracking system used to identify and locate ships by exchanging electronic data with other nearby ships, AIS base stations, and satellites. Satellite AIS (S-AIS) is the term used to describe when a satellite is used to detect AIS signatures. |
| Reusable launch vehicles (RLVs) | Reusable launch vehicle (RLV) means a launch vehicle that is designed to return to Earth substantially intact and therefore may be launched more than one time or that contains vehicle stages that may be recovered by a launch operator for future use in the operation of a substantially similar launch vehicle. |
| Apogee | The point in an elliptical satellite orbit which is farthest from the surface of the earth. Geosynchronous satellites which maintain circular orbits around the earth are first launched into highly elliptical orbits with apogees of 22,237 miles. |


Research Methodology
Mordor Intelligence follows a four-step methodology in all our reports.
- Step-1: Identify Key Variables: In order to build a robust forecasting methodology, the variables and factors identified in Step-1 are tested against available historical market numbers. Through an iterative process, the variables required for market forecast are set and the model is built on the basis of these variables.
- Step-2: Build a Market Model: Market-size estimations for the historical and forecast years have been provided in revenue and volume terms. For sales conversion to volume, the average selling price (ASP) is kept constant throughout the forecast period for each country, and inflation is not a part of the pricing.
- Step-3: Validate and Finalize: In this important step, all market numbers, variables and analyst calls are validated through an extensive network of primary research experts from the market studied. The respondents are selected across levels and functions to generate a holistic picture of the market studied.
- Step-4: Research Outputs: Syndicated Reports, Custom Consulting Assignments, Databases & Subscription Platforms.


