
Market Overview
| Study Period | 2020 - 2031 |
|---|---|
| Market Size (2026) | USD 40.06 Billion |
| Market Size (2031) | USD 49.24 Billion |
| Growth Rate (2026 - 2031) | 4.19 % |
| Fastest Growing Market | Asia Pacific |
| Largest Market | Asia-Pacific |
| Market Concentration | Medium |
Major Players
*Disclaimer: Major Players sorted in no particular order Image © Mordor Intelligence. Reuse requires attribution under CC BY 4.0. |
|
Automotive Diagnostic Tools Market Analysis by Mordor Intelligence
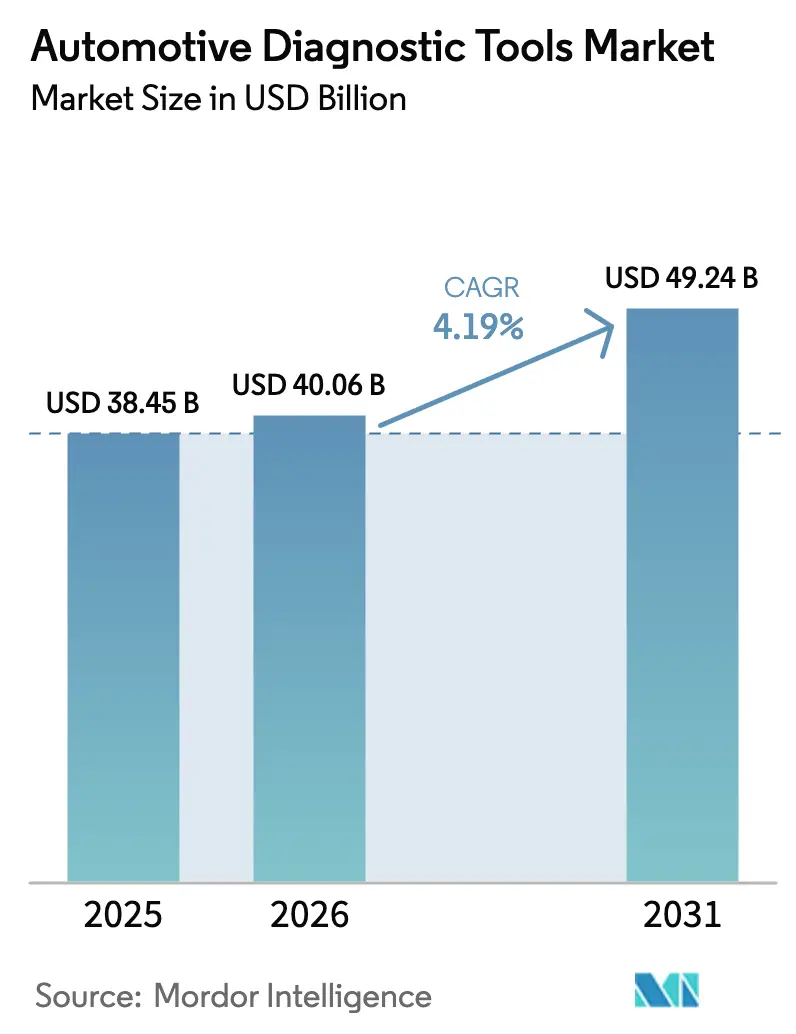
automotive diagnostic tools market size in 2026 is estimated at USD 40.06 billion, growing from 2025 value of USD 38.45 billion with 2031 projections showing USD 49.24 billion, growing at 4.19% CAGR over 2026-2031. Software-defined vehicle platforms, tighter cybersecurity norms, and electrification mandates are steering tool specifications toward high-voltage safety, remote connectivity, and cloud analytics. Wireless interfaces, over-the-air update support, and ISO/SAE 21434-ready encryption now form baseline purchase criteria for large service networks. Platform integration strategies that bundle fault-code reading, ADAS calibration, and predictive maintenance analytics on a single screen are gaining traction with dealers and fleet operators. Asia-Pacific supplies the strongest volume pull as regional electric-vehicle output and government subsidies accelerate scan-tool adoption[1]"Buoyed by Tech to Support Evolving Consumer Needs in Electrification, Software and Automation, Bosch Mobility in Americas Aims for Growth," Bosch, bosch.com.
Key Report Takeaways
- By tool type, OBD scanners held 44.12% of the automotive diagnostic tools market share in 2025, while electric-system analyzers are projected to expand at 5.88% CAGR to 2031.
- By vehicle type, passenger cars led with 60.74% revenue in 2025; light commercial vehicles are advancing at a 6.05% CAGR through 2031.
- By propulsion, internal-combustion powertrains accounted for 69.55% of the automotive diagnostic tools market size in 2025, yet battery-electric vehicles are growing at 14.3% CAGR.
- By connectivity, wired interfaces commanded a 64.55% share in 2025, whereas wireless solutions posted the same 11.76% CAGR noted above.
- By end user, OEM dealerships captured 52.12% share in 2025; fleet operators show the highest 7.24% CAGR to 2031.
- By geography, Asia-Pacific controlled a 36.05% share in 2025 and remains the fastest-growing region at 7.52% CAGR.
Note: Market size and forecast figures in this report are generated using Mordor Intelligence’s proprietary estimation framework, updated with the latest available data and insights as of 2026.
Global Automotive Diagnostic Tools Market Trends and Insights
Drivers Impact Analysis*
| Driver | (~) % Impact on CAGR Forecast | Geographic Relevance | Impact Timeline |
|---|---|---|---|
| Rapid Electrification of Powertrains | +1.8% | Global, with APAC and EU leading | Medium term (2-4 years) |
| Tightening OBD-III/Remote Diagnostics Regulations | +1.2% | North America & EU | Short term (≤ 2 years) |
| Growing Demand For Predictive Maintenance Analytics | +0.8% | Global, concentrated in commercial fleets | Medium term (2-4 years) |
| Rising Global Light-Vehicle Parc | +0.6% | Global | Long term (≥ 4 years) |
| Integration Of OTA Software Update Diagnostics | +0.5% | North America, EU, China | Short term (≤ 2 years) |
| Escalating In-Vehicle Electronics Complexity | +0.3% | Global | Long term (≥ 4 years) |
| Source: Mordor Intelligence | |||
Rapid electrification of powertrains
Battery-electric models use high-voltage circuits, thermal packs, and bidirectional chargers that standard OBD-II readers cannot interrogate. California will require a unified EV diagnostic interface by 2026, forcing tool vendors to decode battery health, insulation resistance, and charger faults across brands. Charging-station analyzers such as Fluke FEV150 now join service bays to validate grid interaction. Suppliers answer with purpose-built EV testers like THINKTOOL CE EVD, covering more than 80 brands. Workforce certification lags vehicle rollout, so data-rich tools that guide less-experienced technicians win share.
Tightening OBD-III/remote diagnostics rules
SAE J1979-2 obliges combustion-engine vehicles sold from 2027 to support unified diagnostic services, while the forthcoming J1979-3 standard targets zero-emission models. CARB and EU regulators also press for real-time, cloud-based fault reporting that shifts service from the garage to the data center. Large tool makers invest in secure-gateway credentials and ISO/SAE 21434 processes that small rivals may struggle to fund. Heavy-duty engines above 14,000 lb GVWR face parallel monitoring mandates under 40 CFR 86.010-18. Remote architecture enables fleets to schedule service before breakdowns, reducing unplanned downtime.
Growing demand for predictive maintenance analytics
Commercial carriers now stream powertrain, brake, and tire data into AI clouds that flag anomalies days ahead of failure. Uptake’s platform reports a 4× return on investment through lower roadside incidents and tighter parts inventory. As vehicles evolve into rolling computers, predictive diagnostics shift workshops from reactive repairs to continuous uptime management, elevating software talent needs.
Rising global light-vehicle parc
More vehicles on the road, an older average age, and heavier e-commerce usage expand annual service occasions. Light commercial vans record the quickest fleet expansion, generating frequent battery, brake, and emission checks. China’s automotive turnover exceeded CNY 10 trillion in 2023, reinforcing diagnostic tool sales tied to both legacy and new-energy models. Emerging markets adopt standardized scan platforms to avoid stocking multiple proprietary devices, raising volume leverage for global suppliers.
Restraints Impact Analysis*
| Restraint | (~) % Impact on CAGR Forecast | Geographic Relevance | Impact Timeline |
|---|---|---|---|
| High Up-Front Cost of Advanced Scan Tools | -1.1% | Global, particularly affecting independent workshops | Short term (≤ 2 years) |
| Cyber-Security Certification Hurdles | -0.7% | EU, North America, with expanding global reach | Medium term (2-4 years) |
| Skills Gap In Independent Aftermarket Workshops | -0.5% | Global, acute in developed markets | Long term (≥ 4 years) |
| Fragmented Communication Standards Across OEMs | -0.3% | Global | Long term (≥ 4 years) |
| Source: Mordor Intelligence | |||
High up-front cost of advanced scan tools
Top-tier ADAS calibration rigs and high-voltage analyzers can exceed USD 50,000 per bay, a stretch for small garages. Japan’s subsidy of up to JPY 160,000 per shop offsets only a fraction of the total hardware plus training spend. Subscription updates compound ownership cost yet remain essential for secure-gateway access. These economics push independents toward franchise networks or remote-service platforms such as asTech that rent OEM tools on demand.
Cyber-security certification hurdles
UN R155 and ISO/SAE 21434 oblige tool makers to document threat modeling, encryption and update procedures before vehicles grant network access. Audit cycles add 12-18 months and new engineering layers, penalizing cash-constrained innovators. Certified suppliers safeguard their head-start with regular patch schedules and over-the-air credential refreshes, raising the technology bar for newcomers.
*Our forecasts treat driver/restraint impacts as directional, not additive. The impact forecasts reflect baseline growth, mix effects, and variable interactions.
Segment Analysis
By Tool Type: Shift from single-function readers to integrated platforms
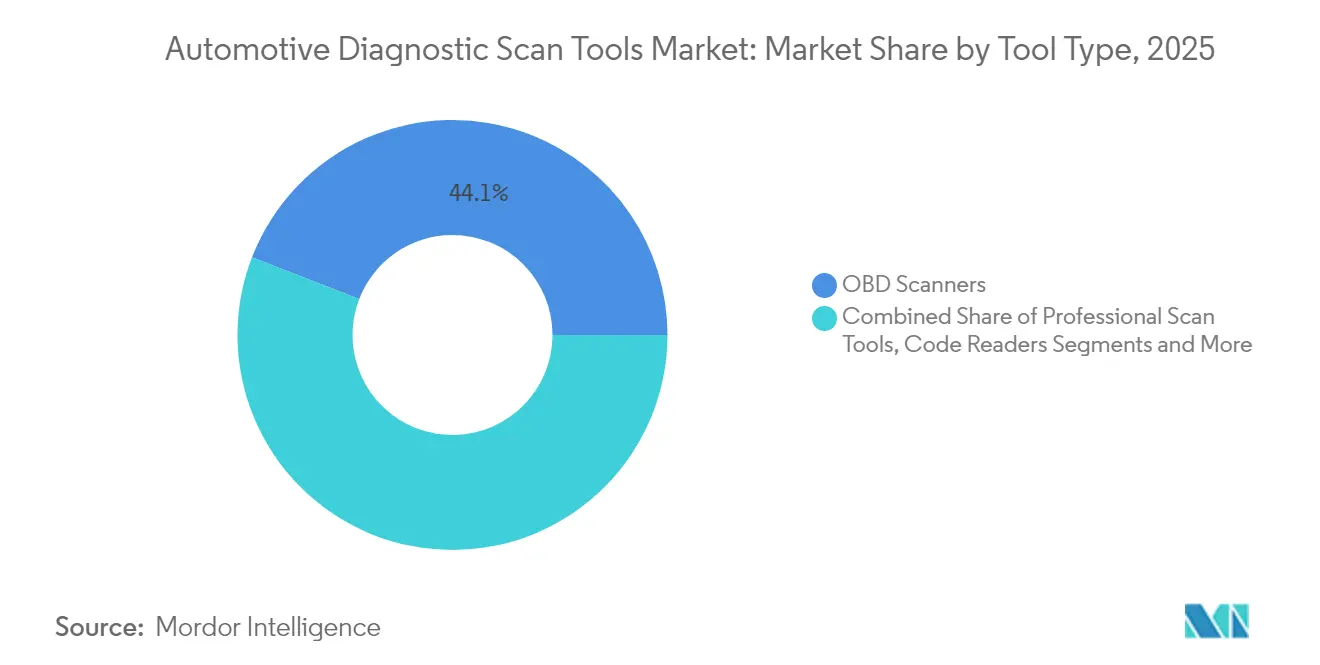
OBD scanners secured the largest slice of the automotive diagnostic tools market at 44.12% in 2025 because they work on every post-1996 passenger model. The automotive diagnostic tools market size attached to this category still grows, yet modern service bays demand combined ADAS, high-voltage, and cloud-sync features that legacy handhelds lack. Snap-on’s spring 2025 code library adds millions of tests and secure gateways for Mercedes-Benz, underscoring the race to embed OEM depth inside universal hardware.
Electric-System analyzers, posting the fastest 5.88% CAGR, hinge on Bluetooth 5.0 and dual-band Wi-Fi modules that maintain throughput during live telemetry uploads. Pressure leak testers and battery insulation probes complement the core scanner by ensuring thermal safety in EV packs, with Redline Detection equipment gaining fleet-safety endorsements. Suppliers integrate multiple sensor harnesses into one chassis to spread cost across tasks and justify price premiums amid budget-sensitive workshops.



By Vehicle Type: Commercial fleets anchor innovation yet passenger cars keep volume lead
Passenger cars retained 60.74% of the automotive diagnostic tools market share in 2025, supported by routine emissions and safety inspections. Fleet-oriented vans and trucks, however, drive tool specification trends. Light commercial vehicles grow at 6.05% CAGR to 2031 as e-commerce accelerates delivery cycles that punish downtime. Platforms like International Trucks’ OnCommand Connection feed real-time performance data to cloud dashboards, prompting proactive service orders that cut roadside events.
Heavy rigs over 14,000 lb GVWR comply with stricter CFR diagnostics, expanding protocol support requirements inside multi-brand devices. Bosch Vehicle Health reports now highlight coolant and oil deviations on mixed fleets, letting maintenance managers address issues before engine damage. As electrification reaches delivery vans, tool makers must bridge combustion and battery analytics in a single workflow, smoothing technician learning curves and inventory.
By Propulsion: High-voltage expertise reshapes tool architecture
Internal-combustion platforms still represent 69.55% of the automotive diagnostic tools market size in 2025, so scan tools remain rooted in OBD protocols. Yet the 14.3% CAGR of battery-electric models resets diagnostic priorities. Mega macs “Pro” modes analyze state-of-charge, resistance, and thermal drift inside 400-V and 800-V packs. Californian rules will oblige every EV sold after 2026 to expose standardized battery health data, eroding proprietary silos and favoring multi-brand devices.
Hybrid powertrains compound complexity by combining exhaust treatment checks with inverter testing, an area the forthcoming SAE J1979-3 spec will clarify. Investors back robotics startups such as Kinetic Automation that use computer vision for non-contact EV diagnosis, promising faster triage in high-volume service centers. This convergence of optical, thermal and digital diagnostics defines next-generation product roadmaps.
By Connectivity: Wireless gains share but wired retains deep-flash dominance
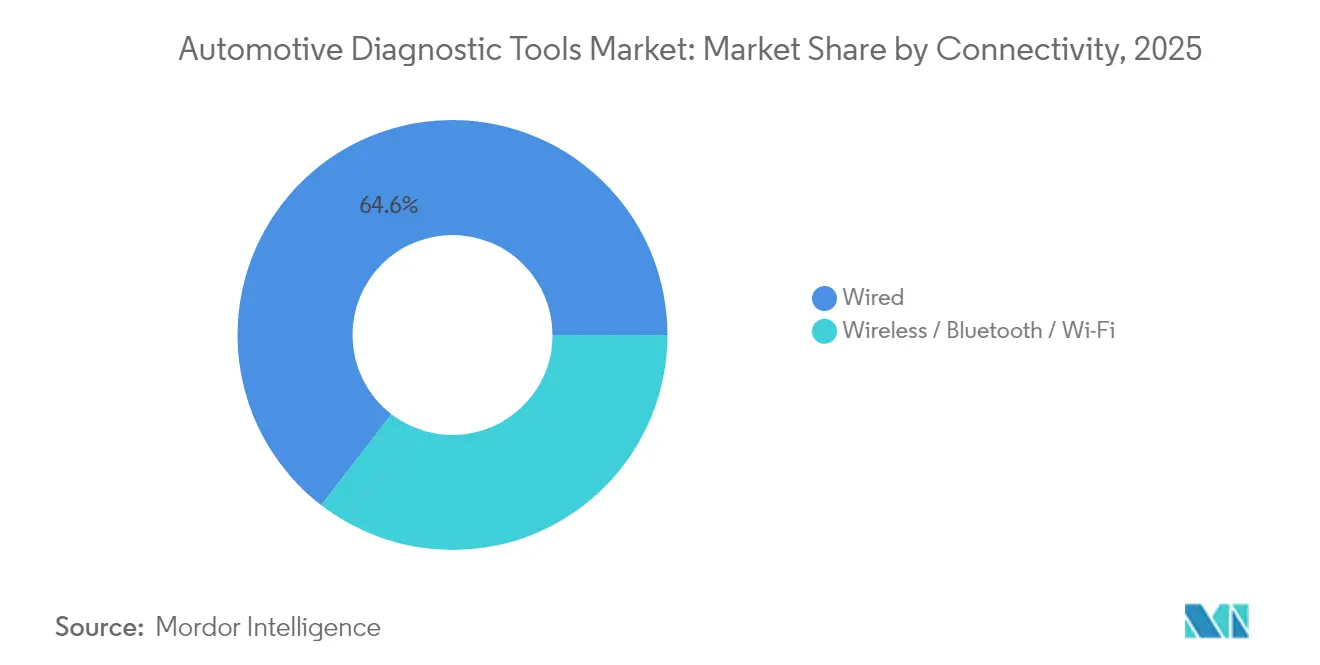
Wired cables still anchored 64.55% market share in 2025 on the strength of secure data rates required for firmware flashing and secure-gateway unlocks. As vehicles adopt gigabit Ethernet backbones, hardline links will remain irreplaceable during safety-critical calibrations. Even so, the wireless slice enjoys 11.76% CAGR because it eliminates trip hazards and enables remote triage. HARMAN’s new OTA 12.0 stack orchestrates distributed updates across high-performance compute units, and diagnostic tools must interoperate with that pipeline.
Mobile-first operators value dongles that stream freeze-frame data to tablets while technicians work elsewhere on the shop floor. Security posture remains paramount; ISO 15031-7 guidance on data-link security steers authentication layers inside wireless adapters. Hybrid tool designs combining USB-C and dual-band Wi-Fi ports deliver flexibility without compromising compliance.
By End User: Fleets outpace dealerships on analytics adoption
OEM dealerships controlled 52.12% of 2025 revenue owing to exclusive access to brand-specific functions. The fleet-operator segment, however, rises with a 7.24% CAGR because predictive maintenance cuts roadside failure by up to 70%, an outcome that yields rapid payback. Remote-diagnostic providers such as asTech supply factory-approved scans on demand, letting small fleets avoid major capital outlays.
Independent garages face investment hurdles but receive government support in select markets; Japan reimburses a portion of scan-tool and training expenses starting March 2025. Skill-up programs like Valeo Tech Academy certify technicians on EV safety and ADAS calibration, broadening labor pools for all end-user groups.
Geography Analysis
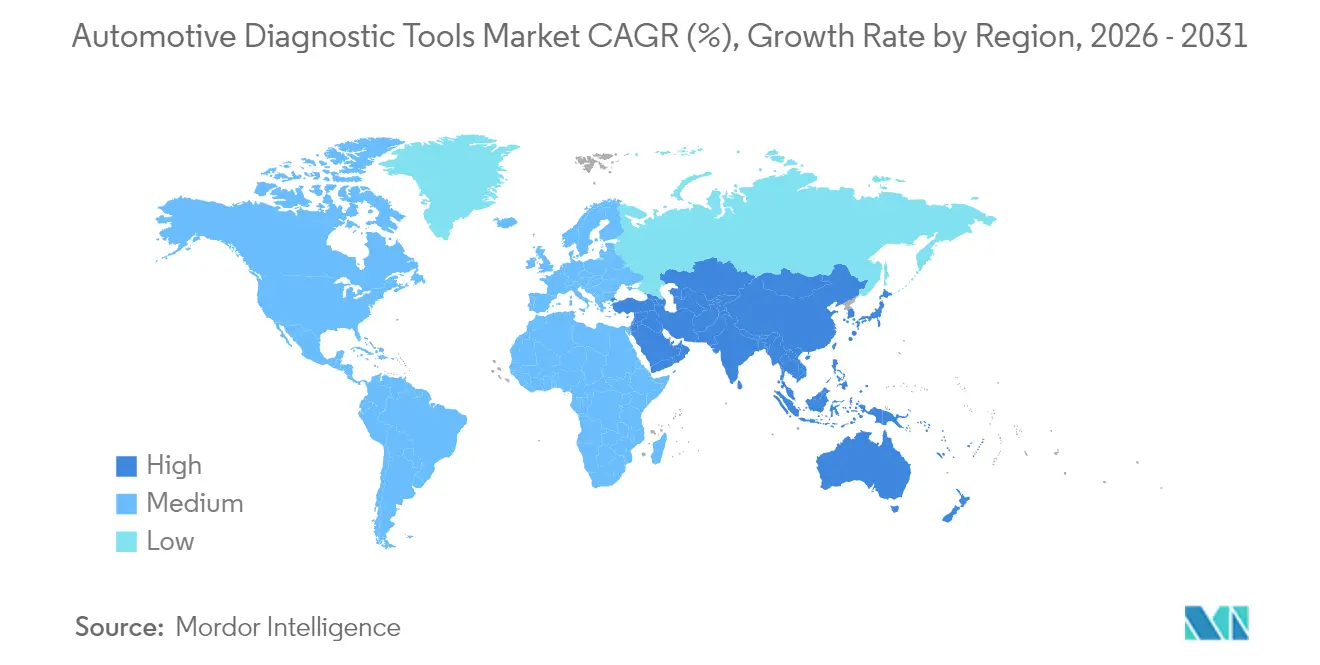
Asia-Pacific holds 36.05% of the automotive diagnostic tools market share in 2025 and expands the fastest at 7.52% CAGR. China’s 50% surge in EV production during 2023, plus a 10 trillion-yuan automotive revenue base, keeps tool demand buoyant. Beijing’s push toward autonomous-mobility fleets by 2025 requires V2X-aware diagnostics that validate radar alignment and lidar cleanliness before dispatch. Japan begins obligatory OBD inspections in October 2024 and subsidizes scan-tool purchases for workshops to ensure compliance. India’s aftermarket joint ventures between ASK Auto and AISIN extend parts and service networks across South Asia, lifting scan-tool penetration in tier-2 cities.
North America follows with strong regulatory momentum. California’s Advanced Clean Cars II rule forces standardized EV diagnostics by 2026, and CARB pilots remote-OBD concepts that remove the need for physical inspection visits. Fleets adopt Uptake’s AI health reports to optimize maintenance budgets, reinforcing tool upgrades that push data into cloud dashboards. OEM dealerships add secure-gateway unlocks for brands like Mercedes-Benz through Snap-on’s 2025 software wave.
Europe aligns with UN R155 cybersecurity rules that demand type-approval audits for diagnostic interfaces. Large suppliers embed ISO/SAE 21434 frameworks to meet these audits, and franchise workshops benefit from corporate compliance coverage. Training schemes certified by the Institute of the Motor Industry close skill gaps, especially for high-voltage servicing.

Regulatory Landscape
Regulation is tightening around emissions-related diagnostics access, secure gateways, and cybersecurity for connected tools. In the United States, the EPA issued guidance (IACD-2026-08) on July 1, 2026 clarifying manufacturer obligations under the Clean Air Act to provide third parties access to emissions-related service information and enable passthrough reprogramming, supporting aftermarket scan tools and J2534 workflows.
Europe is moving toward more prescriptive technical requirements for secure OBD access and repair and maintenance information sharing. Commission Delegated Regulation (EU) 2026/699 entered into force on June 23, 2026, setting standardized security measures and non-discriminatory access principles for independent operators, which increases compliance work around secure authentication and data access governance. Across regions, alignment with the SAE J1979 and ISO 15031 family remains a baseline for emissions-related diagnostics, while cybersecurity expectations anchored in frameworks such as UN R155 and ISO/SAE 21434 continue to raise certification and documentation demands for tool vendors.
Value Chain Analysis
The value chain covers diagnostic hardware and software platform providers (for example, Bosch, Snap-on, Autel, Launch, Opus IVS, and TOPDON), repair-content and workflow intelligence suppliers (such as Solera/Identifix), and multi-tier distribution and service enablement partners that reach workshops and fleets. Go-to-market is increasingly shaped by bundled solutions that combine scan hardware, subscription software updates, cloud connectivity, and repair databases, with wholesalers and program groups acting as key demand aggregators for independents that cannot justify full OEM tool stacks.
Access to OEM protocols, security keys, and validation coverage for new vehicle models remains a central bottleneck, with verification cycles often extending 12 to 24 months after a vehicle launch and creating dependency on licensure and data-sharing relationships. Recent partnerships show how vendors are shortening time-to-coverage and expanding reach: TOPDON US partnered with MEDCO in May 2025 to extend wholesale distribution across the United States, while Solera/Identifix integrated its Direct-Hit repair content into XTool hardware in May 2025 to embed confirmed fixes and manuals at the point of diagnosis. Remote diagnostics and calibration networks also sit in the chain, with Repairify (asTech) partnering with Auto-Wares in December 2024 and Protech Automotive Solutions partnering with Mitchell and Opus IVS in November 2024 to extend ADAS calibration detection into a diagnostics-as-a-service workflow.
Competitive Landscape
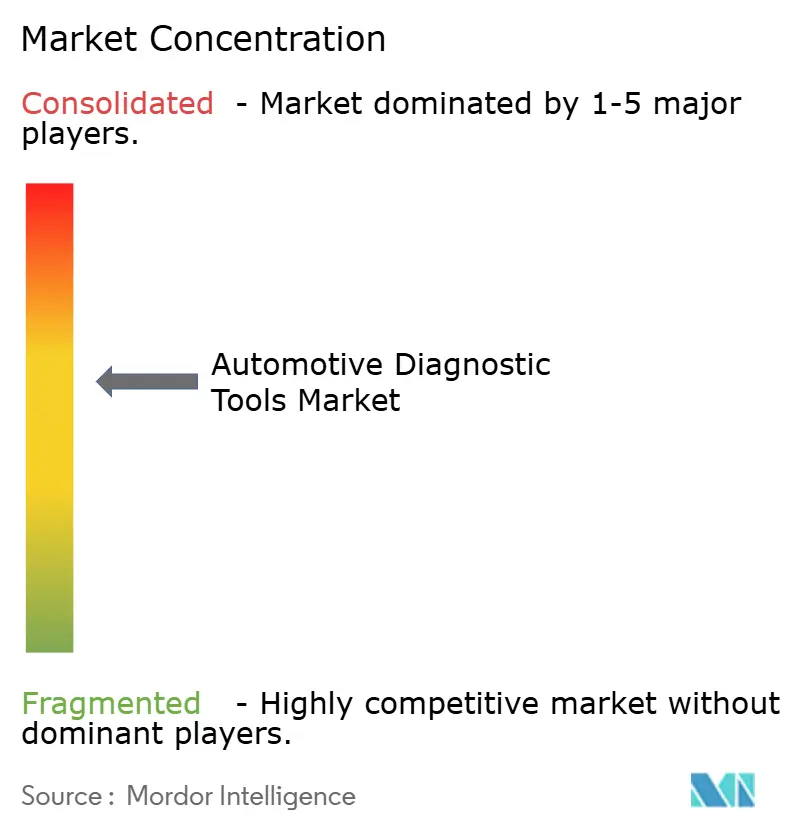
The automotive diagnostic tools market exhibits moderate concentration with fragmented competitive dynamics, with no single player commanding dominant market control due to diverse customer requirements across OEM dealerships, independent workshops, and fleet operators. Strategic patterns emphasize platform integration and cybersecurity compliance, with major players like Bosch advancing ESI[tronic] Evolution software that integrates vehicle diagnosis, repair instructions, and automaker documentation into unified platforms while adding Tesla diagnostic support starting 2025.
New entrants exploit AI and robotics. Kinetic Automation’s computer-vision robots scan EVs without physical hookups, promising throughput gains for high-volume service lanes. Uptake partners with TruckSuite to push predictive analytics to small fleets, using existing telematics feeds rather than bespoke hardware. AsTech offers remote OEM scans with no monthly fee, appealing to independent shops seeking factory-level depth without heavy investment.
Cybersecurity compliance defines a key moat. Vendors craft ISO/SAE 21434 documentation pipelines and continuous-patch infrastructure to retain type-approval access. Partnerships with cloud majors such as Bosch-Microsoft drive generative AI for automated fault interpretation. Meanwhile, franchise concepts like Bosch Auto Service bundle high-voltage bays, shop-management software and diagnostic subscriptions to lock in aftermarket revenue.
Automotive Diagnostic Tools Industry Leaders
-
Delphi Automotive PLC
-
Robert Bosch GmbH
-
Continental AG
-
Snap-on Incorporated
-
Denso Corporation
- *Disclaimer: Major Players sorted in no particular order

Market Opportunities and Future Outlook
Software-defined vehicle architectures are creating a clearer role for tools that diagnose both legacy ECUs and centralized high-performance computers through standardized, API-led approaches. ISO 17978-3:2026 (published March 2026) formalizes an application programming interface for service-oriented vehicle diagnostics, and ASAM SOVD provides a specification pathway for toolmakers to integrate API-based diagnostics with existing UDS workflows, supporting remote, cloud-based diagnosis and software service operations.
Regulatory and access changes are also opening space for independent-operator solutions that can navigate secure gateways at scale. In the EU, Delegated Regulation (EU) 2026/699 (in force June 23, 2026) requires manufacturers to provide software and implementation information to independent diagnostic tool manufacturers by December 23, 2026, strengthening the business case for compliant secure-access modules, credential management, and multi-brand platforms that bundle fault isolation, ADAS calibration workflows, and programming support. This environment favors offerings that combine remote diagnostics-as-a-service with J2534 passthrough and secure gateway coverage, helping independent workshops and fleets reduce upfront tool investment while maintaining OEM-level compatibility.
Recent Industry Developments
- May 2026: Snap-on introduced the APOLLO GEN 4 scan tool, adding Fast-Track Intelligent Diagnostics and a wireless scan module capability. The launch strengthens Snap-on’s positioning around guided diagnostics and connected workflows as service bays adopt wireless interfaces and integrated software features.
- March 2026: Snap-on launched Pass Thru Assistant+, a J2534 programming device designed to enable remote flash programming and provide diagnostic guidance. This supports a shift toward remote-enabled reprogramming and service models that help independents access advanced OEM functions without expanding in-bay hardware complexity.
- January 2025: Bosch added comprehensive diagnostic and maintenance support for Tesla vehicles within its ESI[tronic] software platform. Expanding coverage for a major EV brand raises the competitive bar for multi-brand diagnostic subscriptions and aligns with broader demand for high-voltage and software-centric vehicle service capabilities.


Research Methodology Framework and Report Scope
Market Definition and Coverage
This market covers revenue from diagnostic tools and related software used to identify vehicle faults, read codes, run system tests, and support service decisions across passenger and commercial vehicles.
Scope exclusions: We exclude general garage equipment that is not used mainly for electronic diagnostics (for example, lifts and basic mechanical hand tools).
Segmentation Overview
-
By Tool Type
- OBD Scanners
- Professional Scan Tools
- Electric-System Analyzers
- Pressure & Leak Testers
- Code Readers
-
By Vehicle Type
- Passenger Cars
- Light Commercial Vehicles
- Medium and Heavy Commercial Vehicles
-
By Propulsion
- Internal Combustion Engine
- Battery-Electric Vehicle
- Hybrid & Plug-in Hybrid
-
By Connectivity
- Wired
- Wireless / Bluetooth / Wi-Fi
-
By End User
- OEM Dealerships
- Independent Aftermarket Garages
- Fleet Operators
-
Geography
-
North America
- United States
- Canada
- Rest of North America
-
South America
- Brazil
- Argentina
- Rest of South America
-
Europe
- Germany
- United Kingdom
- France
- Italy
- Russia
- Rest of Europe
-
Asia-Pacific
- China
- Japan
- India
- South Korea
- Australia
-
Middle East and Africa
- GCC
- South Africa
- Rest of Middle East and Africa
-
North America
Data Sources, Market Sizing, and Validation
Desk Research
Desk research started with building the demand and supply picture for diagnostics in each major region, then mapping where tool sales are most tied to repair activity, vehicle complexity, and regulations. We used public sources such as vehicle parc and registration statistics from transport agencies, trade and customs databases for diagnostic equipment flows, and technical standards references (for example, OBD and related emissions compliance documentation).
To keep assumptions realistic, we also reviewed sources such as patent databases for diagnostics and connectivity themes, peer-reviewed automotive engineering journals for architecture shifts, and trade association publications on aftermarket service capacity and technician needs. We relied on general secondary material such as company annual reports, investor presentations, and reputable press coverage to confirm product mix direction and channel movements. Select paid subscriptions were used only for company financials and news tracking, plus patent lookups and shipment-level trade checks where available. These sources are illustrative and not exhaustive, and many other references were used for data collection, validation, and research clarification.
Primary Interviews and Surveys
Primary work focused on validating how diagnostic tools are actually purchased and priced in workshops, dealerships, fleets, and independent service networks. We then stress tested the adoption curve for newer functions, such as ADAS related calibration support and EV high voltage checks. We spoke with a mix of manufacturers, distributors, service operators, and industry specialists across APAC, EMEA, and the Americas, which helped close gaps in ASP movement, replacement cycles, and channel margins that are not consistently visible in public data.
Distribution of primary research fieldwork respondents
| Company type | Respondent position | Region |
|---|---|---|
| Top tier: 39% | CXOs: 12% | APAC: 44% |
| Mid tier: 47% | Functional/Unit leaders: 33% | EMEA: 33% |
| Smaller Players: 14% | Managers: 55% | Americas: 23% |
Market-Sizing & Forecasting
The core model uses a top-down approach where the serviceable vehicle base and repair activity translate into a diagnostic tool demand pool. We then convert demand into value using region-specific pricing and mix assumptions. Results are corroborated using selective bottom-up approximations, such as sampled supplier revenue splits, channel checks on unit shipments for popular tool classes, and ASP times volume sanity checks for workshops versus dealership demand.
Key inputs that shaped the sizing included the vehicle parc by region and powertrain, average workshop throughput, diagnostic events per vehicle per year, tool replacement and upgrade cycles, and the price ladder across basic code readers, professional scan tools, and electric system analyzers. We tracked indicators like EV share progression, ADAS feature penetration, and connectivity preference (wired versus wireless) because they influence the need for higher capability tools and software updates.
For forecasting, scenario analysis was used, supported by variable-level trend views shared by primary respondents, especially on repair complexity and expected pricing pressure. Where bottom-up evidence was uneven by country, gaps were handled by applying region-level ratios that were first verified through interviews and then rechecked against trade flow direction and workshop density signals.
Data Validation & Update Cycle
Outputs were cross-checked against independent signals such as regional vehicle parc trends, workshop count growth, and observed pricing bands for major tool categories. Variances were reviewed before sign-off. When a metric moved outside an expected range, for example an abrupt ASP jump without a matching mix shift, we re-opened assumptions and, where needed, re-contacted sources to confirm what changed.
The report is refreshed annually, and interim updates are made when material events impact demand or pricing assumptions, such as sharp currency moves, regulation timing shifts, or step changes in EV and ADAS related service needs. Before delivery, an analyst performs a fresh pass on key inputs so clients receive an updated view that matches the current market environment.
Mordor Intelligence's Automotive Diagnostic Tools Market Size Compared With Other Published Estimates
Published market values for automotive diagnostic tools can vary even when the topic name looks similar, mainly because the counted scope, the pricing logic, and the update timing are not the same. We reviewed a few widely cited figures and then summarized the most practical reasons behind the spread.
In this market, the biggest gaps usually come from whether diagnostic software is counted alongside hardware, how professional workshop tools are separated from basic consumer code readers, and how ASP changes are treated when connectivity and EV functionality shift the mix. The table also reflects timing choices, since some sources lock currency conversion earlier in the year or hold ASPs flat for longer periods, which can move the headline value even if unit demand is similar. This is why the refresh cadence and currency timing used in Mordor Intelligence can align more closely with what channel checks and interview feedback indicate for the base year.
Benchmark comparison
| Source | Market Size | Gaps in Research Methodology |
|---|---|---|
| Mordor Intelligence | USD 38.45 B (2025) | |
| Industry Publisher A | USD 38.42 B (2025) | Uses a scan tools framing that may treat software as a bundled line item and can smooth price movement across regions, which reduces visibility into mix driven ASP shifts between basic readers and professional tools. |
| Research Portal B | USD 43.99 B (2025) | Appears to use a broader inclusion set that can pull in adjacent workshop equipment categories and wider service related revenue, which inflates the total compared with a tools focused boundary. |
Looking across the three values, the gap is less about arithmetic and more about what gets counted, how pricing is updated, and how tightly the estimate is tied back to real service activity. By keeping the scope tied to diagnostics tools demand drivers and rechecking pricing and currency assumptions against recent signals, the final number stays traceable to clear inputs and repeatable steps that can be explained and revisited.


Key Questions Answered in the Report
What is the current value of the automotive diagnostic tools market?
He automotive diagnostic tools market size is USD 40.06 billion in 2026, with a forecast to hit USD 49.24 billion by 2031 at a 4.19% CAGR.
Why are wireless diagnostic tools gaining popularity?
Wireless adapters support remote triage, over-the-air updates and predictive-maintenance data streams, helping fleets cut downtime while posting a 11.76% CAGR growth rate.
How will California’s 2026 regulation affect diagnostic tools?
The rule mandates a standardized EV diagnostic interface that exposes battery and charger data, pushing tool makers to adopt common high-voltage protocols and cloud connectivity.
Which market segment is expanding the fastest by propulsion type?
Battery-electric vehicles lead with a 14.3% CAGR, driving demand for high-voltage safety testers and state-of-health battery analyzers.
What challenge do independent workshops face when upgrading diagnostics?
Advanced scan platforms can cost more than USD 50,000 and require paid software updates, creating capital and subscription burdens that subsidies in markets like Japan only partly offset.
Page last updated on:


 Your data is secure and never sold or shared.


