Market Overview
| Study Period | 2017 - 2030 |
|---|---|
| Forecast Data Period | 2025 - 2030 |
| Historical Data Period | 2017 - 2023 |
| Market Size (2025) | USD 559.1 Million |
| Market Size (2030) | USD 708.3 Million |
| Growth Rate (2025 - 2030) | 4.84% CAGR |
| Market Concentration | Low |
Major Players*Disclaimer: Major Players sorted in no particular order Image © Mordor Intelligence. Reuse requires attribution under CC BY 4.0. | |

Southeast Asia Vegetable Seed Market Analysis by Mordor Intelligence
The Southeast Asia Vegetable Seed Market size is estimated at 559.1 million USD in 2025, and is expected to reach 708.3 million USD by 2030, growing at a CAGR of 4.84% during the forecast period (2025-2030).
The Southeast Asian vegetable seed industry is experiencing significant technological advancement and consolidation through strategic acquisitions and partnerships. Major industry players are expanding their presence through acquisitions, as evidenced by BASF's acquisition of ASL, a leading melon breeding company, in 2023 to strengthen its hybrid melon seed portfolio. Similarly, East-West Seed established a stronger foothold in Latin America through its acquisition of Hortec Tecnologia de Sementes Ltd in Brazil, demonstrating the growing global ambitions of Southeast Asian market leaders. These strategic moves are reshaping the competitive landscape and bringing advanced breeding technologies to the region.
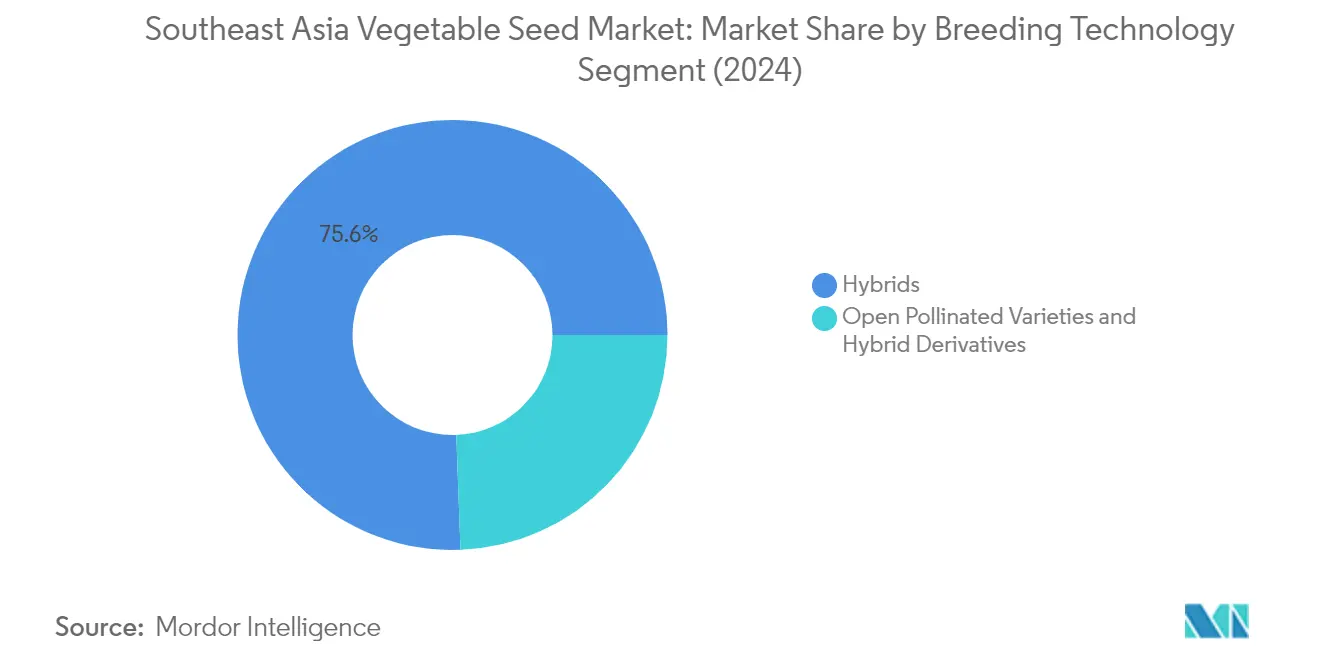
The industry is witnessing a clear shift toward hybrid seed adoption, with hybrid seeds commanding 75.2% of the market share in 2022, driven by their superior productivity and resistance to biotic and abiotic stresses. This transition is supported by extensive research and development activities, as demonstrated by Enza Zaden's introduction of new lettuce varieties in 2023 that exhibit high resistance to three new Bermian races. Seed companies are increasingly investing in developing vegetable seed varieties specifically adapted to Southeast Asian growing conditions, focusing on traits such as disease resistance, heat tolerance, and improved yield potential.
Protected cultivation is gaining prominence across Southeast Asia as farmers seek to optimize production and quality while minimizing environmental risks. The protected cultivation segment, though currently small, is showing promising growth potential, particularly in Thailand where the government's 20-year Agriculture and Co-operative Strategy (2017-2036) actively supports Smart Agriculture initiatives through subsidies for protected cultivation. The region's total area under Asian vegetable seed cultivation reached 521 million hectares in 2022, with a growing portion being allocated to protected cultivation methods.
The market is characterized by a dual technology approach, with open-pollinated varieties maintaining a significant presence alongside hybrids. Open-pollinated varieties and hybrid derivatives held a 24.8% market share in 2022, serving an important role in meeting the needs of small-scale farmers and maintaining crop diversity. This dual approach ensures market accessibility across different farmer segments while supporting sustainable agricultural practices. The trend is particularly evident in Thailand, where the area under garden vegetable seed cultivation reached 1.5 million hectares in 2022, accommodating both traditional and modern cultivation methods.
Southeast Asia Vegetable Seed Market Trends and Insights
Root and bulbs dominate vegetable cultivation in Southeast Asia as they are well-suited to the soil types found in the region
- Southeast Asia has a favorable climate and agronomic conditions for vegetable cultivation. As a result, in 2022, the region dedicated 8.7 million hectares to vegetable cultivation, which accounted for 10.7% of the total cultivation area in Southeast Asia. Roots and bulbs are the largest segment in Southeast Asia, and it accounted for 51.2% of the vegetable area in 2022, with 4.4 million ha. This is because they are well-suited to the soil types found in the region. These crops have a relatively low cost of production and can be grown without huge amounts of inputs, making them the preferred choice by farmers in the region.
- Chili is the dominant vegetable in terms of cultivation area in Southeast Asia, and it accounted for 7.1% of the total vegetable cultivation in the region in 2022. In Southeast Asia, Indonesia was the major chili-producing country, which held a share of 52.2% of the region's overall cultivation area in 2022, with 324.7 thousand ha. The highest share is due to the demand by processing industries and the adoption of advanced mechanisms for chili cultivation in the country. The other major vegetable crops cultivated in Southeast Asia are tomato, potato cabbage, and cucumber. Between 2017 and 2022, Southeast Asia’s tomato area increased by 6.8% due to the increase in the prices of tomatoes and higher consumer demand.
- Indonesia is the largest country in the region with respect to the area under cultivation of vegetables, and it accounted for 23.5% of the region's vegetable area in 2022. The area was increasing as the farmers shifted toward vegetables due to the increase in the demand from the domestic and international markets. Therefore, the adoption of advanced mechanisms is expected to drive the growth of vegetable acreage in the region.


Cabbage, pumpkin and squash are vital vegetable crops in Southeast Asia, with a rising demand for disease resistant and quality attributes varieties to meet the higher consumer demand
- Cabbage is one of the most important vegetable crops in Southeast Asia. Different types of cabbages grown in the region are Vietnamese cabbages, Chinese cabbages, and Bak Choy. Varieties with disease tolerance (Alternaria leaf blight, wilts, and rots), quality traits such as the size of the head, the color of head leaves, the shape of the head, and other traits such as pest resistance and wider adaptability are the major traits widely adopted. Additionally, the size of heads and head weight are the major traits that have a significant demand, as they help in increasing yield productivity per hectare. Companies such as Limagrain and Rijk Zwaan are providing cabbage seeds with these traits to grow in adverse weather conditions with high quality.
- Pumpkin and squash are the major cucurbits widely grown in the region. The popular traits of the crop are quality attributes such as good shape, size, and color, longer storage life, disease resistance, especially against the geminin virus, and wider adaptability to different climatic and soil types. It is expected that in the future, disease resistance and quality attribute traits will be more widely available as companies develop new varieties with mildew tolerance and virus resistance, as well as uniformity, color, and flavor. Moreover, East-West Seed has varieties, such as 18880 F1 and Pujitha F1, which provide resistance to geminin and potyvirus in the crop. In the Philippines, Enza Zaden launched new seed varieties through a partnership with Vitalis Organic Seeds in 2021.
- Factors such as the introduction of new seed varieties with higher resistance to viruses, quality attributes, and high yield are expected to help in the growth of the vegetable seed market during the forecast period.

OTHER KEY INDUSTRY TRENDS COVERED IN THE REPORT
- Cabbage, pumpkin and squash are vital vegetable crops in Southeast Asia, with a rising demand for disease resistant and quality attributes varieties to meet the higher consumer demand
- The hybrid breeding technique dominated the Southeast Asian vegetable seed market due to the increasing demand for hybrid vegetable seeds in the region
- Southeast Asia faces challenges in growing tomatoes and chili due to climatic conditions, leading to a high demand for disease-resistant and quality traits
Segment Analysis: Breeding Technology
Hybrids Segment in Southeast Asia Vegetable Seed Market
The hybrids segment dominates the Southeast Asian vegetable seed market, accounting for approximately 76% of the total market value in 2024. This significant market share is primarily attributed to the superior characteristics of hybrid seeds, including higher productivity, wider adaptability, and enhanced resistance to biotic and abiotic stresses. In Solanaceae crops, hybrids demonstrate 50% higher yield compared to conventional varieties, making them particularly attractive to farmers. The segment's growth is further driven by the modernization of agriculture and continuous development of new products by major players in the region. Hybrid seeds have shown remarkable performance in disease resistance and early maturity traits, which are crucial factors for farmers in Southeast Asia. The segment is also witnessing increased adoption in protected cultivation practices, particularly for crops like tomatoes, chilies, and cucumbers. With companies heavily investing in R&D to develop new varieties tolerant to various stresses, the hybrid segment is projected to grow at around 5% annually through 2029, maintaining its dominant position in the market.

Open Pollinated Varieties & Hybrid Derivatives Segment in Southeast Asia Vegetable Seed Market
The open-pollinated varieties (OPV) and hybrid derivatives segment represents a crucial alternative in the Southeast Asian vegetable seed market, particularly for small-scale and resource-constrained farmers. This segment is characterized by its cost-effectiveness and sustainability features, requiring fewer inputs such as fertilizers and pesticides compared to hybrid varieties. The segment has gained significant traction in countries like Indonesia and Myanmar, where farmers value the ability to save seeds for subsequent seasons. These varieties are particularly popular in root crops and traditional vegetables, where farmers prioritize local adaptation and consistent performance over maximum yield potential. The segment's appeal is further enhanced by its role in maintaining genetic diversity and supporting regional food security. Market players are actively working on improving OPV varieties to enhance their disease resistance and yield stability while maintaining their cost advantage over hybrids.
Segment Analysis: Cultivation Mechanism
Open Field Segment in Southeast Asia Vegetable Seed Market
The open field cultivation segment continues to dominate the Southeast Asian vegetable seed market, accounting for approximately 99.99% of the total market volume in 2024. This overwhelming dominance is primarily attributed to the lower investment requirements for cultivation in open fields compared to protected structures like greenhouses and playhouses. The open-field cultivation method provides a livelihood to the working population across Southeast Asian countries, with small-scale farmers dominating vegetable cultivation across major countries such as Thailand, Indonesia, and Singapore. The region's area under vegetable cultivation using open field methods has shown steady growth, driven by rising consumer demand and the segment's ability to support large-scale production. Additionally, the method's accessibility to farmers of all scales, combined with its lower operational costs and traditional farming practices, has helped maintain its position as the primary cultivation mechanism in the region.
Protected Cultivation Segment in Southeast Asia Vegetable Seed Market
The protected cultivation segment is experiencing rapid growth in the Southeast Asian vegetable seed market, projected to grow at approximately 6% between 2024 and 2029. This growth is being driven by increasing advancements in agriculture and farmers' growing adoption of various protected cultivation practices. The trend is particularly strong due to protected cultivation's ability to produce higher yields and higher-quality products while using fewer harmful pesticides. The introduction of new seed varieties specifically developed for protected environment cultivation, coupled with proper awareness training for farmers, has demonstrated improved quality of vegetables produced and increased farmer profits. Government support, such as Thailand's 20-year Agriculture and Co-operative Strategy (2017-2036), which provides subsidies and other support for protected cultivation, is further accelerating the segment's growth.
Segment Analysis: Crop Family
Solanaceae Segment in Southeast Asia Vegetable Seed Market
The Solanaceae segment dominates the Southeast Asian vegetable seed market, accounting for approximately 27% market share in 2024. This segment's leadership position is primarily driven by the increasing area under cultivation of key crops like tomato, chili, and eggplant across the region. The segment's strong performance is supported by the high adoption rate of hybrid seeds, particularly in Indonesia and Myanmar, which together account for a significant portion of the Solanaceae seed market. The demand is further bolstered by the growing food processing industry's requirements, especially for tomatoes and chilies, along with increasing consumer preference for these vegetables in daily cuisine. Additionally, the segment benefits from technological advancements in seed development, particularly in disease resistance and yield improvement, making these crops more attractive to farmers.
Brassicas Segment in Southeast Asia Vegetable Seed Market
The Brassicas segment is emerging as the fastest-growing category in the Southeast Asian vegetable seed market, projected to grow at approximately 6% during 2024-2029. This remarkable growth is primarily attributed to the increasing consumption of salad vegetables and the segment's suitability for protected cultivation methods. The segment's expansion is further supported by the rising export demand for brassica vegetables from the region and the short duration nature of these crops, which allows farmers to have multiple harvests per year. The growth is also driven by technological advancements in seed development, particularly in creating varieties resistant to tropical climates and common diseases. Additionally, the increasing adoption of hybrid varieties in cabbage, cauliflower, and broccoli cultivation is contributing to the segment's rapid growth, as these hybrids offer better yield and disease resistance properties.
Remaining Segments in Crop Family
The Southeast Asian vegetable seed market encompasses several other significant segments including Cucurbits, Roots & Bulbs, and Unclassified Vegetables, each playing a vital role in the overall market dynamics. The Cucurbits segment, comprising crops like cucumber, pumpkin, and squash, maintains a strong presence due to its importance in local cuisine and export markets. The Roots & Bulbs segment, including crops like onions and garlic, continues to be significant due to their fundamental role in Southeast Asian cooking and their storage capabilities. The Unclassified Vegetables segment, which includes various leafy vegetables and specialty crops, contributes to market diversity by catering to specific regional preferences and emerging consumer trends in healthy eating habits.
Southeast Asia Vegetable Seed Market Geography Segment Analysis
Southeast Asia Vegetable Seed Market in Indonesia
Indonesia dominates the Southeast Asian vegetable seed landscape, commanding approximately 25% of the regional market in 2024. The country's prominence in vegetable seed production is driven by its extensive agricultural infrastructure and favorable climatic conditions for vegetable cultivation. Tomato remains one of the most profitable crops in Indonesia, with popular varieties including Saviro, Tiffany, and Royal tomatoes gaining significant traction among farmers. The country has witnessed a notable shift toward hybrid seeds in vegetable seed production, with hybrid varieties accounting for nearly 70% of the market due to their superior yields and disease resistance characteristics. The Indonesian government's supportive agricultural policies and focus on increasing domestic vegetable production have further strengthened the seed market. Carrots and chili hold substantial market share, reflecting the country's diverse vegetable cultivation portfolio and the growing adoption of improved production techniques by farmers. The Indonesia fruit and vegetable seeds market continues to thrive, bolstered by these strategic advancements.
Southeast Asia Vegetable Seed Market in Vietnam
Vietnam's vegetable seed market demonstrates remarkable dynamism, projected to grow at approximately 7% CAGR from 2024 to 2029. The country's seed market is characterized by a strong presence in unclassified vegetable seeds, particularly asparagus, which has gained prominence due to its export potential. The Vietnamese market shows a clear preference for hybrid varieties, with hybrids dominating nearly three-quarters of the vegetable seed market. The country's success in the sector is supported by its robust agricultural research and development infrastructure, particularly in developing varieties suited to local growing conditions. Vietnam's strategic focus on technological advancement in agriculture and increasing investments in seed development has positioned it as a key player in the regional market. The country's emphasis on protected cultivation methods and greenhouse technologies has further enhanced its capacity for high-value vegetable seed production.
Southeast Asia Vegetable Seed Market in Myanmar
Myanmar has established itself as a significant player in the Southeast Asian vegetable seed market, with particular strength in Solanaceae crops. The country's vegetable seed industry is characterized by its diverse portfolio, with tomato and chili seeds leading the market. Myanmar's success in the sector is built on its strategic focus on developing disease-resistant and high-yielding varieties suited to local growing conditions. The country has made significant strides in modernizing its seed production infrastructure, particularly in protected cultivation methods. The domestic market shows a strong preference for hybrid varieties, especially in tomato and chili production, driven by increasing demand from food processing industries. Myanmar's agricultural sector benefits from favorable government policies promoting seed quality improvement and farmer education programs.
Southeast Asia Vegetable Seed Market in Philippines
The Philippines has developed a robust vegetable seed market characterized by its focus on diverse crop varieties and adaptation to local growing conditions. The country's seed industry is particularly strong in eggplant production, known locally as talong, which has become a cornerstone of its vegetable seed sector. The Philippine market demonstrates a strong emphasis on developing varieties resistant to local diseases and adapted to tropical growing conditions. The country's agricultural research institutions have played a crucial role in developing improved seed varieties suited to local farming practices. The government's support through various agricultural programs and initiatives has helped strengthen the domestic seed production infrastructure. The Philippines has also made significant progress in promoting protected cultivation methods, particularly in regions with challenging weather conditions.
Southeast Asia Vegetable Seed Market in Other Countries
The vegetable seed market in other Southeast Asian countries, including Singapore, Malaysia, Cambodia, and Laos, exhibits unique characteristics shaped by their specific agricultural needs and environmental conditions. These markets are characterized by increasing adoption of modern farming techniques and a growing emphasis on sustainable agriculture practices. Singapore, in particular, has emerged as a hub for agricultural innovation, focusing on urban farming solutions and high-tech seed development. Malaysia's market shows strong potential in tropical vegetable varieties, while Cambodia and Laos are gradually modernizing their seed sectors through international collaborations and technology adoption. These countries are increasingly focusing on developing locally adapted seed varieties while maintaining strong trade relationships with regional seed producers. The emphasis on food security and self-sufficiency has driven investments in seed research and development across these nations, contributing to the top 10 biggest vegetable market in Asia.

Competitive Landscape
Top Companies in Southeast Asia Vegetable Seed Market
The vegetable seed market in Southeast Asia is characterized by intense competition and continuous innovation among key players. Companies are heavily investing in research and development to create new high-yielding varieties with improved traits such as disease resistance, stress tolerance, and better adaptability to local conditions. Product innovation remains a primary focus, with companies regularly launching new seed varieties tailored to regional preferences and climatic conditions. Operational agility is demonstrated through the establishment of local breeding stations, processing facilities, and distribution networks to better serve farmers. Strategic partnerships and collaborations with research institutions and local agricultural bodies have become increasingly common to enhance breeding capabilities and market reach. Companies are also expanding their presence through new research facilities, production units, and acquisition of local seed companies to strengthen their market position and distribution capabilities across Southeast Asia.
Market Structure Shows Mix of Global-Local Players
The Southeast Asian vegetable seed market exhibits a fragmented structure with a mix of global agricultural conglomerates and specialized regional seed companies. Global players leverage their extensive research capabilities and technological expertise, while local companies capitalize on their deep understanding of regional farming practices and established distribution networks. The market demonstrates moderate consolidation, with multinational companies gradually expanding their presence through strategic acquisitions and joint ventures with local seed companies to enhance their regional footprint and access to germplasm.
The competitive dynamics are shaped by the presence of both integrated agricultural companies offering broad product portfolios and specialized seed companies focusing exclusively on vegetable seeds. Market entry barriers are significant due to the need for extensive research capabilities, regulatory compliance requirements, and established distribution networks. The industry has witnessed increasing merger and acquisition activities as companies seek to expand their product portfolios, access new markets, and acquire advanced breeding technologies.
Innovation and Local Adaptation Drive Future Success
Success in the Southeast Asian vegetable seed market increasingly depends on companies' ability to develop locally adapted varieties while maintaining technological leadership. Incumbent companies must focus on strengthening their research and development capabilities, expanding their breeding programs for tropical varieties, and developing seeds with enhanced traits suitable for changing climatic conditions. Building strong relationships with local farming communities, investing in farmer education programs, and establishing efficient distribution networks are crucial for maintaining market share. Companies also need to address the growing demand for organic and sustainable farming practices while ensuring compliance with evolving regulatory requirements.
For contenders looking to gain market share, focusing on specific crop segments or regional markets offers a viable entry strategy. Success factors include developing specialized varieties for protected cultivation, establishing partnerships with local distributors, and investing in digital farming solutions. Companies must also consider the increasing consolidation among commercial farmers and the growing influence of organized retail in driving seed demand. The regulatory environment, particularly regarding variety protection and seed quality standards, continues to evolve, requiring companies to maintain robust compliance programs and adapt their strategies accordingly. Building strong brand recognition through consistent quality and performance remains crucial for long-term success in this competitive market.
Southeast Asia Vegetable Seed Industry Leaders
Bayer AG
East-West Seed
Groupe Limagrain
Rijk Zwaan Zaadteelt en Zaadhandel BV
Syngenta Group
- *Disclaimer: Major Players sorted in no particular order


Recent Industry Developments
- July 2023: Enza Zaden introduced new lettuce varieties that exhibit high resistance to three new Bermian races, namely, Bl: 38EU, Bl: 39EU, and Bl: 40EU. The new lettuce varieties not only offer high resistance to these races but also have the capability to grow in various soil types while still achieving high yields.
- July 2023: Enza Zaden acquired the carrot breeding program from the German company Carosem. This strategic acquisition aims to expand Enza Zaden's product portfolio by incorporating carrot seeds with several commercial varieties and inventories.
- May 2023: Enza Zaden launched a new line of HREZ tomato varieties that are highly resistant to the tomato brown rugose fruit virus (ToBRFV) and deliver exceptional taste, yield, and quality. The HREZ tomatoes are available in various types, including Roma, Beef, Grape, Cherry, and Cocktail.


Southeast Asia Vegetable Seed Market Report Scope
Hybrids, Open Pollinated Varieties & Hybrid Derivatives are covered as segments by Breeding Technology. Open Field, Protected Cultivation are covered as segments by Cultivation Mechanism. Brassicas, Cucurbits, Roots & Bulbs, Solanaceae, Unclassified Vegetables are covered as segments by Crop Family. Indonesia, Myanmar, Philippines, Thailand, Vietnam are covered as segments by Country.Breeding Technology
| Hybrids |
| Open Pollinated Varieties and Hybrid Derivatives |
Cultivation Mechanism
| Open Field |
| Protected Cultivation |
Crop Family
| Brassicas | Cabbage |
| Cauliflower and Broccoli | |
| Other Brassicas | |
| Cucurbits | Cucumber and Gherkin |
| Pumpkin and Squash | |
| Other Cucurbits | |
| Roots and Bulbs | Garlic |
| Onion | |
| Potato | |
| Other Roots and Bulbs | |
| Solanaceae | Chilli |
| Eggplant | |
| Tomato | |
| Other Solanaceae | |
| Unclassified Vegetables | Asparagus |
| Lettuce | |
| Okra | |
| Peas | |
| Spinach | |
| Other Unclassified Vegetables |
Geography
| Indonesia |
| Myanmar |
| Philippines |
| Thailand |
| Vietnam |
| Rest of SouthEast Asia |
| Breeding Technology | Hybrids | |
| Open Pollinated Varieties and Hybrid Derivatives | ||
| Cultivation Mechanism | Open Field | |
| Protected Cultivation | ||
| Crop Family | Brassicas | Cabbage |
| Cauliflower and Broccoli | ||
| Other Brassicas | ||
| Cucurbits | Cucumber and Gherkin | |
| Pumpkin and Squash | ||
| Other Cucurbits | ||
| Roots and Bulbs | Garlic | |
| Onion | ||
| Potato | ||
| Other Roots and Bulbs | ||
| Solanaceae | Chilli | |
| Eggplant | ||
| Tomato | ||
| Other Solanaceae | ||
| Unclassified Vegetables | Asparagus | |
| Lettuce | ||
| Okra | ||
| Peas | ||
| Spinach | ||
| Other Unclassified Vegetables | ||
| Geography | Indonesia | |
| Myanmar | ||
| Philippines | ||
| Thailand | ||
| Vietnam | ||
| Rest of SouthEast Asia | ||


Market Definition
- Commercial Seed - For the purpose of this study, only commercial seeds have been included as part of the scope. Farm-saved Seeds, which are not commercially labeled are excluded from scope, even though a minor percentage of farm-saved seeds are exchanged commercially among farmers. The scope also excludes vegetatively reproduced crops and plant parts, which may be commercially sold in the market.
- Crop Acreage - While calculating the acreage under different crops, the Gross Cropped Area has been considered. Also known as Area Harvested, according to the Food & Agricultural Organization (FAO), this includes the total area cultivated under a particular crop across seasons.
- Seed Replacement Rate - Seed Replacement Rate is the percentage of area sown out of the total area of crop planted in the season by using certified/quality seeds other than the farm-saved seed.
- Protected Cultivation - The report defines protected cultivation as the process of growing crops in a controlled environment. This includes greenhouses, glasshouses, hydroponics, aeroponics, or any other cultivation system that protects the crop against any abiotic stress. However, cultivation in an open field using plastic mulch is excluded from this definition and is included under open field.
| Keyword | Definition |
|---|---|
| Row Crops | These are usually the field crops which include the different crop categories like grains & cereals, oilseeds, fiber crops like cotton, pulses, and forage crops. |
| Solanaceae | These are the family of flowering plants which includes tomato, chili, eggplants, and other crops. |
| Cucurbits | It represents a gourd family consisting of about 965 species in around 95 genera. The major crops considered for this study include Cucumber & Gherkin, Pumpkin and squash, and other crops. |
| Brassicas | It is a genus of plants in the cabbage and mustard family. It includes crops such as carrots, cabbage, cauliflower & broccoli. |
| Roots & Bulbs | The roots and bulbs segment includes onion, garlic, potato, and other crops. |
| Unclassified Vegetables | This segment in the report includes the crops which don’t belong to any of the above-mentioned categories. These include crops such as okra, asparagus, lettuce, peas, spinach, and others. |
| Hybrid Seed | It is the first generation of the seed produced by controlling cross-pollination and by combining two or more varieties, or species. |
| Transgenic Seed | It is a seed that is genetically modified to contain certain desirable input and/or output traits. |
| Non-Transgenic Seed | The seed produced through cross-pollination without any genetic modification. |
| Open-Pollinated Varieties & Hybrid Derivatives | Open-pollinated varieties produce seeds true to type as they cross-pollinate only with other plants of the same variety. |
| Other Solanaceae | The crops considered under other Solanaceae include bell peppers and other different peppers based on the locality of the respective countries. |
| Other Brassicaceae | The crops considered under other brassicas include radishes, turnips, Brussels sprouts, and kale. |
| Other Roots & Bulbs | The crops considered under other roots & bulbs include Sweet Potatoes and cassava. |
| Other Cucurbits | The crops considered under other cucurbits include gourds (bottle gourd, bitter gourd, ridge gourd, Snake gourd, and others). |
| Other Grains & Cereals | The crops considered under other grains & cereals include Barley, Buck Wheat, Canary Seed, Triticale, Oats, Millets, and Rye. |
| Other Fibre Crops | The crops considered under other fibers include Hemp, Jute, Agave fibers, Flax, Kenaf, Ramie, Abaca, Sisal, and Kapok. |
| Other Oilseeds | The crops considered under other oilseeds include Ground nut, Hempseed, Mustard seed, Castor seeds, safflower seeds, Sesame seeds, and Linseeds. |
| Other Forage Crops | The crops considered under other forages include Napier grass, Oat grass, White clover, Ryegrass, and Timothy. Other forage crops were considered based on the locality of the respective countries. |
| Pulses | Pigeon peas, Lentils, Broad and horse beans, Vetches, Chickpeas, Cowpeas, Lupins, and Bambara beans are the crops considered under pulses. |
| Other Unclassified Vegetables | The crops considered under other unclassified vegetables include Artichokes, Cassava Leaves, Leeks, Chicory, and String beans. |


Research Methodology
Mordor Intelligence follows a four-step methodology in all our reports.
- Step-1: IDENTIFY KEY VARIABLES: In order to build a robust forecasting methodology, the variables and factors identified in Step-1 are tested against available historical market numbers. Through an iterative process, the variables required for market forecast are set and the model is built on the basis of these variables.
- Step-2: Build a Market Model: Market-size estimations for the forecast years are in nominal terms. Inflation is not a part of the pricing, and the average selling price (ASP) is kept constant throughout the forecast period.
- Step-3: Validate and Finalize: In this important step, all market numbers, variables and analyst calls are validated through an extensive network of primary research experts from the market studied. The respondents are selected across levels and functions to generate a holistic picture of the market studied.
- Step-4: Research Outputs: Syndicated Reports, Custom Consulting Assignments, Databases, and Subscription Platforms


