Market Overview
| Study Period | 2020 - 2031 |
|---|---|
| Forecast Data Period | 2026 - 2031 |
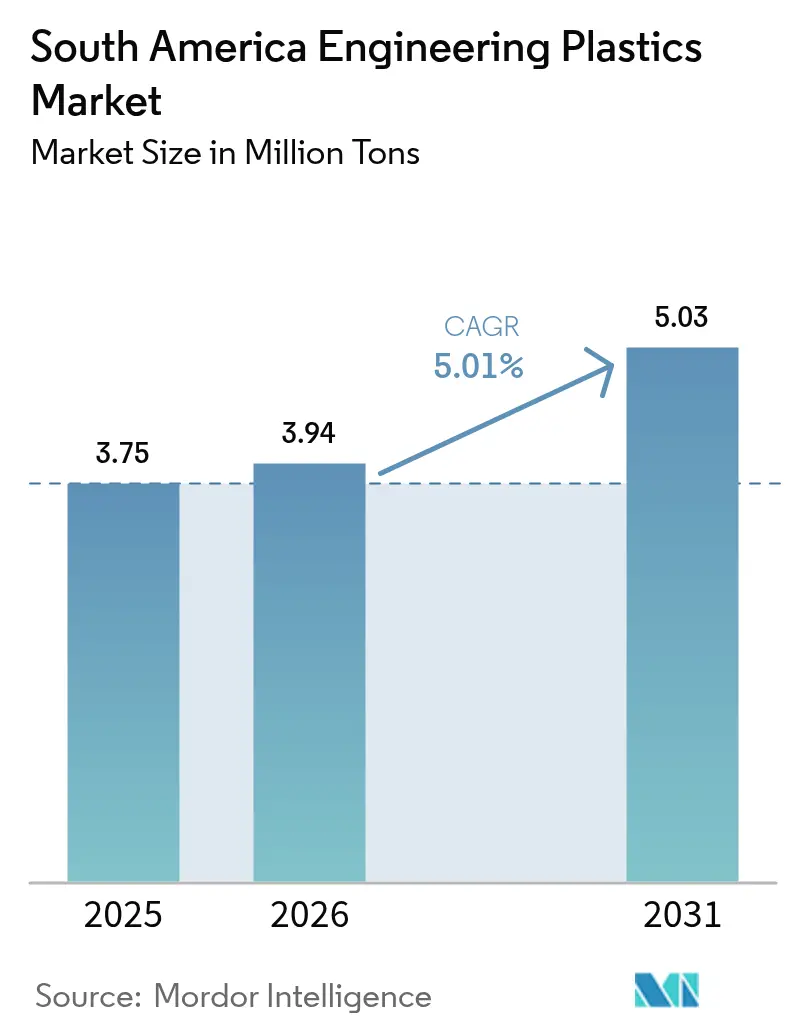
| Base Year Market Size (2025) | 3.75 Million tons |
| Market Volume (2026) | 3.94 Million tons |
| Market Volume (2031) | 5.03 Million tons |
| Growth Rate (2026 - 2031) | 5.01% CAGR |
| Market Concentration | Medium |
Major Players *Disclaimer: Major Players sorted in no particular order Image © Mordor Intelligence. Reuse requires attribution under CC BY 4.0. | |
South America Engineering Plastics Market Analysis by Mordor Intelligence
The South America Engineering Plastics Market size was valued at 3.75 million tons in 2025 and estimated to grow from 3.94 million tons in 2026 to reach 5.03 million tons by 2031, at a CAGR of 5.01% during the forecast period (2026-2031). A supportive policy environment in Brazil, near-shoring of electronics production, and sustained vehicle lightweighting initiatives continue to draw resin producers into the region. Brazil’s 20% tariff regime on polyethylene, polypropylene, PVC, PET, and PMMA preserves domestic feedstock margins even as global oil price volatility pressures cost structures. Simultaneously, Federal Decree No. 12,082/2024 mandates recycled-content thresholds that accelerate investment in traceable collection and reprocessing networks. As converters upgrade formulations to meet chemical resistance and flame retardancy requirements in electric vehicles and connected devices, suppliers shift their portfolios toward bio-based intermediates and specialty grades. Capital inflows into bio-ethylene plants and chemical-recycling assets, therefore, underpin both demand resilience and a gradual pivot away from fossil feedstock dependence.
Key Report Takeaways
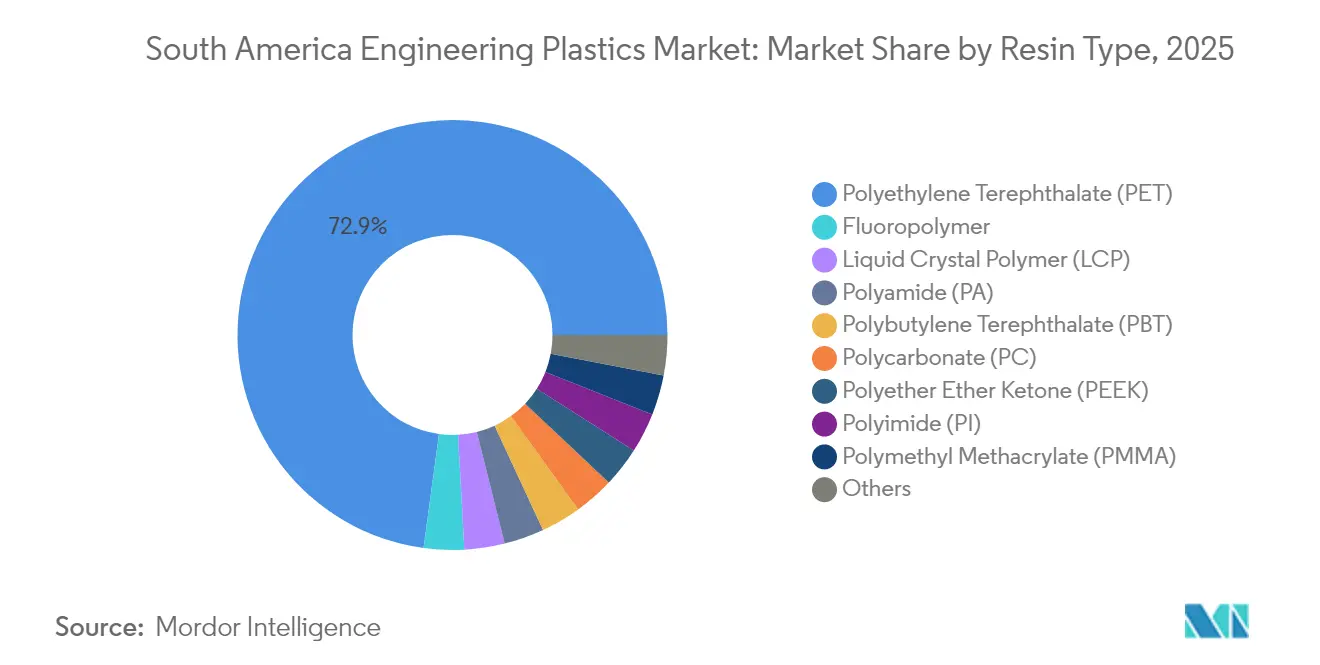
- By resin type, PET commanded 72.85% of the South America engineering plastics market share in 2025, while styrene copolymers are set to rise at a 6.52% CAGR to 2031.
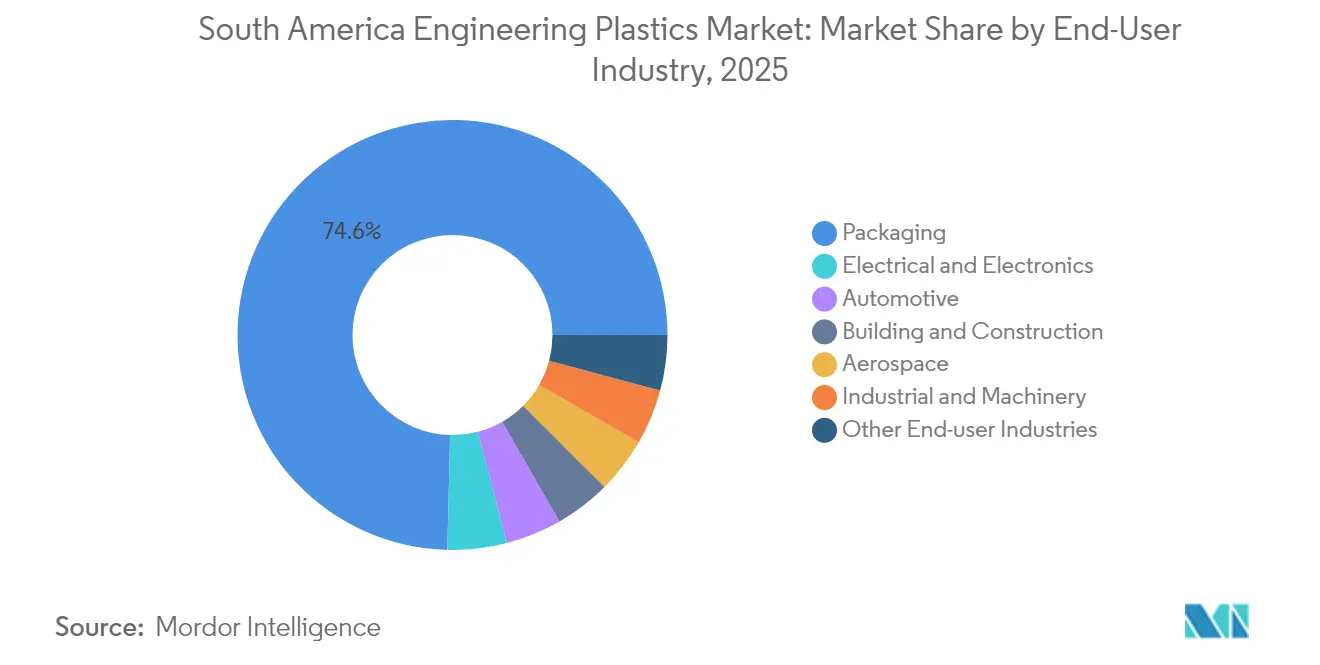
- By end-user industry, packaging held 74.62% of the South America engineering plastics market size in 2025, and electronics is advancing at a 7.29% CAGR through 2031.
- By geography, Brazil controlled 64.88% revenue share of the South America engineering plastics market in 2025; the Rest of South America posts the highest projected CAGR at 5.34% to 2031.
Note: Market size and forecast figures in this report are generated using Mordor Intelligence’s proprietary estimation framework, updated with the latest available data and insights as of 2026.
South America Engineering Plastics Market Trends and Insights
Drivers Impact Analysis*
| Drivers | (~) % Impact on CAGR Forecast | Geographic Relevance | Impact Timeline |
|---|---|---|---|
| Automotive lightweighting demand | +1.5% | Brazil and Argentina core; spillover Colombia | Medium term (2-4 years) |
| Consumer-electronics manufacturing growth | +0.8% | Brazil dominant; emerging Chile and Peru | Short term (≤ 2 years) |
| PET-based packaging expansion | +1.2% | Regional; concentrated Brazil and Argentina | Long term (≥ 4 years) |
| Mercosur tariff support for local resin | +0.9% | Brazil and Argentina primary; Paraguay secondary | Medium term (2-4 years) |
| Biopolymer investment in sugarcane feedstock | +0.9% | Brazil concentrated; spillover regional | Long term (≥ 4 years) |
| Source: Mordor Intelligence | |||


Automotive Lightweighting Demand
Vehicle makers operating in Brazil and Argentina intensify polymer substitution to cut curb weight and satisfy fuel-economy rules. Toyota’s outlay for domestic vehicle platforms and Stellantis’ expansion at Betim lock in multiyear resin off-take agreements for polyamides, polycarbonates, and PBT. Suppliers also report rising call-offs for ethanol-compatible fuel-system components that demand superior chemical resistance. Argentina’s Programa Mover offers tax relief on locally built light vehicles that meet mass-reduction thresholds, channeling new orders toward specialty polymer grades. Component suppliers react by embedding long-fiber reinforcements and bio-fillers, driving specification upgrades that lift average resin value per unit.
Growth in Consumer-Electronics Manufacturing
Smart-device assemblers and printed-circuit fabricators relocate lines to Brazil’s industrial corridors, prompting brisk uptake of precision-moldable polymers. The 7.74% CAGR in electronics volume underscores the momentum behind near-shoring and e-commerce adoption. Sinbon Electronics secured USD 100 million for a new Villa de Reyes complex producing high-speed connectors, each requiring flame-retardant LCP and high-CTI polyamides. FengMei New Energy’s USD 15.6 million site in Aguascalientes will ship high-voltage busbars molded from UL-listed PPS to EV makers. Compliance with RoHS-style directives steers demand toward halogen-free, low-outgassing formulations, further boosting the value mix in the South America engineering plastics market.
Expansion of PET-Based Packaging
PET’s entrenched role in beverage and food systems explains its 73.67% share, yet new regulation dictates rapid evolution. Brazil’s National Solid Waste Policy and the Recircula Brasil traceability platform establish electronic proof-of-recycle and grant tax credits for post-consumer resin. Fiesp notes brand owners paying premiums for content verified under the program, with recycled flake pricing 22% above virgin averages in late 2025[1]Fiesp, “Economia Circular na Indústria,” fiesp.com.br . Argentina is framing an allied EPR law that mirrors Brazil’s tonnage-based targets, signaling a region-wide pull toward r-PET.
Mercosur Tariff Hikes Shielding Local Resin Makers
Braskem captured immediate pricing latitude, funneling windfall margins into its bio-ethylene debottleneck at Triunfo. European majors lobby for relief under the pending EU-Mercosur accord, yet Brussels’ environmental clauses will likely reward producers that demonstrate lifecycle-carbon progress, cushioning Brazil’s position. Local compounders also strategize around the tariff backdrop by boosting blends that displace specialty imports, thereby increasing intra-bloc trade in value-added engineering plastics.
Restraints Impact Analysis*
| Restraints | (~) % Impact on CAGR Forecast | Geographic Relevance | Impact Timeline |
|---|---|---|---|
| Volatile oil-linked feedstock prices | -0.7% | Regional, acute in import-dependent markets | Short term (≤ 2 years) |
| Stricter environmental and recycling mandates | -0.5% | Brazil primary, Argentina secondary | Medium term (2-4 years) |
| Logistics bottlenecks (rail and ports) | -0.3% | Brazil and Argentina core, spillover to Chile | Short term (≤ 2 years) |
| Source: Mordor Intelligence | |||
Volatile Oil-Linked Feedstock Prices
Global crude swings translate swiftly into naphtha and ethane costs, compressing converter margins when pass-through lags. Braskem shifts its slate toward ethane, most regional players still rely on naphtha imports priced against Brent. Exchange-rate turbulence in Argentina magnifies cost spikes, forcing short-term contract adjustments that undercut planning certainty. This volatility curtails discretionary capital spending on new extrusion or injection cells, limiting near-term volume gains in the South America engineering plastics market.
Stricter Environmental and Recycling Mandates
Brazil’s 2024 ordinances require reverse-logistics managing entities and third-party auditors to hold government accreditation, adding compliance fees and IT-tracking overhead. Smaller converters struggle to finance sorting lines and recycled-content verification, prompting consolidation. Chile’s EPR enforcement, updated in 2024, raises minimum recycling thresholds for electronics to 30% by 2027. Collectively, the regulations incrementally add to operating costs and working-capital needs, tempering net demand growth until infrastructure matures.
*Our forecasts treat driver/restraint impacts as directional, not additive. The impact forecasts reflect baseline growth, mix effects, and variable interactions.
Segment Analysis
By Resin Type: PET Dominance Drives Packaging Integration
PET accounted for 72.85% of the South America engineering plastics market share in 2025. Styrene copolymers are forecast to add the largest incremental tonnage, rising at a 6.52% CAGR as appliance housings and vehicle interior trims move to high-gloss ABS. Polyamides are favored for demanding under-the-hood parts due to their resistance to ethanol. Polycarbonate maintains a steady footprint in glazing replacements and 5G infrastructure casings. Fluoropolymers serve as niche binders for chemical processing and lithium batteries, but dollar-per-kilo margins are the highest in the resin basket, securing manufacturer attention despite their low absolute volume.
In the next five years, converters intend to double r-PET utilization rates as Recircula Brasil certified feedstock becomes available, improving circular-content scores on beverage contracts. Specialty compounds blending recycled PET with sugarcane-based IPA aim to preserve mechanical properties while lifting renewable content above 70%. Liquid-crystal polymer and PEEK grades enter value chains for surface-mount device packages and oil-field seals, respectively, reflecting gradual diversification of the South America engineering plastics market.


By End-User Industry: Electronics Surge Challenges Packaging Dominance
Packaging accounted for 74.62% of the South American engineering plastics market size in 2025. Beverage producers spearhead multilayer PET bottle lightweighting, trimming resin per unit while increasing total demand through higher throughput. Electrical and electronics, however, is expanding at a 7.29% CAGR. Converters report strong demand for low-warpage PBT for EV power modules, reflecting deeper integration between mobility and electronics segments.
The automotive industry utilizes engineering plastics, capturing a larger share of value due to its high-performance requirements. Under Programa Mover, Argentina will grant a 1.5% tax credit for vehicles meeting 30 kg weight-reduction benchmarks, directing OEMs toward glass-fiber PA 66. Building and construction sustained a mid-single-digit growth pace, driven by social housing initiatives that favor PVC window frames and polycarbonate sheet skylights. Industrial machinery and agriculture consume wear-resistant POM and PA 12 tubes, while aerospace remains a niche yet influential for ultra-high-spec PEEK and PEI.
Geography Analysis
Brazil generated 64.88% of the South American engineering plastics market size in 2025. The National Circular Economy Strategy requires recycled-content certification across multiple value chains, driving plant retrofits and the adoption of digital tagging. With automotive output on the rise, demand for polymers in structural, battery, and interior components is expected to continue increasing.
Argentina controls nearly 15% of the regional volume but punches above its weight in automotive applications due to its legacy OEM hubs in Córdoba and Rosario. Currency volatility raises import costs for additives and specialty monomers, yet Mercosur preferences keep intra-bloc flows competitive. Chilean miners specify PVDF and PTFE liners for acid-leach circuits, while Peru’s copper-smelter upgrades bring new demand for high-heat PEEK bushings. Colombia channels infrastructure-loan proceeds into telecommunication rollouts, lifting PBT jacket consumption in fiber-optic cables.
Paraguay and Uruguay remain small but strategically important: the Yacyretá dam refurbishment program specifies glass-filled PA for turbine seals, and Uruguay’s green-hydrogen pilots are trialing bio-based PPE housings for offshore electrolyzers. Overall, the geographic mosaic reflects both policy leadership and resource endowment: Brazil’s feedstock and regulatory edge, Argentina’s component depth, and the Andean trio’s mineral-driven capex cycle.
Competitive Landscape
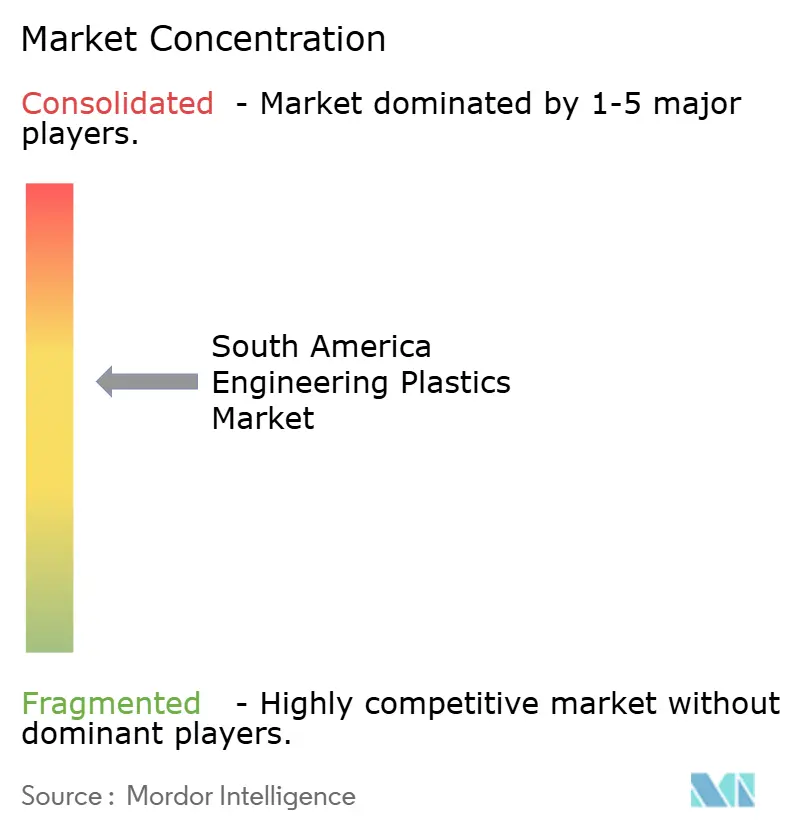
The South America engineering plastics market is moderately consolidated. Braskem wields feedstock integration, holding long-term naphtha and ethanol contracts and operating the only regional cracker capable of both fossil and bio routes. Mid-tier players target fluoropolymer niches, while Grupo Petropack and EngePol compound r-PET blends for food-grade sheet. Sustainability credentials are now decisive: The tariff shield temporarily secures domestic margins, yet impending EU-Mercosur environmental clauses could favor producers showcasing verified carbon savings. Consequently, mergers and acquisitions chatter centers on bolt-on acquisitions that add chemical-recycling expertise or secure raw feedstock streams.
South America Engineering Plastics Industry Leaders
BASF
Alfa S.A.B. de C.V.
Indorama Ventures Public Company Limited
Koch IP Holdings, LLC
Braskem
- *Disclaimer: Major Players sorted in no particular order

Recent Industry Developments
- February 2025: Arkema announced a 15% PVDF capacity increase at Calvert City, Kentucky, supported by USD 20 million investment and a 2026 start-up, to serve battery and semiconductor demand in the Americas.
- August 2024: AGC Inc. introduced a surfactant-free fluoropolymer process that eliminates fluorinated by-products while preserving key performance attributes.


South America Engineering Plastics Market Report Scope
Aerospace, Automotive, Building and Construction, Electrical and Electronics, Industrial and Machinery, Packaging are covered as segments by End User Industry. Fluoropolymer, Liquid Crystal Polymer (LCP), Polyamide (PA), Polybutylene Terephthalate (PBT), Polycarbonate (PC), Polyether Ether Ketone (PEEK), Polyethylene Terephthalate (PET), Polyimide (PI), Polymethyl Methacrylate (PMMA), Polyoxymethylene (POM), Styrene Copolymers (ABS and SAN) are covered as segments by Resin Type. Argentina, Brazil are covered as segments by Country.By Resin Type
| Fluoropolymer | Ethylenetetrafluoroethylene (ETFE) |
| Fluorinated Ethylene-propylene (FEP) | |
| Polytetrafluoroethylene (PTFE) | |
| Polyvinylfluoride (PVF) | |
| Polyvinylidene Fluoride (PVDF) | |
| Other Sub Resin Types | |
| Liquid Crystal Polymer (LCP) | |
| Polyamide (PA) | Aramid |
| Polyamide (PA) 6 | |
| Polyamide (PA) 66 | |
| Polyphthalamide | |
| Polybutylene Terephthalate (PBT) | |
| Polycarbonate (PC) | |
| Polyether Ether Ketone (PEEK) | |
| Polyethylene Terephthalate (PET) | |
| Polyimide (PI) | |
| Polymethyl Methacrylate (PMMA) | |
| Polyoxymethylene (POM) | |
| Styrene Copolymers (ABS, SAN) |
By End-User Industry
| Aerospace |
| Automotive |
| Building and Construction |
| Electrical and Electronics |
| Industrial and Machinery |
| Packaging |
| Other End-user Industries |
By Geography
| Argentina |
| Brazil |
| Rest of South America |
| By Resin Type | Fluoropolymer | Ethylenetetrafluoroethylene (ETFE) |
| Fluorinated Ethylene-propylene (FEP) | ||
| Polytetrafluoroethylene (PTFE) | ||
| Polyvinylfluoride (PVF) | ||
| Polyvinylidene Fluoride (PVDF) | ||
| Other Sub Resin Types | ||
| Liquid Crystal Polymer (LCP) | ||
| Polyamide (PA) | Aramid | |
| Polyamide (PA) 6 | ||
| Polyamide (PA) 66 | ||
| Polyphthalamide | ||
| Polybutylene Terephthalate (PBT) | ||
| Polycarbonate (PC) | ||
| Polyether Ether Ketone (PEEK) | ||
| Polyethylene Terephthalate (PET) | ||
| Polyimide (PI) | ||
| Polymethyl Methacrylate (PMMA) | ||
| Polyoxymethylene (POM) | ||
| Styrene Copolymers (ABS, SAN) | ||
| By End-User Industry | Aerospace | |
| Automotive | ||
| Building and Construction | ||
| Electrical and Electronics | ||
| Industrial and Machinery | ||
| Packaging | ||
| Other End-user Industries | ||
| By Geography | Argentina | |
| Brazil | ||
| Rest of South America | ||


Market Definition
- End-user Industry - Packaging, Electrical & Electronics, Automotive, Building & Construction, and Others are the end-user industries considered under the engineering plastics market.
- Resin - Under the scope of the study, consumption of virgin resins like Fluoropolymer, Polycarbonate, Polyethylene Terephthalate, Polybutylene Terephthalate, Polyoxymethylene, Polymethyl Methacrylate, Styrene Copolymers, Liquid Crystal Polymer, Polyether Ether Ketone, Polyimide, and Polyamide in the primary forms are considered. Recycling has been provided separately under its individual chapter.
| Keyword | Definition |
|---|---|
| Acetal | This is a rigid material that has a slippery surface. It can easily withstand wear and tear in abusive work environments. This polymer is used for building applications such as gears, bearings, valve components, etc. |
| Acrylic | This synthetic resin is a derivative of acrylic acid. It forms a smooth surface and is mainly used for various indoor applications. The material can also be used for outdoor applications with a special formulation. |
| Cast film | A cast film is made by depositing a layer of plastic onto a surface then solidifying and removing the film from that surface. The plastic layer can be in molten form, in a solution, or in dispersion. |
| Colorants & Pigments | Colorants & Pigments are additives used to change the color of the plastic. They can be a powder or a resin/color premix. |
| Composite material | A composite material is a material that is produced from two or more constituent materials. These constituent materials have dissimilar chemical or physical properties and are merged to create a material with properties unlike the individual elements. |
| Degree of Polymerization (DP) | The number of monomeric units in a macromolecule, polymer, or oligomer molecule is referred to as the degree of polymerization or DP. Plastics with useful physical properties often have DPs in the thousands. |
| Dispersion | To create a suspension or solution of material in another substance, fine, agglomerated solid particles of one substance are dispersed in a liquid or another substance to form a dispersion. |
| Fiberglass | Fiberglass-reinforced plastic is a material made up of glass fibers embedded in a resin matrix. These materials have high tensile and impact strength. Handrails and platforms are two examples of lightweight structural applications that use standard fiberglass. |
| Fiber-reinforced polymer (FRP) | Fiber-reinforced polymer is a composite material made of a polymer matrix reinforced with fibers. The fibers are usually glass, carbon, aramid, or basalt. |
| Flake | This is a dry, peeled-off piece, usually with an uneven surface, and is the base of cellulosic plastics. |
| Fluoropolymers | This is a fluorocarbon-based polymer with multiple carbon-fluorine bonds. It is characterized by high resistance to solvents, acids, and bases. These materials are tough yet easy to machine. Some of the popular fluoropolymers are PTFE, ETFE, PVDF, PVF, etc. |
| Kevlar | Kevlar is the commonly referred name for aramid fiber, which was initially a Dupont brand for aramid fiber. Any group of lightweight, heat-resistant, solid, synthetic, aromatic polyamide materials that are fashioned into fibers, filaments, or sheets is called aramid fiber. They are classified into Para-aramid and Meta-aramid. |
| Laminate | A structure or surface composed of sequential layers of material bonded under pressure and heat to build up to the desired shape and width. |
| Nylon | They are synthetic fiber-forming polyamides formed into yarns and monofilaments. These fibers possess excellent tensile strength, durability, and elasticity. They have high melting points and can resist chemicals and various liquids. |
| PET preform | A preform is an intermediate product that is subsequently blown into a polyethylene terephthalate (PET) bottle or a container. |
| Plastic compounding | Compounding consists of preparing plastic formulations by mixing and/or blending polymers and additives in a molten state to achieve the desired characteristics. These blends are automatically dosed with fixed setpoints usually through feeders/hoppers. |
| Plastic pellets | Plastic pellets, also known as pre-production pellets or nurdles, are the building blocks for nearly every product made of plastic. |
| Polymerization | It is a chemical reaction of several monomer molecules to form polymer chains that form stable covalent bonds. |
| Styrene Copolymers | A copolymer is a polymer derived from more than one species of monomer, and a styrene copolymer is a chain of polymers consisting of styrene and acrylate. |
| Thermoplastics | Thermoplastics are defined as polymers that become soft material when it is heated and becomes hard when it is cooled. Thermoplastics have wide-ranging properties and can be remolded and recycled without affecting their physical properties. |
| Virgin Plastic | It is a basic form of plastic that has never been used, processed, or developed. It may be considered more valuable than recycled or already used materials. |


Research Methodology
Mordor Intelligence follows a four-step methodology in all our reports.
- Step-1: Identify Key Variables: The quantifiable key variables (industry and extraneous) pertaining to the specific product segment and country are selected from a group of relevant variables & factors based on desk research & literature review; along with primary expert inputs. These variables are further confirmed through regression modeling (wherever required).
- Step-2: Build a Market Model: In order to build a robust forecasting methodology, the variables and factors identified in Step-1 are tested against available historical market numbers. Through an iterative process, the variables required for market forecast are set and the model is built on the basis of these variables.
- Step-3: Validate and Finalize: In this important step, all market numbers, variables and analyst calls are validated through an extensive network of primary research experts from the market studied. The respondents are selected across levels and functions to generate a holistic picture of the market studied.
- Step-4: Research Outputs: Syndicated Reports, Custom Consulting Assignments, Databases & Subscription Platforms


