Market Overview
| Study Period | 2017 - 2029 |
|---|---|
| Forecast Data Period | 2025 - 2029 |
| Historical Data Period | 2017 - 2023 |
| Market Size (2025) | USD 0.54 Billion |
| Market Size (2029) | USD 1.07 Billion |
| Growth Rate (2025 - 2029) | 18.48% CAGR |
| Market Concentration | High |
Major Players*Disclaimer: Major Players sorted in no particular order Image © Mordor Intelligence. Reuse requires attribution under CC BY 4.0. | |

South America Electric Bus Market Analysis by Mordor Intelligence
The South America Electric Bus Market size is estimated at 0.54 billion USD in 2025, and is expected to reach 1.07 billion USD by 2029, growing at a CAGR of 18.48% during the forecast period (2025-2029).
South America's electric bus industry is undergoing a transformative phase driven by urbanization and the growing emphasis on sustainable public transport. The region boasts the highest per capita bus usage globally, with approximately 19 million passengers utilizing Bus Rapid Transit (BRT) services across various cities. This extensive public transport network has created a natural foundation for electric bus adoption, as municipalities work to expand transit options into previously underserved areas. The transition to zero-emission buses is further supported by regional cooperation and knowledge-sharing initiatives among major cities, enabling better implementation strategies and operational best practices.
Manufacturing capabilities in South America are expanding rapidly through strategic investments and partnerships. In July 2023, BYD announced a significant investment of BRL 3 billion to establish its first electric vehicle manufacturing plant in Brazil, marking a crucial step in localizing production. This development is complemented by domestic manufacturers entering the electric bus segment, creating a more diverse and competitive market landscape. The increasing local production capacity is expected to reduce import dependencies and create new employment opportunities while fostering technological innovation in the region.
Policy frameworks across South American countries are increasingly aligned with sustainable public transport goals. A notable example is São Paulo's landmark decision in December 2022 to ban diesel buses and commit to deploying 2,600 zero-emission buses by the end of 2024. This policy shift represents a broader regional trend toward establishing clear timelines for transitioning public transport fleets to zero-emission vehicles. Municipal governments are implementing supportive measures, including preferential lanes for electric buses, dedicated electric bus charging infrastructure, and operational subsidies to accelerate adoption.
The industry is witnessing a surge in collaborative initiatives between international manufacturers and local partners to enhance technological capabilities and service networks. These partnerships extend beyond vehicle manufacturing to include electric bus infrastructure development, maintenance services, and driver training programs. The focus on building comprehensive ecosystem support is crucial for ensuring the successful operation of electric bus fleets. Transportation authorities are increasingly adopting data-driven approaches to optimize route planning, charging schedules, and maintenance protocols, leading to more efficient fleet operations and improved service reliability.
South America Electric Bus Market Trends and Insights
Surging demand and government incentives propel South America's electric vehicle market
- Countries like Brazil and Argentina in South America show significant potential in the automobile market. The South American vehicle industry has witnessed notable growth in recent years. Notably, the region has seen a rising demand for electric vehicles (EVs), especially in the passenger car segment. This surge can be attributed to factors like heightened awareness, growing environmental concerns, and governmental initiatives promoting EV adoption. In fact, EV sales in the region saw a notable increase, growing by 17.95% in 2022 compared to 2021.
- South America, with its diverse markets, is poised for a surge in electric vehicles. Brazil, in particular, is eyeing a shift toward electric buses, driven by its focus on renewable power generation and its abundant reserves of niobium and lithium, crucial for EV battery development. A significant move in this direction came in December 2022 when Sao Paulo banned diesel bus purchases and announced plans to deploy 2600 electric buses by 2024-end. Similar trends in other South American nations are expected to drive vehicle electrification from 2024 to 2030.
- Government policies and incentive programs across South American nations are set to be key drivers for vehicle electrification in the region. Tax benefits, for instance, are playing a pivotal role. Colombia's government, for instance, is leveraging incentives and subsidies with an ambitious target of putting 600,000 EVs on its roads by 2030, aiming to tackle carbon emissions. With similar initiatives anticipated in other South American countries, the sales of EVs are expected to witness a surge from 2024 to 2030.


OTHER KEY INDUSTRY TRENDS COVERED IN THE REPORT
- South America's demographic narrative, represented by Brazil and Colombia, showcases a story of consistent growth, with Brazil experiencing a pronounced surge
- Brazil and Colombia are expected to see an increase in consumer spending for vehicle purchases (CVP), indicating a recovering automotive market and growing consumer confidence
- From 2017 to 2022, South American auto loan interest rates unveiled a diverse economic landscape. Argentina's rates, marked by turbulence, underscore the nation's economic instability. Meanwhile, Brazil's rates, though initially high, witnessed a decline, signaling stabilization efforts. In contrast, Colombia's rates remained moderate, mirroring an upward trajectory in its economic conditions
- South America is steadily building its EV infrastructure, with both slow and fast charging stations witnessing significant growth
- South America's electrification in the automotive sector shows fluctuating trends across vehicle segments
- The South American market for medium and heavy-duty hybrid and electric buses is showing signs of recovery after a period of decline. The recent production volume of 31,777 units indicates a renewed interest in sustainable transportation
- During 2017-2030, Brazil and Colombia displayed contrasting economic paths. While both faced downturns around 2020, Brazil's GDP per capita showed recovery by 2023, whereas Colombia witnessed a slight decline
- Projections indicate a trend toward economic stabilization and controlled inflation in the region, highlighting a concerted push to restore equilibrium and foster growth
- South American MaaS Sector: The shared mobility sector is witnessing a surge in opportunities and showcasing remarkable resilience
- South America’s surging demand for electric vehicle batteries: falling costs and strategic alliances
- South America witnessed significant fluctuations in diesel and gasoline prices due to the influence of external factors
Segment Analysis: Fuel Category
BEV Segment in South America Electric Bus Market
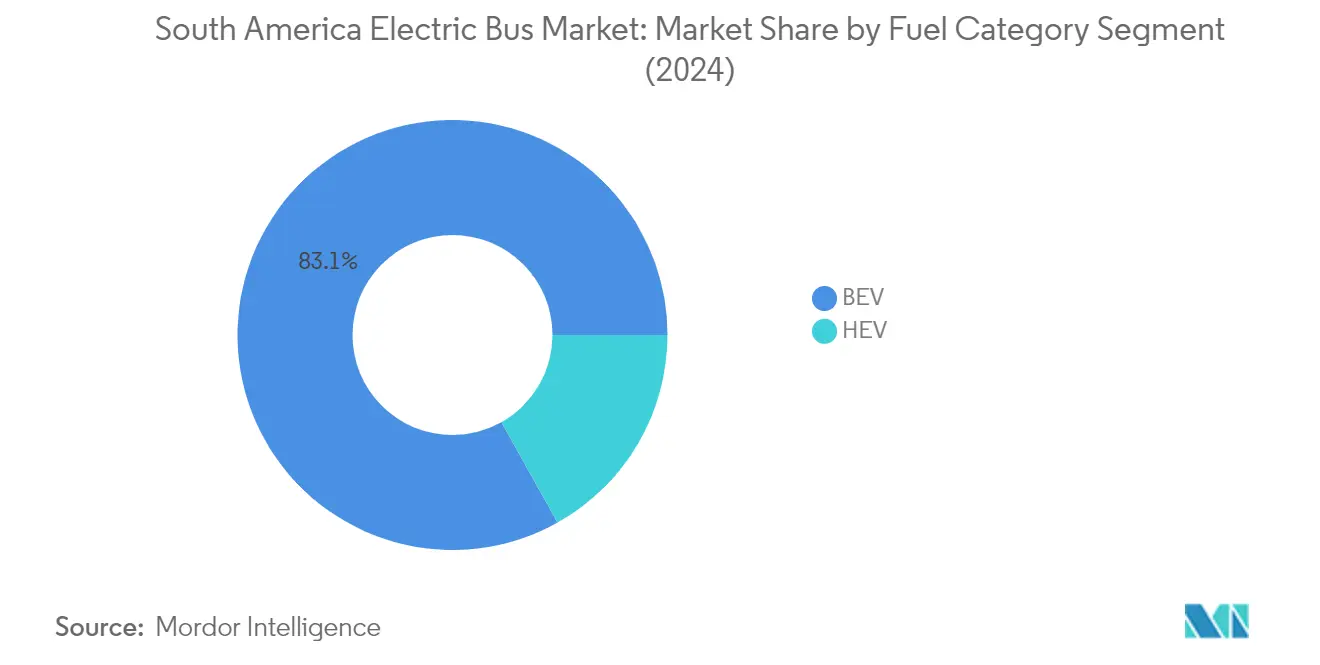
Battery Electric Vehicles (BEVs) have emerged as the dominant force in the South American electric bus market, commanding approximately 83% market share in 2024. This overwhelming market leadership can be attributed to several factors, including substantial government incentives promoting zero-emission vehicles, lower operational costs compared to traditional buses, and growing environmental consciousness among transit authorities. The segment's growth is further bolstered by expanding electric bus charging infrastructure across major South American cities, particularly in Brazil and Argentina. Additionally, municipalities are increasingly favoring BEVs for their public transportation fleets due to their superior performance in reducing urban air pollution and meeting stringent emission regulations. The segment is also benefiting from technological advancements in battery electric bus technology, leading to improved range capabilities and reduced charging times, making BEVs increasingly attractive for both urban and intercity routes.

HEV Segment in South America Electric Bus Market
The Hybrid Electric Vehicle (HEV) segment in the South American electric bus market represents a strategic transition option for operators seeking to balance environmental benefits with operational flexibility. These vehicles offer advantages such as reduced fuel consumption and lower emissions compared to conventional buses, while maintaining the reliability of having a backup power source. The segment is particularly appealing in regions where charging infrastructure is still developing or in routes requiring extended range capabilities. Transit authorities are increasingly recognizing HEVs as a practical stepping stone toward full electrification, especially in areas where immediate transition to full electric buses may present logistical challenges. The technology's ability to operate in diverse conditions and terrains, coupled with lower initial investment compared to full electric buses, makes it an attractive option for many operators in the region. Furthermore, the integration of electric bus components and electric bus powertrain systems enhances the operational efficiency and adaptability of HEVs.
South America Electric Bus Market Geography Segment Analysis
South America Electric Bus Market in Brazil
Brazil stands as the cornerstone of South America's electric bus market, commanding approximately 32% of the regional market share in 2024. The country's dominance is underpinned by its extensive urban transportation network and progressive environmental policies. Major cities like São Paulo are spearheading the transition to electric mobility, implementing ambitious fleet electrification targets. The market's robustness is further strengthened by a well-developed manufacturing ecosystem, with several domestic and international players establishing production facilities. The government's commitment to sustainable urban mobility has created a favorable environment for electric bus adoption, supported by various incentives and regulatory frameworks. Additionally, the presence of established electric bus charging infrastructure networks in key metropolitan areas has helped overcome initial adoption barriers. The market also benefits from strong partnerships between local transport authorities and international electric bus manufacturers, facilitating technology transfer and local expertise development.
Electric Bus Market Growth Trajectory in Brazil
Brazil's electric bus market is projected to maintain a robust growth trajectory, with an expected CAGR of approximately 20% from 2024 to 2029. This remarkable growth is driven by several factors, including increasing urbanization and the growing emphasis on sustainable public transport solutions. The country's rich reserves of lithium and other battery materials position it advantageously in the electric vehicle supply chain. Local manufacturers are expanding their production capabilities, while international players are increasingly viewing Brazil as a strategic hub for South American operations. The market is also benefiting from improving battery technology and decreasing production costs, making battery electric buses more economically viable for operators. Furthermore, the growing public awareness about environmental issues and air quality concerns in urban areas continues to drive demand. The market's expansion is supported by comprehensive government initiatives, including tax incentives and subsidies, aimed at accelerating the transition to electric public transportation.
South America Electric Bus Market in Argentina
Argentina's electric bus market demonstrates significant potential, driven by the country's strong commitment to environmental sustainability and urban air quality improvement. The market benefits from a combination of supportive government policies and growing environmental consciousness among public transport operators. Cities across Argentina are increasingly incorporating electric city buses into their public transportation fleets, recognizing their long-term operational benefits and environmental advantages. The country has developed a comprehensive framework to support electric bus adoption, including infrastructure development and operator training programs. Local transport authorities are actively collaborating with international manufacturers to ensure smooth implementation and maintenance of electric bus fleets. The market also benefits from Argentina's strategic position in the region and its well-established automotive industry infrastructure. Additionally, the country's focus on renewable energy integration aligns well with the expansion of electric bus networks.
South America Electric Bus Market in Rest of South America
The electric bus market in other South American countries, including Chile, Colombia, Peru, and Uruguay, shows varying degrees of development and adoption. These markets are characterized by distinct regulatory environments and different levels of infrastructure readiness. Many of these countries are implementing pilot projects and small-scale deployments to test the viability of electric transit buses in their specific contexts. The success of these initiatives is encouraging broader adoption across the region. Local governments are increasingly recognizing the importance of sustainable urban transportation and are developing supportive policies accordingly. International partnerships and knowledge sharing among South American countries are helping accelerate market development. The region's abundant renewable energy resources provide a strong foundation for the expansion of electric bus networks. Additionally, growing urbanization and increasing environmental awareness are creating favorable conditions for market growth in these countries.

Competitive Landscape
Top Companies in South America Electric Bus Market
The South American electric bus market is characterized by intense competition and rapid technological advancement among key players like BYD Auto, Beiqi Foton, Eletra Industrial, and Volvo Group. Companies are heavily investing in research and development to enhance electric bus battery technology, electric bus charging capabilities, and overall vehicle performance while expanding their product portfolios to meet diverse customer needs. Strategic partnerships with local operators and government bodies have become increasingly common, enabling manufacturers to strengthen their market presence and distribution networks. Operational agility is demonstrated through flexible manufacturing processes and localized production facilities, allowing companies to respond quickly to market demands and regulatory changes. Market leaders are also focusing on expanding their after-sales service networks and providing comprehensive maintenance support to enhance customer satisfaction and build long-term relationships.
Market Dominated by Global Manufacturing Giants
The competitive landscape is primarily dominated by large international manufacturers, particularly Chinese companies that have successfully leveraged their manufacturing expertise and cost advantages to establish strong footholds in South America. These global players have demonstrated their commitment to the region through significant investments in local manufacturing facilities, research centers, and service networks. The market shows moderate consolidation, with the top three players accounting for a significant share, while still leaving room for regional specialists and new entrants to carve out niches in specific geographic areas or specialized vehicle segments.
The market has witnessed several strategic partnerships and joint ventures rather than outright acquisitions, as companies seek to combine their strengths and overcome market entry barriers. Local manufacturers are increasingly forming alliances with global technology providers to enhance their technical capabilities and expand their product offerings. These collaborations often focus on developing market-specific solutions that address the unique challenges and requirements of South American cities, including infrastructure limitations and diverse operating conditions.
Innovation and Localization Key to Success
Success in the South American electric bus market increasingly depends on companies' ability to offer customized solutions while maintaining cost competitiveness. Manufacturers must focus on developing products that specifically address local requirements, including climate conditions, route characteristics, and electric bus infrastructure limitations. Building strong relationships with local authorities and transport operators is crucial, as government policies and public transport initiatives significantly influence market dynamics. Companies must also invest in local supply chains and manufacturing capabilities to reduce costs and improve response times while ensuring compliance with local content requirements.
For new entrants and smaller players, success lies in identifying and serving underserved market segments or regions while building strategic partnerships to overcome scale limitations. Companies must develop comprehensive financing solutions and innovative business models to address the high upfront costs that often deter potential customers. The regulatory environment is expected to become more stringent regarding emissions and safety standards, making it essential for companies to maintain robust research and development capabilities. End-user concentration in major cities and the growing focus on total cost of ownership rather than initial purchase price are reshaping competitive strategies, pushing companies to offer more comprehensive mobility solutions rather than just vehicles, including advancements in electric bus components and electric bus powertrain technologies.
South America Electric Bus Industry Leaders
Beiqi Foton Motor Co. Ltd.
Byd Auto Industry Company Limited
ELETRA Industrial LTDA
Shanghai Sunwin Bus Corporation.Ltd.
Zhengzhou Yutong Bus Co. Ltd.
- *Disclaimer: Major Players sorted in no particular order


Recent Industry Developments
- September 2023: Volvo Energy signed a letter of intent with Connected Energy with the ambition to jointly develop a battery energy storage system (BESS).
- September 2023: Yutong announced that it held a shipping ceremony for 87 apron buses exported from China to Saudi Arabia in the Yutong New Energy Plant. It is the largest batch of apron buses exported from China.
- September 2023: Volvo Buses signed an agreement with MCV (Manufacturing Commercial Vehicles) for the manufacture of bodies for the Volvo 7900 Electric and Volvo 7900 Electric Artic buses.


South America Electric Bus Market Report Scope
BEV, HEV are covered as segments by Fuel Category. Argentina, Brazil, Rest-of-South America are covered as segments by Country.Fuel Category
| BEV |
| HEV |
Country
| Argentina |
| Brazil |
| Rest-of-South America |
| Fuel Category | BEV |
| HEV | |
| Country | Argentina |
| Brazil | |
| Rest-of-South America |


Market Definition
- Vehicle Type - The category includes Medium and Heavy Duty Buses.
- Vehicle Body Type - This include Bus category.
- Fuel Category - The category exclusively covers electric propulsion systems, including various types such as HEV (Hybrid Electric Vehicles), PHEV (Plug-in Hybrid Electric Vehicles), BEV (Battery Electric Vehicles), and FCEV (Fuel Cell Electric Vehicles).
| Keyword | Definition |
|---|---|
| Electric Vehicle (EV) | A vehicle which uses one or more electric motors for propulsion. Includes cars, buses, and trucks. This term includes all-electric vehicles or battery electric vehicles and plug-in hybrid electric vehicles. |
| BEV | A BEV relies completely on a battery and a motor for propulsion. The battery in the vehicle must be charged by plugging it into an outlet or public charging station. BEVs do not have an ICE and hence are pollution-free. They have a low cost of operation and reduced engine noise as compared to conventional fuel engines. However, they have a shorter range and higher prices than their equivalent gasoline models. |
| PEV | A plug-in electric vehicle is an electric vehicle that can be externally charged and generally includes all-electric vehicles as well as plug-in hybrids. |
| Plug-in Hybrid EV | A vehicle that can be powered either by an ICE or an electric motor. In contrast to normal hybrid EVs, they can be charged externally. |
| Internal combustion engine | An engine in which the burning of fuels occurs in a confined space called a combustion chamber. Usually run with gasoline/petrol or diesel. |
| Hybrid EV | A vehicle powered by an ICE in combination with one or more electric motors that use energy stored in batteries. These are continually recharged with power from the ICE and regenerative braking. |
| Commercial Vehicles | Commercial vehicles are motorized road vehicles designed for transporting people or goods. The category includes light commercial vehicles (LCVs) and medium and heavy-duty vehicles (M&HCV). |
| Passenger Vehicles | Passenger cars are electric motor– or engine-driven vehicles with at least four wheels. These vehicles are used for the transport of passengers and comprise no more than eight seats in addition to the driver’s seat. |
| Light Commercial Vehicles | Commercial vehicles that weigh less than 6,000 lb (Class 1) and in the range of 6,001–10,000 lb (Class 2) are covered under this category. |
| M&HDT | Commercial vehicles that weigh in the range of 10,001–14,000 lb (Class 3), 14,001–16,000 lb (Class 4), 16,001–19,500 lb (Class 5), 19,501–26,000 lb (Class 6), 26,001–33,000 lb (Class 7) and above 33,001 lb (Class 8) are covered under this category. |
| Bus | A mode of transportation that typically refers to a large vehicle designed to carry passengers over long distances. This includes transit bus, school bus, shuttle bus, and trolleybuses. |
| Diesel | It includes vehicles that use diesel as their primary fuel. A diesel engine vehicle have a compression-ignited injection system rather than the spark-ignited system used by most gasoline vehicles. In such vehicles, fuel is injected into the combustion chamber and ignited by the high temperature achieved when gas is greatly compressed. |
| Gasoline | It includes vehicles that use gas/petrol as their primary fuel. A gasoline car typically uses a spark-ignited internal combustion engine. In such vehicles, fuel is injected into either the intake manifold or the combustion chamber, where it is combined with air, and the air/fuel mixture is ignited by the spark from a spark plug. |
| LPG | It includes vehicles that use LPG as their primary fuel. Both dedicated and bi-fuel LPG vehicles are considered under the scope of the study. |
| CNG | It includes vehicles that use CNG as their primary fuel. These are vehicles that operate like gasoline-powered vehicles with spark-ignited internal combustion engines. |
| HEV | All the electric vehicles that use batteries and an internal combustion engine (ICE) as their primary source for propulsion are considered under this category. HEVs generally use a diesel-electric powertrain and are also known as hybrid diesel-electric vehicles. An HEV converts the vehicle momentum (kinetic energy) into electricity that recharges the battery when the vehicle slows down or stops. The battery of HEV cannot be charged using plug-in devices. |
| PHEV | PHEVs are powered by a battery as well as an ICE. The battery can be charged through either regenerative breaking using the ICE or by plugging into some external charging source. PHEVs have a better range than BEVs but are comparatively less eco-friendly. |
| Hatchback | These are compact-sized cars with a hatch-type door provided at the rear end. |
| Sedan | These are usually two- or four-door passenger cars, with a separate area provided at the rear end for luggage. |
| SUV | Popularly known as SUVs, these cars come with four-wheel drive, and usually have high ground clearance. These cars can also be used as off-road vehicles. |
| MPV | These are multi-purpose vehicles (also called minivans) designed to carry a larger number of passengers. They carry between five and seven people and have room for luggage too. They are usually taller than the average family saloon car, to provide greater headroom and ease of access, and they are usually front-wheel drive. |


Research Methodology
Mordor Intelligence follows a four-step methodology in all its reports.
- Step-1: Identify Key Variables: To build a robust forecasting methodology, the variables and factors identified in Step-1 are tested against available historical market numbers. Through an iterative process, the variables required for market forecast are set and the model is built based on these variables.
- Step-2: Build a Market Model: Market-size estimations for the historical and forecast years have been provided in revenue and volume terms. Market revenue is calculated by multiplying the sales volume with their respective average selling price (ASP). While estimating ASP factors like average inflation, market demand shift, manufacturing cost, technological advancement, and varying consumer preference, among others have been taken into account.
- Step-3: Validate and Finalize: In this important step, all market numbers, variables, and analyst calls are validated through an extensive network of primary research experts from the market studied. The respondents are selected across levels and functions to generate a holistic picture of the market studied.
- Step-4: Research Outputs: Syndicated Reports, Custom Consulting Assignments, Databases & Subscription Platforms.


