South Africa OOH And DOOH Market Size and Share
Market Overview
| Study Period | 2020 - 2031 |
|---|---|
| Forecast Data Period | 2026 - 2031 |
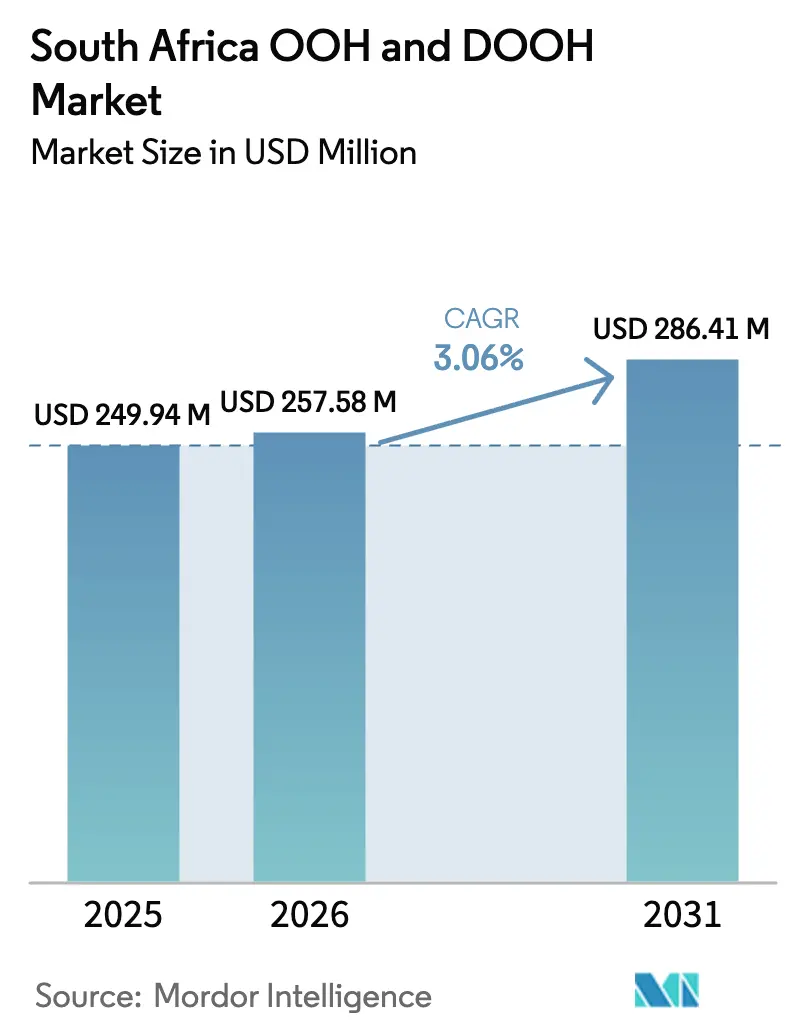
| Base Year Market Size (2025) | USD 249.94 Million |
| Market Size (2026) | USD 257.58 Million |
| Market Size (2031) | USD 286.41 Million |
| Growth Rate (2026 - 2031) | 3.06% CAGR |
| Market Concentration | Medium |
Major Players *Disclaimer: Major Players sorted in no particular order Image © Mordor Intelligence. Reuse requires attribution under CC BY 4.0. | |
South Africa OOH And DOOH Market Analysis by Mordor Intelligence
The South Africa OOH and DOOH market size is projected to expand from USD 249.94 million in 2025 and USD 257.58 million in 2026 to USD 286.41 million by 2031, registering a 2.14% CAGR between 2026 and 2031. Macro-level growth appears modest, yet spending patterns inside the South Africa OOH and DOOH market are shifting quickly as advertisers re-allocate budgets to programmatic digital screens that offer real-time bidding, data-driven targeting, and proof-of-play verification. Traditional roadside billboards still dominate reach, but the rise of integrated bus rapid transit networks, solar-powered LED upgrades that mitigate load-shedding, and retailer-owned in-store media networks are redrawing inventory maps and pricing dynamics. Global platforms such as VIOOH, Broadsign, and Seedooh have onboarded the bulk of premium digital screens, allowing omnichannel buyers to treat programmatic out-of-home as an extension of display, video, and search. At the same time, fragmented panel ownership, cable-theft risks, and frequent power outages temper headline growth and push media owners toward selective digital retrofits rather than greenfield builds.
Key Report Takeaways
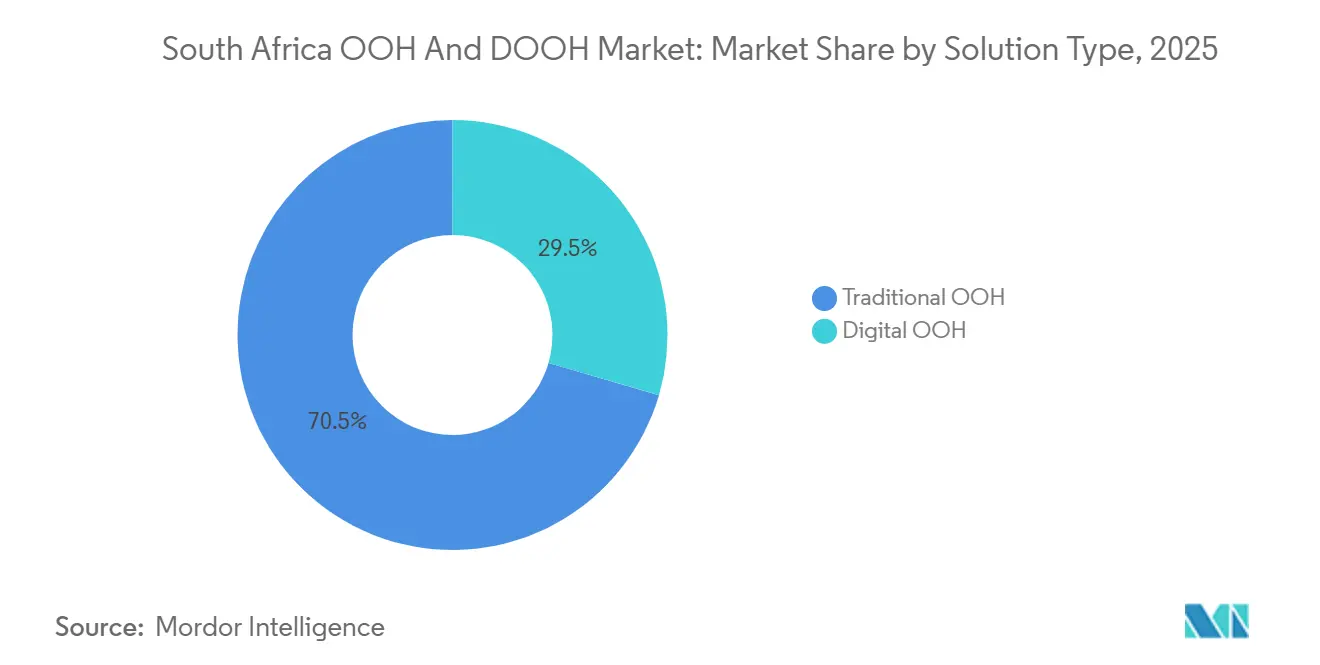
- By solution type, traditional OOH commanded 70.48% of the South Africa OOH and DOOH market share in 2025, while digital OOH is advancing at a 4.17% CAGR through 2031.
- By application, billboards held 44.46% of revenue in 2025, whereas transit formats are forecast to grow at 2.67% CAGR through 2031.
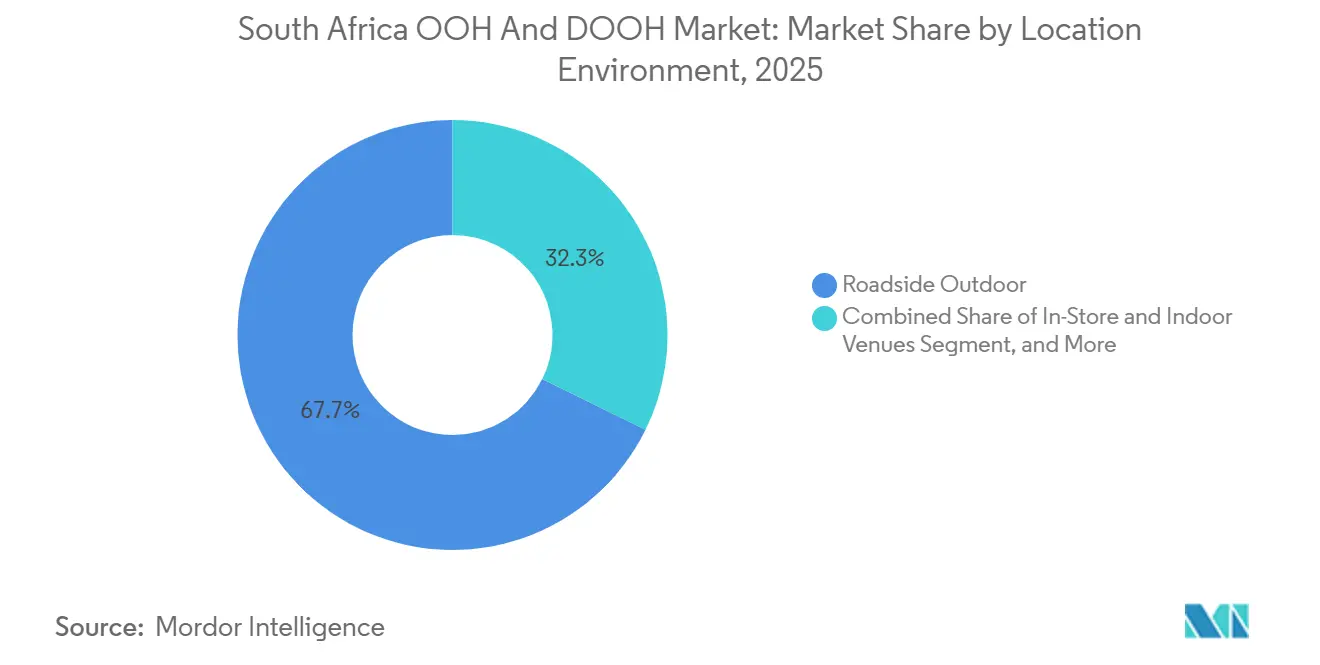
- By location environment, roadside inventory represented 67.74% of 2025 turnover; in-store and indoor venues are expanding at 3.23% CAGR to 2031.
- By end-user industry, retail advertisers accounted for 26.87% of spend in 2025, and media and entertainment is the fastest-growing vertical at 3.46% CAGR to 2031.
Note: Market size and forecast figures in this report are generated using Mordor Intelligence’s proprietary estimation framework, updated with the latest available data and insights as of 2026.
South Africa OOH And DOOH Market Trends and Insights
Drivers Impact Analysis*
| Driver | (~) % Impact on CAGR Forecast | Geographic Relevance | Impact Timeline |
|---|---|---|---|
| Programmatic DOOH Adoption Enabling SME Campaign Flexibility | +0.8% | National, early gains in Gauteng and Western Cape | Medium term (2-4 years) |
| Roll-out of Integrated Rapid Public Transport Networks Elevating Transit DOOH Inventory | +0.5% | Gauteng, Western Cape, KwaZulu-Natal | Long term (≥4 years) |
| Surge in Digital Retail Media Networks Integrating In-Store Screens | +0.4% | National, large retail chains | Medium term (2-4 years) |
| Mobile-Network Derived Audience Measurement Enhancing ROI Proof | +0.3% | National | Short term (≤2 years) |
| Township Mall Expansion Creating High-Dwell-Time Indoor Screens | +0.2% | Gauteng and Western Cape townships | Long term (≥4 years) |
| Mandated Switch to LED Road Signage under 2023 Metro By-laws | +0.1% | Key metros | Long term (≥4 years) |
| Source: Mordor Intelligence | |||
Programmatic DOOH Adoption Enabling SME Campaign Flexibility
Programmatic integrations on more than 170 digital screens let small businesses test 48-hour bursts that previously required six-figure budgets. JCDecaux activated VIOOH trading in 2023, and by late 2025 Tractor Outdoor and Primedia Outdoor had enabled Seedooh-verified proof-of-play, bringing impression-level guarantees that mirror online display.[1]VIOOH Research, “State of the Nation 2024,” VIOOH, viooh.com The model reallocates spend from social networks whenever CPMs favor out-of-home, widening the South Africa OOH and DOOH market beyond legacy blue-chip demand. Agencies confirm that campaigns can now move from briefing to flighting within 24-48 hours, a lead-time reduction that supports product launches, flash sales, and localized calls-to-action.
Roll-out of Integrated Rapid Public Transport Networks Elevating Transit DOOH Inventory
Dedicated bus lanes across Rea Vaya, MyCiTi, and soon-to-launch Go!Durban systems turn fifteen-minute commuter dwell times into premium ad exposures. Transit Ads holds exclusive rights on Johannesburg Route 1B, reaching 80,000 daily passengers whose mobile data confirm high smartphone penetration. Gautrain’s USD 6.5 billion expansion will push rail media into underserved corridors, while new BRT lines bring contract-protected screens that resist inventory commoditization.[2]South African National Roads Agency Limited, “Request for Proposals: Outdoor Advertising Concession,” sanral.co.za
Surge in Digital Retail Media Networks Integrating In-Store Screens
Shoprite’s Rainmaker network leverages 31 million loyalty profiles to trigger basket-level messaging inside 2,676 stores, converting point-of-sale dwell time into measurable upper-funnel reach. Dis-Chem pharmacy pilots show weather-responsive creatives that adjust in real time, improving relevance for health and beauty brands. First-party data gives advertisers frequency caps and sequential storytelling that static roadside boards cannot match.
Mobile-Network Derived Audience Measurement Enhancing ROI Proof
Omnichannel planners increasingly demand cell-tower analytics rather than legacy traffic counts. Provantage’s Protrack system and Road 2.0’s Visibility Adjusted Contacts merge Vodacom, MTN, and Cell C location data with screen logs, allowing advertisers to validate each impression.[3]Out of Home Measurement Council, “ROAD 2.0 Methodology,” omc.org.za Sites without such verification risk exclusion from premium programmatic deals that rely on impression-level audits.
Restraints Impact Analysis*
| Restraint | (~) % Impact on CAGR Forecast | Geographic Relevance | Impact Timeline |
|---|---|---|---|
| Load-Shedding-Driven Screen Downtime Raising Operating Costs | −0.6% | National, acute in major metros | Short term (≤2 years) |
| Fragmented Panel Ownership Impeding Unified Measurement Standards | −0.4% | National | Medium term (2-4 years) |
| Vandalism and Cable-Theft Risks Along Major Highways | −0.3% | Key highway corridors | Medium term (2-4 years) |
| Municipal Moratoria on New Large-Format Sites in Heritage Zones | −0.2% | Johannesburg, Cape Town, Durban | Long term (≥4 years) |
| Source: Mordor Intelligence | |||
Load-Shedding-Driven Screen Downtime Raising Operating Costs
Rolling blackouts force media owners to install diesel or lithium-ion backup systems that add USD 2,750-11,000 to each digital site. MTN spent more than USD 100 million hardening towers in 2024, a template billboard operators must now emulate. Solar retrofits such as Epic Outdoor’s 270-panel array on the N1 prove viable yet capital intensive, and advertisers insert downtime clauses that shift risk back to owners.
Fragmented Panel Ownership Impeding Unified Measurement Standards
Roughly 19 sizeable players push competing metrics, so planners juggle multiple CSV formats and inconsistent impression definitions. While the Out of Home Measurement Council promotes Road 2.0, full adoption lags outside the top three owners. The resulting friction lengthens campaign lead times and constrains scale inside programmatic DSPs.[4]World Out of Home Organization, “Jacques du Preez Joins Global Board,” worldooh.org
*Our forecasts treat driver/restraint impacts as directional, not additive. The impact forecasts reflect baseline growth, mix effects, and variable interactions.
Segment Analysis
By Solution Type: Programmatic Drives Digital Surge
Digital OOH captured 29.52% of 2025 spend and is growing at 4.17% CAGR, buoyed by programmatic guarantees that deliver verified plays and budget fluidity. The South Africa OOH and DOOH market size for digital screens will therefore expand faster than static formats, although load-shedding still incentivizes some advertisers to maintain static placements during power disruptions. Programmatic supply is now integrated into VIOOH, Broadsign, and Adform, so agencies shift money from social video whenever CPMs converge. Traditional OOH remains the volume leader, yet its South Africa OOH and DOOH market share declines incrementally each year as roadside sites convert to LED and plug into exchanges that promise real-time optimization.
Static formats still offer unbeatable geographic reach and require no power, so blue-chip categories committed to long-term brand lift will retain highway domination. However, once Seedooh verification arrived in 2024-25, performance-oriented sectors increasingly treated roadside LED as an upper-funnel extension of online video. As more provincial tenders mandate LED rollouts, media owners that refuse programmatic integration risk sliding down industry rankings.


By Application: Transit Accelerates on BRT Expansion
Billboards generated the largest slice of 2025 revenue, reflecting car-centric travel on the N1, N2, and N3 corridors. Yet transit formats, bus shelters, station concourses, and rail cars, post the fastest growth at 2.67% CAGR because they capture audiences with 15-minute dwell times inside controlled environments. Advertisers favor daypart scheduling that aligns creative with morning commutes or late-afternoon returns, a capability static roadside units cannot replicate.
Transit inventory also benefits from exclusive, multi-year municipal concessions that discourage oversupply and keep CPMs resilient. The Gautrain expansion and Go!Durban build-out will lift transit’s South Africa OOH and DOOH market size steadily during 2026-2031, while airport, stadium, and event formats add niche but lucrative touchpoints for premium brands.
By Location Environment: Indoor Venues Climb on Retail Media
Roadside screens accounted for 67.74% of 2025 revenue, a testament to high car ownership and economic hubs linked by expressways. Nonetheless, in-store and mall networks are scaling at 3.23% CAGR because retailers monetize captive checkout lines and loyalty data. The South Africa OOH and DOOH market share held by indoor venues edges up yearly as brands test basket-level targeting, frequency capping, and closed-loop attribution.
Airports, malls, and rail concourses command premium CPMs thanks to audience quality and dwell times. Long-term concessions at Lanseria and Kruger Mpumalanga illustrate how exclusivity underpins pricing. Solar-powered roadside LEDs overcome load-shedding, but indoor venues insulated from weather and vandalism increasingly attract verticals like healthcare, banking, and quick-service restaurants that crave contextual proximity to purchase.

By End-User Industry: Media and Entertainment Outpaces Retail Growth
Retail retained 26.87% of spend in 2025, leveraging seasonal promotions and price-check apps. Yet media and entertainment spend grows at 3.46% CAGR through 2031 as streaming launches, gaming drops, and sports broadcasts demand synchronized cross-channel promotion. Agencies confirm that programmatic DOOH solves reach gaps after walled-garden privacy shifts curtailed social targeting.
Automotive, telecom, and financial services remain heavy roadside buyers, but healthcare and wellness brands adopt pharmacy-based screens to link symptom education with over-the-counter sales. Expect retail to hold the largest absolute slice of South Africa OOH and DOOH market size, but entertainment’s faster trajectory gradually closes the gap, aided by dynamic creative that counts down to premieres.
Geography Analysis
Gauteng commands the highest revenue given Johannesburg and Pretoria’s concentration of highway LEDs, malls that draw more than 10 million monthly visits, and Gautrain rail lines that bundle station digital with train-wrap options. High load-shedding levels inflate operating expenses, yet advertiser density sustains top-tier CPMs and underwrites rapid programmatic adoption. Expanded township malls such as the 19,631 m² Fleurhof Mall, opening in 2026, will add indoor screens that speak to newly banked consumers.
Western Cape ranks second, underpinned by Cape Town’s tourism pull, wine-route traffic, and MyCiTi BRT occupancy. Clearer by-laws and consistent zoning enforcement cut approval timelines, so media owners deploy premium roadside LEDs along the N1 and N2 while avoiding heritage-zone moratoria in the city bowl. Tractor Outdoor and Outdoor Network each added new Paarl and Richards Bay sites in 2025, signaling continued investment beyond metro cores.
KwaZulu-Natal holds the third-largest slice, boosted by Durban beachfront footfall and logistics corridors that carry heavy freight and commuter loads. The eThekwini control map standardizes approvals, and Go!Durban plans suggest a pipeline of rail and bus media opportunities by the late 2020s. Eastern Cape and other provinces trail, but secondary towns witness the first digital rotators as network-derived analytics reduce risk and provincial road agencies tender bundled LED upgrades.
Competitive Landscape
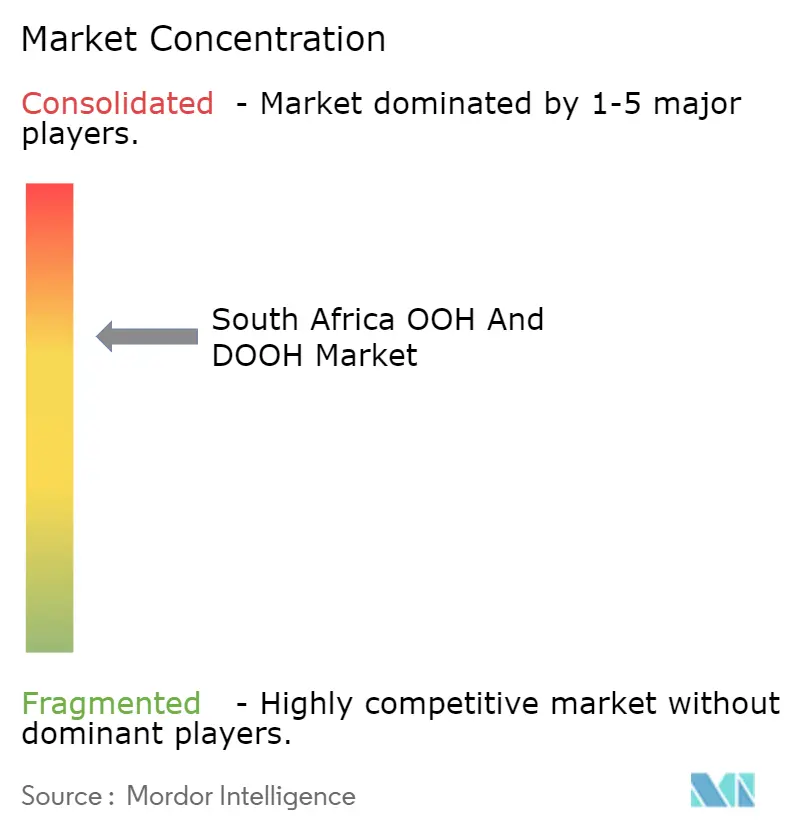
Moderate fragmentation defines the South Africa OOH and DOOH market. JCDecaux, Primedia Outdoor, and Provantage together account for roughly 40-50% of national revenue through long-term airport, rail, and mall concessions. JCDecaux’s 2015 Continental Outdoor acquisition secured dominance over Gautrain assets and key regional airports, while Primedia’s Seedooh-verified screens deliver the transparency agencies now expect.
Regional challengers such as Tractor Outdoor, Outdoor Network, and OOHA Media exploit white-space in secondary towns, township malls, and solar-powered LEDs that sidestep load-shedding. Touch SA Marketing, backed by the Competition Commission’s Economic Development Fund, illustrates how public capital nurtures black-owned entrants inside historically underserved markets.
Technology divides incumbents and laggards. Owners plugged into VIOOH, Broadsign, or Seedooh attract omnichannel spend that shifts from display and video, whereas unverified screens face rate pressure. Consolidation remains muted owing to capital constraints and provincial tender barriers, so expect partnerships around measurement, renewable power, and programmatic trading rather than outright mergers.
South Africa OOH And DOOH Industry Leaders
JCDecaux South Africa
Provantage Media Group
Primedia Outdoor
Outdoor Network (Caxton & CTP)
Tractor Outdoor
- *Disclaimer: Major Players sorted in no particular order

Recent Industry Developments
- January 2026: Tractor Outdoor CEO Steve Duck highlighted five 2026 trends including stricter municipal compliance, the coexistence of direct and programmatic deals, third-party verification growth, deeper audience analytics, and the shift from impressions to attention metrics.
- December 2025: Tractor Outdoor completed Seedooh integration across its digital estate, enabling real-time proof-of-play and automated make-goods.
- September 2025: Outdoor Network switched on a digital rotator in Richards Bay, expanding its network to 22 sites generating 11 million Visibility Adjusted Contacts monthly.
- August 2025: The Competition Commission’s Economic Development Fund reported that Touch SA Marketing used public capital to secure more than 150 township billboard sites in Soshanguve.


South Africa OOH And DOOH Market Report Scope
South Africa’s out-of-home (OOH) and digital out-of-home (DOOH) market typically comprises digital signage providers with digital screens across various locations. They partner with different service providers to utilize their real estate to screen digital advertisements for their clients. The integration of real-time data to digital screens is helping advertisers create more creative and interactive content.
The South Africa OOH and DOOH Market Report is Segmented by Solution Type (Traditional OOH, and Digital OOH [Programmatic-DOOH, and Non-Programmatic-DOOH]), Application (Billboard, Transit, Street Furniture, and Other Applications), Location Environment (Roadside Outdoor, Airports, Malls and Transit Hubs, In-Store and Indoor Venues, and Other Location Environments), End-User Industry (Automotive, Retail, Healthcare, Banking and Financial Services, Media and Entertainment, and Other End-User Industries), and Geography. The Market Forecasts are Provided in Terms of Value (USD).
| Traditional OOH | |
| Digital OOH | Programmatic-DOOH |
| Non-Programmatic-DOOH |
| Billboard |
| Transit |
| Street Furniture |
| Other Applications |
| Roadside Outdoor |
| Airports |
| Malls and Transit Hubs |
| In-Store and Indoor Venues |
| Other Location Environments |
| Automotive |
| Retail |
| Healthcare |
| Banking and Financial Services (BFSI) |
| Media and Entertainment |
| Other End-User Industries |
| By Solution Type | Traditional OOH | |
| Digital OOH | Programmatic-DOOH | |
| Non-Programmatic-DOOH | ||
| By Application | Billboard | |
| Transit | ||
| Street Furniture | ||
| Other Applications | ||
| By Location Environment | Roadside Outdoor | |
| Airports | ||
| Malls and Transit Hubs | ||
| In-Store and Indoor Venues | ||
| Other Location Environments | ||
| By End-User Industry | Automotive | |
| Retail | ||
| Healthcare | ||
| Banking and Financial Services (BFSI) | ||
| Media and Entertainment | ||
| Other End-User Industries | ||


Key Questions Answered in the Report
How large will paid out-of-home advertising in South Africa be by 2031?
It is forecast to reach USD 286.41 million, reflecting the projected South Africa OOH and DOOH market size under a 2.14% CAGR.
Which format is growing fastest through 2031?
Digital OOH, especially transit and in-store networks, posts a 4.17% CAGR, the strongest among major formats.
Why do brands adopt programmatic DOOH in South Africa?
Real-time bidding, audience targeting from mobile data, and independent proof-of-play make programmatic DOOH a flexible complement to online video and social display.
How does load-shedding affect digital screens?
Rolling blackouts add up to USD 11,000 per site for backup power and trigger downtime clauses that squeeze operator margins.
Which province leads outdoor ad revenue?
Gauteng maintains the largest share because of dense highway corridors, major malls, and the Gautrain rail network.
Who are the market leaders?
JCDecaux South Africa, Primedia Outdoor, and Provantage Media Group collectively hold about 40-50% of revenue, while Tractor Outdoor and Outdoor Network lead regional growth.
Page last updated on:


