Market Overview
| Study Period | 2020 - 2031 |
|---|---|
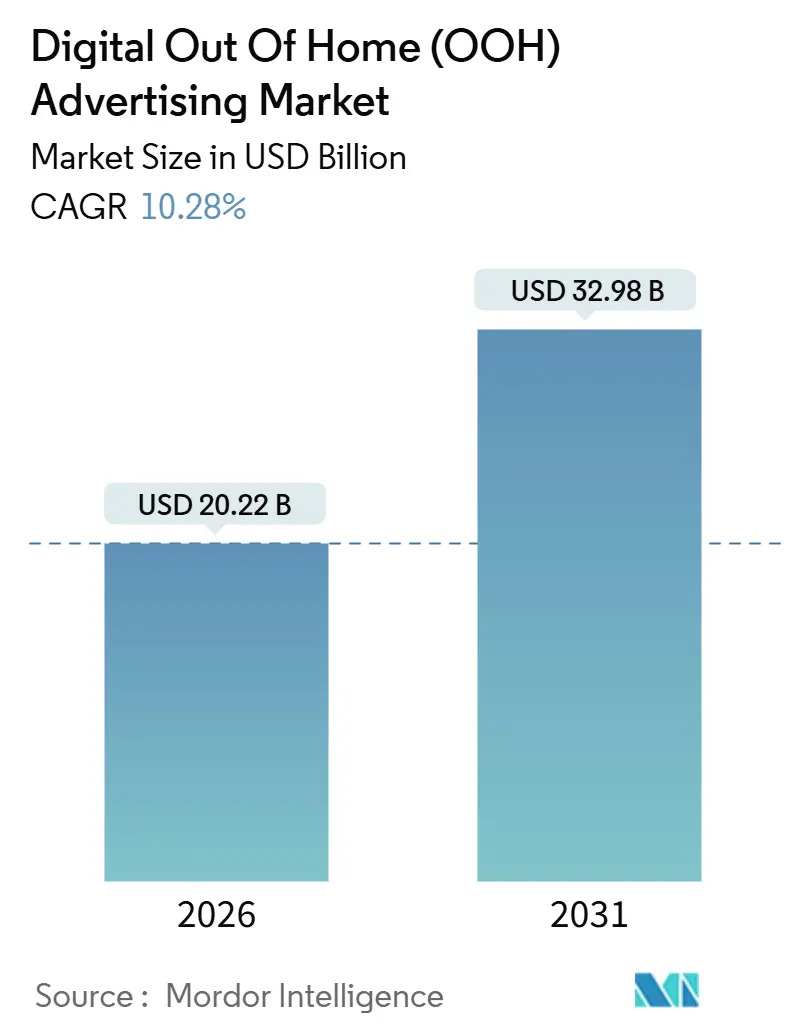
| Market Size (2026) | USD 20.22 Billion |
| Market Size (2031) | USD 32.98 Billion |
| Growth Rate (2026 - 2031) | 10.28% CAGR |
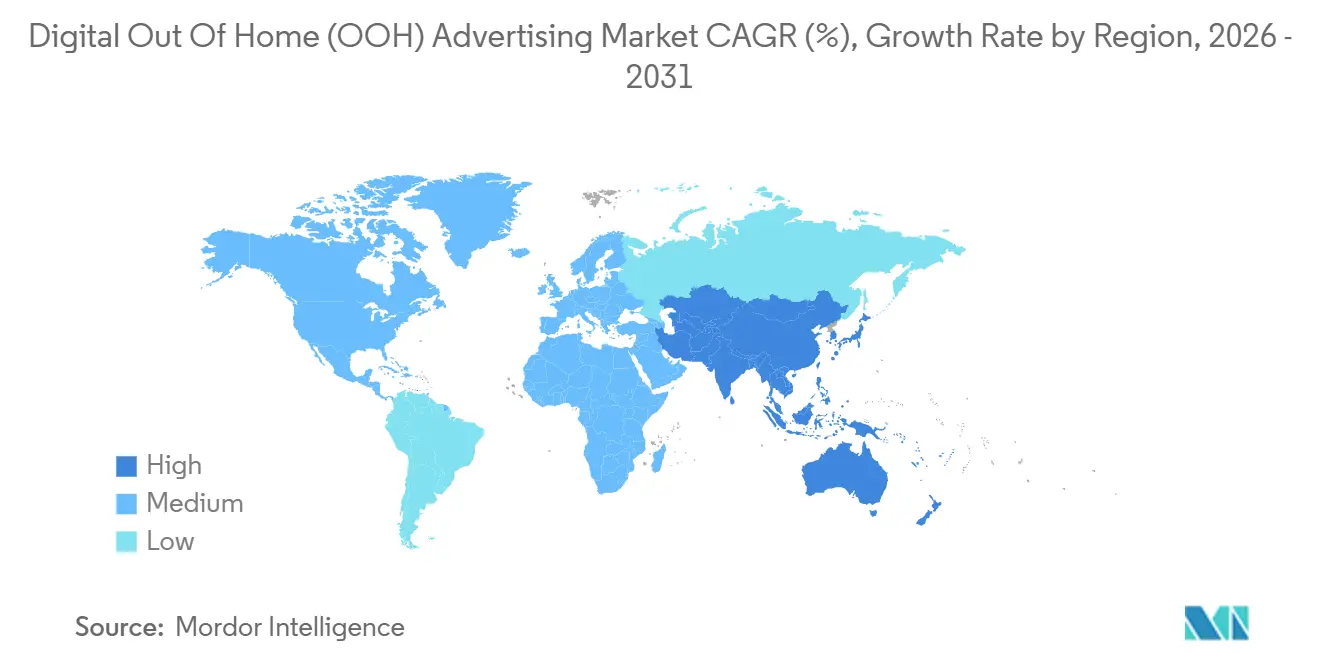
| Fastest Growing Market | Asia Pacific |
| Largest Market | North America |
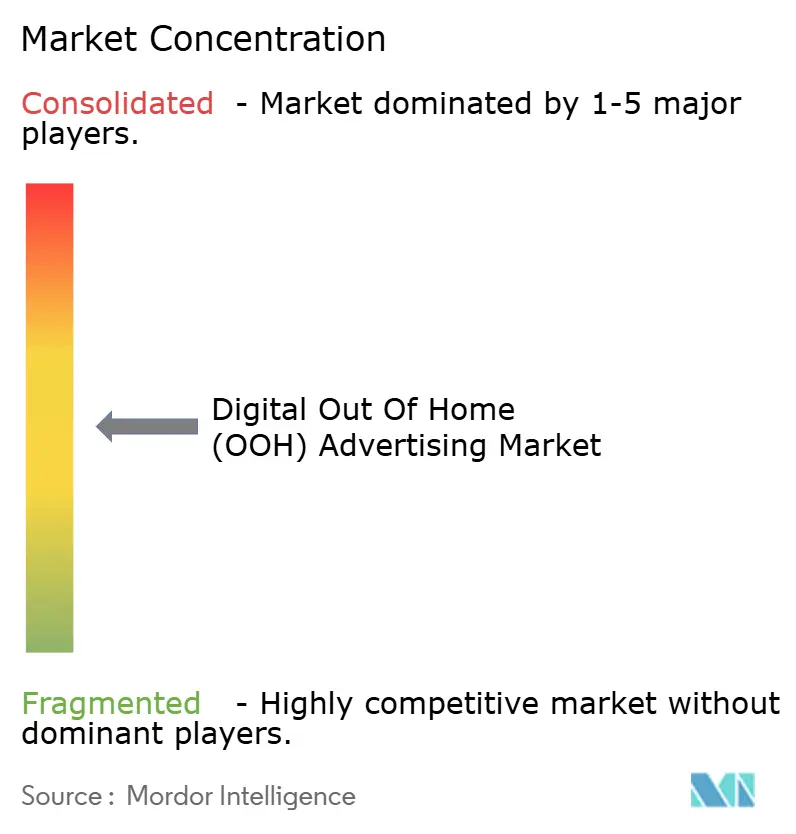
| Market Concentration | Medium |
Major Players *Disclaimer: Major Players sorted in no particular order Image © Mordor Intelligence. Reuse requires attribution under CC BY 4.0. | |
Digital Out Of Home (OOH) Advertising Market Analysis by Mordor Intelligence
The Digital Out Of Home (OOH) Advertising market size reached USD 20.22 billion in 2026 and is projected to advance at a 10.28% CAGR to USD 32.98 billion in 2031. Strengthening 5G coverage, the rollout of programmatic exchanges, and AI-based audience measurement are recasting outdoor screens as performance media channels. Advertisers are shifting awareness budgets toward dynamic placements that allow real-time creative optimization, while municipalities embed digital signage in smart-city infrastructure to offset public-service costs through revenue sharing. LED panel prices continue to decline, lowering entry barriers for smaller operators, while premium CPMs on transit and street-furniture screens attract venture capital into regional networks. However, divergent energy and privacy regulations across regions add compliance costs that favor well-capitalized incumbents and slow the pace of network standardization.
Key Report Takeaways
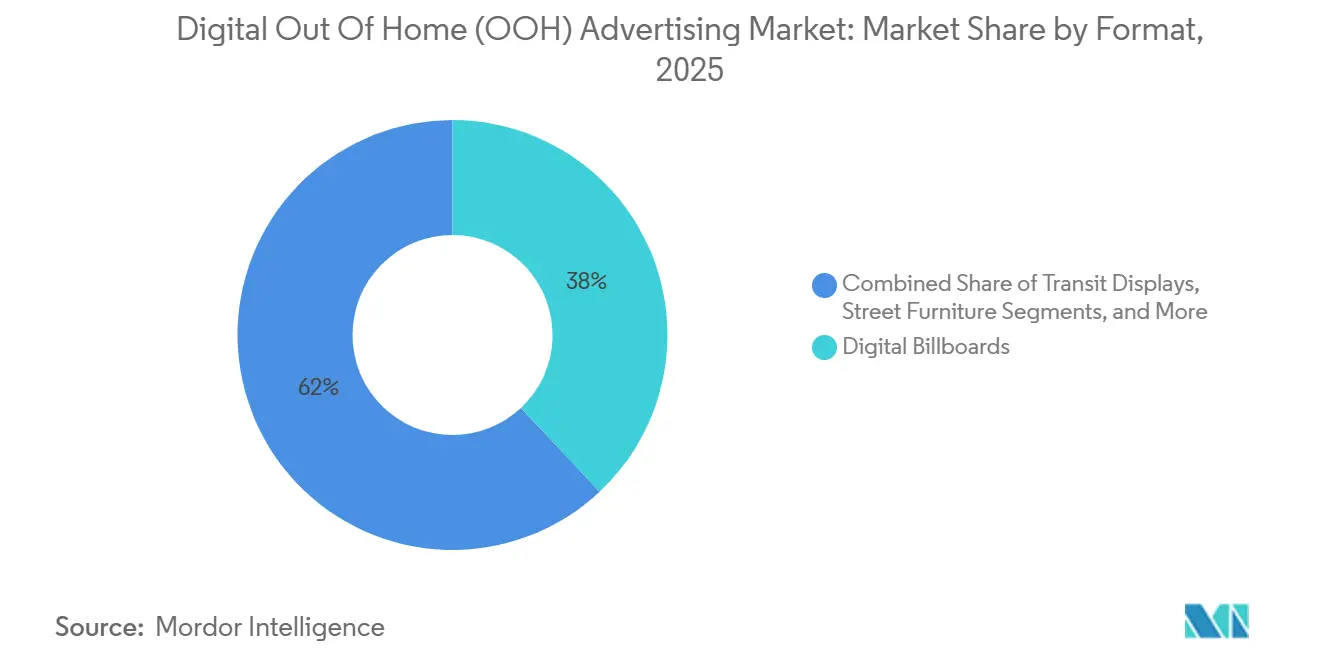
- By format, digital billboards led with 38% revenue share in 2025, while street furniture is forecast to expand at an 11.20% CAGR through 2031.
- By screen technology, LED captured 61% of the 2025 base, whereas projection and other emerging formats are set to grow at a 10.67% CAGR through 2031.
- By location, outdoor installations held 72% of expenditure in 2025, yet indoor networks are projected to rise at a 10.86% CAGR to 2031.
- By end-user vertical, retail accounted for 27% of 2025 spend, while healthcare and pharmaceuticals are positioned for the fastest 11.06% CAGR through 2031.
- By geography, North America commanded 34.50% of 2025 value, whereas Asia-Pacific is expected to post the highest 11.40% CAGR to 2031.
Note: Market size and forecast figures in this report are generated using Mordor Intelligence’s proprietary estimation framework, updated with the latest available data and insights as of January 2026.
Global Digital Out Of Home (OOH) Advertising Market Trends and Insights
Drivers Impact Analysis*
| Driver | (~) % Impact on CAGR Forecast | Geographic Relevance | Impact Timeline |
|---|---|---|---|
| Smart-city investments driving programmatic DOOH uptake in Asia-Pacific | +2.3% | Asia-Pacific, spillover to Middle East and Africa | Medium term (2-4 years) |
| 5G-enabled real-time content delivery boosting highway screen utilization in North America | +1.9% | North America, Western Europe | Short term (≤ 2 years) |
| Retail media network rollouts fueling in-store DOOH adoption in Europe | +2.1% | Europe, North America | Medium term (2-4 years) |
| AI-based audience measurement elevating advertiser ROI in major transit hubs | +1.7% | Global, tier-1 metros | Short term (≤ 2 years) |
| Carbon-neutral LED displays attracting sustainability-focused brands | +0.9% | Europe, North America | Long term (≥ 4 years) |
| Government Mega-Projects Accelerating DOOH Spend in Middle-East Smart Cities | +1.4% | Middle East, spillover to Asia-Pacific | Medium term (2-4 years) |
| Source: Mordor Intelligence | |||
Smart-City Investments Driving Programmatic DOOH Uptake in Asia-Pacific
Municipal authorities in Singapore, Hong Kong, and Vietnam are treating digital kiosks and bus shelters as dual-use assets that deliver civic information and generate advertising revenue. Singapore’s GovTech integrated real-time transit data with 1,200 metro screens, allowing inventory to toggle between way-finding and paid messaging depending on passenger flow.[1]GovTech Singapore, “Open Digital Platform,” TECH.GOV.SG Hong Kong’s Smart City Blueprint 2.0 mandates programmatic ad-serving capability for new public installations, streamlining cross-border buys for regional brands.[2]Hong Kong Government, “Smart City Blueprint 2.0,” SMARTCITY.GOV.HK Hanoi’s 2024 master plan earmarked USD 1.2 billion for 5,000 screens in transit hubs by 2028. Long-tenure concessions encourage operators to finance rapid digitization, compressing payback periods and attracting private equity.
5G-Enabled Real-Time Content Delivery Boosting Highway Screens in North America
Nationwide 5G now covers 87% of the U.S. population, enabling sub-100-millisecond latency that allows billboards to swap creative based on traffic or weather triggers.[3]FCC.GOV Mobile carriers have installed more than 150,000 5G cell sites, many along highway corridors, reducing backhaul costs for operators. Advertisers reward the flexibility with 15-20% higher CPMs compared with 4G-connected inventory. Edge-compute nodes preload multiple creatives, ensuring seamless playback even when demand-side platforms bid in real time.
Retail Media Networks, Roll-Out Fueling In-Store DOOH Adoption in Europe
European grocers are installing large screen grids that tie impression delivery to loyalty-card data. Tesco already manages over 6,000 screens, delivering personalized offers that refresh every 30 minutes. Carrefour’s retail media unit booked EUR 150 million (USD 169 million) in 2024, with in-store DOOH contributing 35% of that figure. IAB Europe projects tripled spend on retail media between 2024 and 2027, citing closed-loop attribution as the main draw. Regulatory demands for transparency under the Digital Services Act further elevate first-party data, encouraging deeper investment in store networks.
AI-Based Audience Measurement Elevating Advertiser ROI in Transit Hubs
Computer-vision sensors capture age, gender, and dwell-time metrics that flow directly into programmatic auctions. Clear Channel Outdoor’s system in 47 airports adjusts CPMs in milliseconds based on passenger mix. IAB standards now require third-party audits of detection accuracy to maintain buyer confidence. Early studies indicate 22% higher brand-lift scores for AI-verified campaigns compared with static placements. Transit authorities are leasing anonymized footfall data, creating a new revenue stream and tightening the link between urban management and commercial media.
Restraints Impact Analysis*
| Restraint | (~) % Impact on CAGR Forecast | Geographic Relevance | Impact Timeline |
|---|---|---|---|
| Municipal energy caps restricting screen brightness hours across EU urban cores | -1.2% | Europe, notably Germany, France, Netherlands | Short term (≤ 2 years) |
| Fragmented measurement standards hindering cross-network programmatic buys in the U.S. | -0.9% | North America, especially U.S. metros | Medium term (2-4 years) |
| Escalating urban land-lease fees raising billboard deployment costs in tier-1 Chinese cities | -0.7% | Asia-Pacific, Beijing, Shanghai, Shenzhen | Medium term (2-4 years) |
| Ad-fraud risks around spoofed pDOOH impressions curtailing global FMCG budgets | -0.6% | Global, programmatic-heavy markets | Short term (≤ 2 years) |
| Source: Mordor Intelligence | |||
Municipal Energy Caps Restricting Screen Brightness Hours Across EU Urban Cores
EU directives require cities to cut public-sector energy use by 1.9% annually, prompting rules that force screens to dim or shut off overnight. Paris mandates shutdown from 1 AM to 6 AM, reducing available inventory by 20% and stripping EUR 45 million (USD 51 million) in yearly revenue from operators.[4]City of Paris, “Digital Signage Ordinance 2024,” PARIS.FR Amsterdam caps brightness at 300 nits in evenings, lowering visibility and pushing advertisers to pricier daytime slots. German municipalities have begun denying permits for new commercial screens, citing environmental concerns. These localized rules fracture the European network, undercutting the scale economies on which programmatic efficiency depends.
Fragmented Measurement Standards Hindering Cross-Network Programmatic Buys in the U.S.
Seventeen distinct audience methodologies complicate impression reconciliation, inflating transaction costs and forcing agencies back to manual insertion orders. Proprietary models create data silos; 62% of U.S. operators rely on non-interoperable systems. Clear Channel Outdoor reported a 14% shortfall in 2024 programmatic growth relative to direct sales, citing impression-delivery disputes. Until cross-network standards emerge, programmatic liquidity will lag, keeping some budgets on hold.
*Our forecasts treat driver/restraint impacts as directional, not additive. The impact forecasts reflect baseline growth, mix effects, and variable interactions.
Segment Analysis
By Format: Street Furniture Gains from Municipal Smart-City Contracts
Street furniture revenue is expected to climb at an 11.20% CAGR through 2031, outpacing all other formats. Concession renewals in London, Paris, and Singapore require operators to install thousands of digital kiosks that provide public Wi-Fi and transit data alongside advertising. This model secures long-term rights while shifting capital costs to private partners, increasing economic resilience against advertising cyclicality. Digital billboards remain dominant in sheer revenue because of 38% share in 2025, but zoning limits hinder fresh deployments near residential areas. Transit displays grow steadily inside metro and airport environments where captive audiences welcome longer dwell-time creative. Venue screens inside gyms, cinemas, and campuses broaden advertiser reach but remain fragmented due to varied ownership structures. As municipalities lean on private funding, the dual public-service and advertising role of street furniture further cements its growth trajectory.
Operators increasingly package street furniture within broader mobility ecosystems, using anonymized sensor data to coordinate public alerts and commercial content. This infrastructure-as-a-service positioning insulates contracts from backlash against pure commercial clutter. In Asia-Pacific, street furniture also serves as a springboard for facial-recognition ticketing pilots, raising privacy debates but enhancing measurement sophistication. The cumulative effect is a format that balances civic utility with commercial upside, making it the centerpiece of many smart-city master plans.


By Screen Technology: LED Dominance Challenged by Projection Innovations
LED held 61% of 2025 revenue thanks to high brightness and falling panel costs, but projection and other technologies are pacing at 10.67% CAGR. Transparent LED tiles allow retailers to overlay digital content on window displays, merging out-of-store reach with in-store engagement. Laser projection and holography create immersive activations in airports and flagship stores without the structural load of heavy panels. Energy-efficient e-paper pilots in Germany consume 99% less power, appealing in cities grappling with energy caps. LCD usage is shrinking outdoors because of glare and power draw, but it retains a niche for menu boards and lobbies where ambient light is controlled.
Advertisers favor novel projection formats for experiential campaigns that generate social-media buzz. PwC research shows these activations deliver more than triple the earned-media value of conventional digital spots. Operators, however, must weigh creative differentiation against maintenance complexity. Diverse hardware fleets demand specialized service teams, increasing overhead. Yet as regulatory pressure intensifies around energy and light pollution, lower-power alternatives could gain share faster than current forecasts suggest.
By Location: Indoor Installations Capture Retail Media Budgets
Indoor networks are predicted to rise at 10.86% CAGR as supermarkets, pharmacies, and clinics monetize dwell time near the point of purchase. Screens tie into point-of-sale systems, allowing real-time creative updates triggered by stock levels and loyalty data. Walgreens generated USD 250 million from its in-store network in 2024, with screens delivering 28% higher conversion than online display, underlining the format’s performance credentials. Outdoor still commands 72% of 2025 spending, thanks to its unmatched reach along arterial roads and transit corridors. However, increasing community complaints about visual pollution and tougher permitting procedures restrict new outdoor capacity.
Indoor environments permit higher resolution, interactive touchpoints, and controlled lighting, making them ideal for AR overlays and QR-code-driven promotions. Healthcare waiting rooms leverage screens for condition-specific content that aligns with patient-engagement mandates, underpinning the 11.06% CAGR in the healthcare vertical. Retailers are integrating advertising revenue into category management decisions, setting CPM floors linked to basket-margin data. This commerce-adjacent integration strengthens the case for on-premise screens, pushing advertisers to allocate higher shares of digital spend inside the store.

By End-User Vertical: Healthcare Leads Growth on Patient-Engagement Mandates
Healthcare and pharmaceuticals is on track for an 11.06% CAGR to 2031, driven by screens in pharmacies, clinics, and hospital corridors. Deloitte research links digital patient engagement to lower no-show rates and improved medication adherence, providing a clinical ROI beyond ad revenue. CVS Health operates more than 9,000 pharmacy screens that combine branded drug promotions with dosage-reminder content, achieving 34% higher recall than brochure racks. Retail conditions still dominate the revenue pool with 27% of 2025 share as grocers push own-label items through in-aisle screens. Financial services and automotive brands pursue affluent commuters in transit hubs, while telecom firms promote bundled digital services during device upgrade cycles. Government bodies use inventory for emergency alerts, reinforcing the public-service narrative that helps justify municipal concessions.
Regulation is moving in step, with U.S. authorities clarifying that anonymized targeting on clinic screens can comply with HIPAA, provided opt-out mechanisms are visible. This guidance unlocks pharmaceutical budgets that were previously cautious about waiting-room media. As telehealth platforms expand, cross-screen retargeting between clinic visits and mobile apps will likely create fresh demand for authenticated audiences within the healthcare ecosystem.
Geography Analysis
North America held 34.50% of value in 2025. Mature programmatic infrastructure, high CPMs in tier-1 metros, and nearly ubiquitous 5G coverage enable dynamic roadside messaging that rivals mobile display in precision. Canadian growth centers on Toronto, Vancouver, and Montreal, where subway concessions fund transit operations. Mexico’s progress is slower because measurement fragmentation deters global buyers, although mall deployments in Mexico City are gaining traction. Regulatory scrutiny of AI audience tracking and measurement standardization remains a headwind, potentially tempering short-term gains.
Asia-Pacific is projected to register an 11.40% CAGR, the highest worldwide. Smart-city blueprints in Singapore, Hong Kong, and Vietnam embed digital signage into public infrastructure, ensuring reliable public funding streams. China’s tier-1 renovation projects are digitizing vast subway and bus networks, although escalating land-lease fees compress operator margins and stimulate consolidation. Japan’s new programmatic marketplace in Tokyo and Osaka provides real-time bidding, attracting multinational advertisers seeking regional scale. India remains nascent but benefits from rapid urbanization and a broad migration from print to digital placements.
Europe’s trajectory hinges on retail media network expansion and evolving regulatory frameworks. Grocers deploy extensive in-store screens tied to loyalty data that satisfy Digital Services Act requirements for advertising transparency. Energy-consumption limits force outdoor operators to dim screens at night, reducing available impressions and shifting spend to indoor environments. Despite these constraints, metro systems in London, Paris, and Berlin continue to digitize, supported by public-private revenue-sharing models. The Middle East and Africa region accelerates through sovereign megaprojects in United Arab Emirates and Saudi Arabia, where urban master plans allocate thousands of screens as part of tourism and transit hubs. South America remains smaller but is picking up pace in Brazil and Chile, with mall and metro projects seeking to counterbalance macroeconomic volatility.

Competitive Landscape
The Digital Out Of Home (OOH) Advertising market features moderate concentration. JCDecaux, Clear Channel Outdoor, and Outfront Media control premium urban inventory, but programmatic exchanges enable smaller operators to pool niche placements and compete on data rather than scale. Incumbents invest heavily in ad-tech platforms and AI measurement to capture transaction fees and widen entry barriers. JCDecaux’s Paris street-furniture renewal secures rights until 2047, assuring inventory supply in one of the most valuable global markets. Clear Channel Outdoor has filed multiple patents for bidding algorithms that link facial-detection insights to CPM floors, signaling a pivot toward technology differentiation.
Retailers are emerging as powerful competitors by launching proprietary in-store networks that bypass traditional outdoor suppliers. These vertically integrated platforms combine point-of-sale data with screen control, offering unmatched attribution and prompting FMCG brands to allocate incremental budgets. Smaller regional operators respond through consortia that share measurement tools and negotiate collective supply-side integrations, yet commercial interests often limit the scope of collaboration. Regulatory oversight on privacy and energy use escalates compliance costs, potentially favoring larger platforms with dedicated legal teams. At the same time, 5G connectivity and edge computing lower technical barriers for new entrants, ensuring competitive churn remains healthy.
Digital Out Of Home (OOH) Advertising Industry Leaders
JCDecaux Group
Clear Channel Outdoor Holdings Inc.
Outfront Media Inc.
Daktronics Inc.
BroadSign International LLC
- *Disclaimer: Major Players sorted in no particular order

Recent Industry Developments
- March 2025: Lamar Outdoor bought Visible Outdoor Advertising, continuing regional consolidation.
- January 2025: JCDecaux renewed a 23-year street-furniture concession with the City of Paris, committing to install 3,500 digital panels by 2027 in return for revenue-sharing to fund public Wi-Fi and transit data.
- November 2024: Clear Channel Outdoor launched Inflight Insights in 47 U.S. airports, layering AI demographic detection onto programmatic auctions for real-time CPM adjustments.
- July 2024: Ströer SE partnered with Tesco to deploy 2,000 screens across UK grocery stores, integrating them into Tesco’s retail media network.


Research Methodology Framework and Report Scope
Market Definitions and Key Coverage
Our study defines the digital out-of-home (DOOH) advertising market as total advertiser spend captured by media owners that operate dynamic, networked screens in public or quasi-public locations, including roadside billboards, transit hubs, street furniture, and place-based venue displays, irrespective of screen technology or sales channel.
Scope Exclusions: Static print faces and purely internal corporate signage are outside the study.
Segmentation Overview
- By Format
- Digital Billboards
- Transit Displays
- Street Furniture
- Place-Based and Venue Screens
- By Screen Technology
- LED
- LCD
- Projection and Other
- By Location
- Outdoor
- Indoor
- By End-User Vertical
- Retail
- Healthcare and Pharmaceuticals
- Financial Services
- Automotive
- Telecom and Utilities
- Government and Public Sector
- Entertainment and Media
- Other End-User Verticals
- By Geography
- North America
- United States
- Canada
- Mexico
- South America
- Brazil
- Argentina
- Rest of South America
- Europe
- Germany
- United Kingdom
- France
- Italy
- Spain
- Rest of Europe
- Asia-Pacific
- China
- Japan
- South Korea
- India
- Rest of Asia-Pacific
- Middle East and Africa
- Middle East
- United Arab Emirates
- Saudi Arabia
- Rest of Middle East
- Africa
- South Africa
- Rest of Africa
- Middle East
- North America
Detailed Research Methodology and Data Validation
Primary Research
We interviewed screen-network operators, media buyers, and location-analytics specialists across North America, Europe, and Asia-Pacific. These discussions validated fill-rate shifts after programmatic rollouts, realistic LED conversion speeds, and region-specific CPM floors, enabling us to close gaps left by desk work.
Desk Research
Mordor analysts began by gathering inventory counts, audience reach, and tariff trends from open sources such as the Outdoor Advertising Association of America, Eurostat transport datasets, and city mobility dashboards, while IMF GDP tables anchored macro outlooks. Trade articles on programmatic CPMs accessed through Dow Jones Factiva and patent clusters scraped via Questel illuminated technology cost curves. Company 10-Ks, investor decks, and municipal tender logs supplied granular yield and conversion ratios. The sources listed are illustrative; many additional references informed data collection and verification.
Market-Sizing & Forecasting
A top-down model starts with global ad spend, isolates OOH share, and then applies DOOH penetration ratios, which are further cross-checked through bottom-up samples of active screens multiplied by median occupancy and CPM. Key variables include urban mobility recovery indices, LED price trends, screen conversion ratios, programmatic share ramps, and regulatory caps on digital faces. A multivariate regression using GDP per capita, retail sales, and smartphone penetration projects 2025-2030 growth, while scenario analysis tests 5G-driven upside. When bottom-up gaps appear, unit counts are interpolated using supplier utilization signals.
Data Validation & Update Cycle
Modeled outputs undergo anomaly checks, peer review, and final sign-off; this is where Mordor Intelligence differentiates. Figures refresh each year, with interim adjustments triggered by material policy moves or major M&A, and a fresh analyst sweep precedes every client delivery.
Why Mordor's Digital Out of Home (DOOH) Advertising Market Baseline Inspires Confidence
Published estimates often diverge because providers choose different screen mixes, rate cards, and refresh cadences. Our disciplined scope alignment, transparent variables, and annual model refresh explain why gaps surface and why users can rely on our baseline.
Key gap drivers include whether indoor venue screens are counted, the assumed speed of static-to-digital conversion, and baseline CPMs in emerging markets, all of which we rigorously document before locking numbers.
Benchmark comparison
| Market Size | Anonymized source | Primary gap driver |
|---|---|---|
| USD 18.18 B (2025) | Mordor Intelligence | |
| USD 23.52 B (2025) | Global Consultancy A | Counts cinema and stadium screens, applies uniform 12 % CAGR |
| USD 31.16 B (2025) | Trade Journal B | Includes indoor retail signage and assumes rapid global screen conversion |
The comparison shows that our restrained scope, evidence-based variables, and iterative validation deliver a balanced, transparent baseline decision-makers can trust.


Key Questions Answered in the Report
What is the size of the Digital Out Of Home (OOH) Advertising market in 2026?
The market is valued at USD 20.22 billion in 2026.
How fast is the Digital Out Of Home (OOH) Advertising market expected to grow through 2031?
It is forecast to record a 10.28% CAGR, reaching USD 32.98 billion by 2031.
Which format is growing quickest inside the Digital Out Of Home (OOH) Advertising market?
Street furniture leads with an 11.20% CAGR outlook as cities integrate digital kiosks and shelters into smart-city contracts.
Why is the healthcare vertical important for Digital Out Of Home (OOH) Advertising?
Healthcare screens meet patient-engagement mandates and are projected to expand at an 11.06% CAGR between 2026 and 2031.
Which region offers the highest growth potential?
Asia-Pacific is set for the fastest 11.40% CAGR due to large-scale smart-city investments and rapid urbanization.
How are energy regulations influencing the European Digital Out Of Home (OOH) Advertising landscape?
Municipal energy caps reduce nighttime brightness hours, cutting available impressions and pushing advertisers toward daytime and indoor screens.
Page last updated on:


