Data Historian Market Size and Share
Market Overview
| Study Period | 2020 - 2031 |
|---|---|
| Market Size (2026) | USD 1.41 Billion |
| Market Size (2031) | USD 1.99 Billion |
| Growth Rate (2026 - 2031) | 7.05% CAGR |
| Fastest Growing Market | Asia Pacific |
| Largest Market | North America |
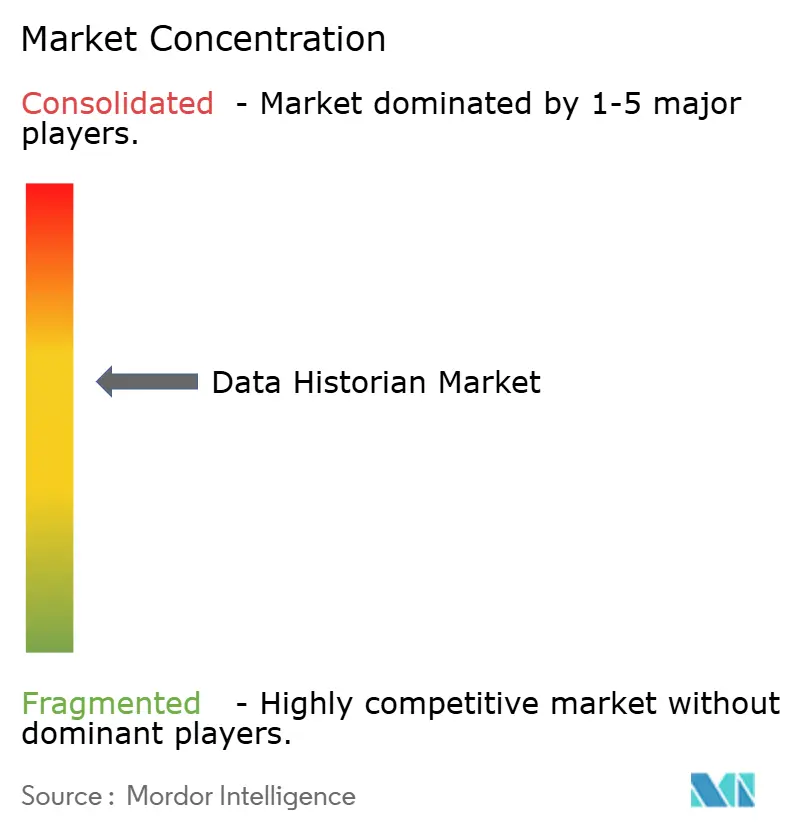
| Market Concentration | Medium |
Major Players *Disclaimer: Major Players sorted in no particular order Image © Mordor Intelligence. Reuse requires attribution under CC BY 4.0. | |
Data Historian Market Analysis by Mordor Intelligence
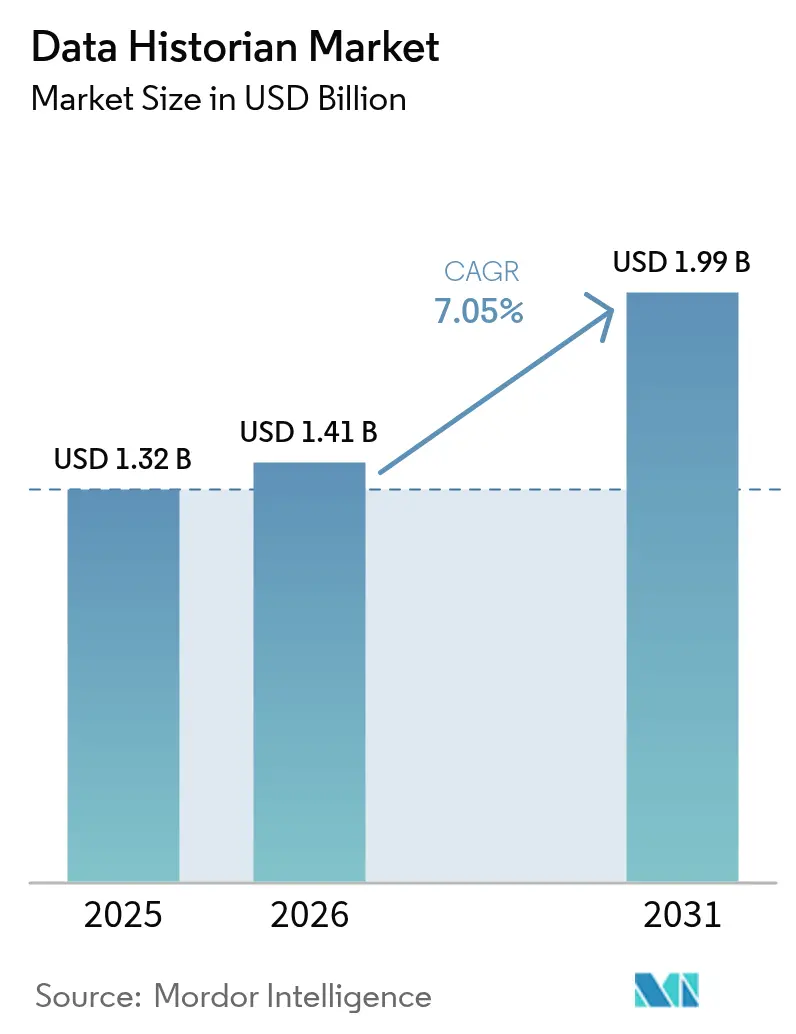
The data historian market size in 2026 is estimated at USD 1.41 billion, growing from 2025 value of USD 1.32 billion with 2031 projections showing USD 1.99 billion, growing at 7.05% CAGR over 2026-2031. Growing convergence of operational-technology and information-technology environments, widespread industrial IoT roll-outs, and the need for real-time analytics are reshaping procurement priorities within the data historian market gevernova. Vendors are modernizing portfolios around cloud-native architectures that scale elastically, support AI/ML workflows, and satisfy stringent cybersecurity mandates. Early adoption across North American oil & gas and power generation facilities validated return-on-investment, while Asia-Pacific manufacturers, unencumbered by legacy systems, are now deploying cloud-first solutions that streamline enterprise-wide visibility. Services revenue is gaining momentum as end users require expert support for historian migration, cybersecurity hardening, and data-governance program design. Finally, competitive intensity has increased as incumbents accelerate M&A to deliver end-to-end data value chains that integrate collection, context, analytics, and visualization.
Key Report Takeaways
- By component, software captured 65.60% of the data historian market share in 2025, while services is projected to grow at 8.85% CAGR through 2031.
- By deployment mode, on-premise led with 70.90% share in 2025; cloud deployment is advancing at an 8.20% CAGR to 2031.
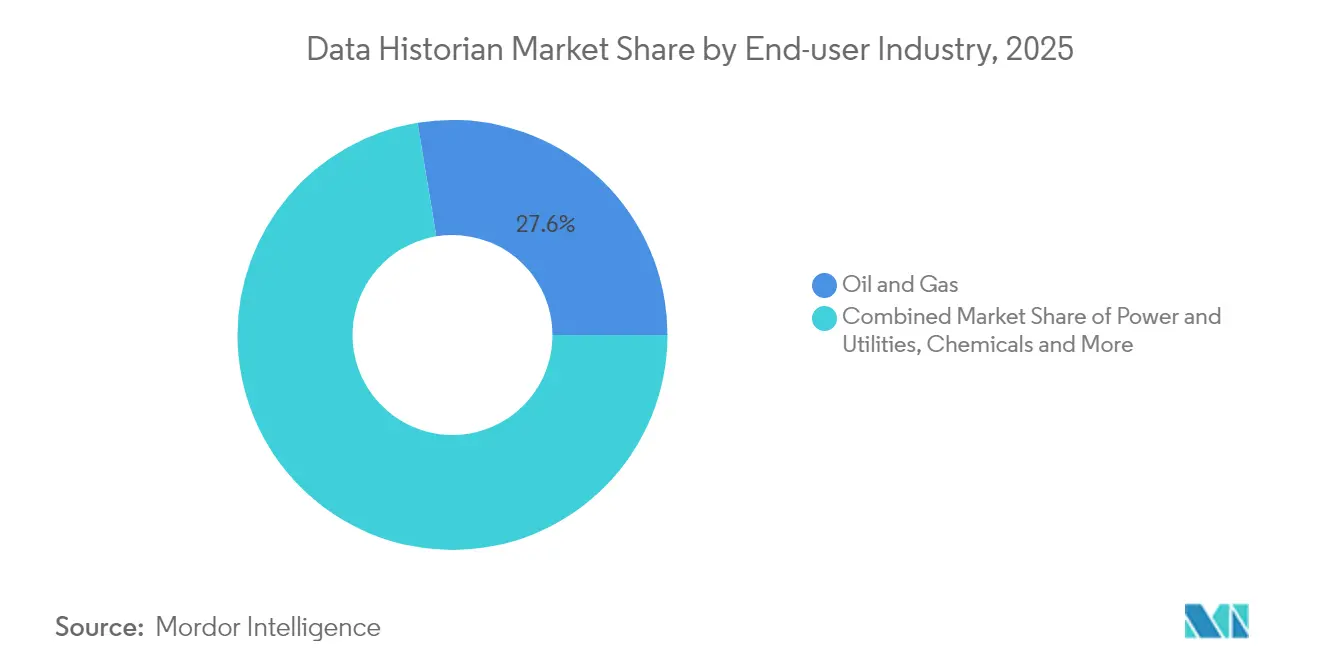
- By end-user industry, oil and gas held 27.60% of the data historian market size in 2025 and data centers are expanding at 8.75% CAGR.
- By data frequency, real-time collection accounted for 51.60% share of the data historian market size in 2025, while near-real-time collection leads growth at 7.65% CAGR.
- By geography, North America commanded 35.10% revenue share in 2025; Asia-Pacific is recording the fastest CAGR at 8.25% through 2031.
Note: Market size and forecast figures in this report are generated using Mordor Intelligence’s proprietary estimation framework, updated with the latest available data and insights as of 2026.
Global Data Historian Market Trends and Insights
Drivers Impact Analysis*
| Driver | (~) % Impact on CAGR Forecast | Geographic Relevance | Impact Timeline |
|---|---|---|---|
| Increasing demand for consolidated data | +1.8% | Global | Medium term (2-4 years) |
| Rising volumes of industrial IoT big data streams | +2.1% | APAC core, spill-over to North America | Short term (≤ 2 years) |
| Migration of legacy historians to cloud-native architectures | +1.5% | North America & EU | Medium term (2-4 years) |
| Vendor bundling of historian inside full-stack OT platforms | +1.2% | Global | Long term (≥ 4 years) |
| Source: Mordor Intelligence | |||
Increasing Demand for Consolidated Data to Optimize Industrial Performance
Manufacturing groups are replacing siloed storage silos with unified historian platforms that merge production, maintenance, and quality datasets. Procter & Gamble’s adoption of GE Vernova’s cloud historian illustrates a 50% reduction in process-setup time through integrated asset and ERP data streams. Contextual data-modeling now automatically links disparate tags, helping operators pinpoint upstream causes of downstream quality deviations and report sustainability metrics with audit-ready lineage.
Rising Volumes of Industrial IoT Big Data Streams
Smart-sensor proliferation is lifting ingestion rates from thousands to millions of tags per second, straining traditional monolithic databases. China’s industrial output expanded 5.6% year-on-year in May 2024, accompanied by a 10.0% surge in high-tech manufacturing, underscoring rapidly growing data loads that require compression algorithms and edge-analytics nodes.[1]National Bureau of Statistics of China, “Industrial Production Operation in May 2024,” stats.gov.cnVendors are responding with containerized micro-services that auto-scale and route non-critical packets to tier-two storage, preserving bandwidth at remote facilities.
Migration of Legacy Historians to Cloud-Native, Micro-Service Architectures
Plants are decommissioning rigid on-premise systems in favor of elastic, API-first platforms that dovetail with AI workbenches. Emerson’s “Project Beyond” epitomizes this shift by embedding software-defined control and historian functions inside a single operations layer.[2]Emerson, “Emerson’s ‘Project Beyond’ to Modernize and Seamlessly Integrate the Industrial Automation Technology Stack,” emerson.com DevOps pipelines now automate deployments, accelerate feature roll-outs, and enforce policy-as-code to satisfy regional data-sovereignty requirements.
Vendor Bundling of Historian Functionality Inside Full-Stack OT Platforms
Automation majors are integrating historian engines into PLCs, HMIs, and industrial PCs to simplify procurement and tighten security domains. Schneider Electric’s Modicon M660 IPC embeds edge analytics alongside motion control, giving users preconfigured historian templates for faster commissioning. Unified stacks reduce interface fragmentation, lower maintenance costs, and enable domain-specific blueprints for life-sciences, chemicals, and utilities.
Restraints Impact Analysis*
| Restraint | (~) % Impact on CAGR Forecast | Geographic Relevance | Impact Timeline |
|---|---|---|---|
| High total cost of ownership for enterprise historian roll-outs | -1.4% | Global | Short term (≤ 2 years) |
| Cybersecurity concerns over exposing OT data | -0.9% | North America & EU | Medium term (2-4 years) |
| Source: Mordor Intelligence | |||
High Total Cost of Ownership for Enterprise-Wide Historian Roll-Outs
End-to-end projects require licenses, specialized hardware, integration services, and ongoing upgrades that can inflate capital outlays by 300%. Rockwell Automation’s FY 2024 results revealed a 21% revenue decline, reflecting hesitation to commit fresh budgets amid macro uncertainty. Hidden costs include tag rationalization, data cleansing, performance tuning, and workforce upskilling, constraining adoption among mid-tier manufacturers.
Cybersecurity Concerns Over Exposing OT Data to IT Networks/Cloud
Converged environments widen attack surfaces, prompting operators to keep mission-critical tags on-premise. ISA’s 2024 white paper highlights gaps between standard IT frameworks and IIoT realities, urging new reference models for edge-cloud protection.[3]International Society of Automation, “ISA White Paper on IIoT Systems Addresses Unique Cybersecurity Needs,” isa.org Sectors under heavy regulation remain cautious until zero-trust architectures, secure tunnels, and deterministic firewalls prove capable of safeguarding service availability.
*Our forecasts treat driver/restraint impacts as directional, not additive. The impact forecasts reflect baseline growth, mix effects, and variable interactions.
Segment Analysis
By Component: Software Dominance Drives Platform Consolidation
Software accounted for 65.60% of the data historian market share in 2025, validating preference for unified suites that blend collection, storage, analytics, and visualization. Vendors increasingly deliver subscription models that bundle time-series compression, asset models, and no-code dashboards, reducing tool sprawl inside plant networks. The services segment is advancing at a 8.85% CAGR through 2031 as operators enlist integration partners for OT-IT convergence, cybersecurity patching, and AI pipeline orchestration. HighByte’s USD 12 million financing round showcased investor appetite for Industrial DataOps services that unlock historian data across multi-vendor fleets.
The data historian market size upside remains tied to managed-services adoption, where providers monetize continuous optimization, model retraining, and regulatory reporting. As customers outsource historian lifecycle management, specialist consultancies deepen domain differentiation in pharmaceuticals, energy, and food & beverage, boosting recurring revenue visibility and reinforcing the platform-plus-services paradigm of the data historian market.


By Deployment Mode: Cloud Acceleration Challenges On-Premise Leadership
On-premise deployments retained 70.90% of the data historian market in 2025 due to latency sensitivity, sovereignty mandates, and ingrained procurement habits in hazardous industries. Plants continue to upgrade rack-mounted appliances, deploy redundant fail-over clusters, and maintain air-gapped backup nodes. Simultaneously, cloud instances are gaining 8.20% CAGR as CIOs pursue elastic capacity, managed security postures, and micro-service agility. Regulatory bodies now publish guidance on hosting process data in approved public regions, diminishing historical barriers.
Hybrid topologies are becoming mainstream in the data historian market as organizations stream low-frequency tags to the cloud while preserving real-time loops locally. Cloud vendors provide edge gateways with deterministic fail-safe modes, encouraging shift-and-lift of historical datasets for AI model training. Over the forecast horizon, total cost of ownership comparisons will continue to favor consumption-based billing, hastening workload migration in discrete manufacturing and fast-growing electrification verticals.
By End-User Industry: Data Centers Emerge as High-Growth Application
Oil & gas held 27.60% of the data historian market size in 2025, leveraging historians for reservoir optimization, emissions compliance, and predictive maintenance across distributed assets. Multi-site macro architectures integrate SCADA alarms, environmental sensors, and vibration analytics, requiring petabyte-scale storage. Conversely, data centers represent the fastest-growing segment at 8.75% CAGR, driven by hyperscale AI clusters seeking thermal-efficiency gains. Siemens has earmarked USD 10 billion for US manufacturing and AI-centric projects to serve this demand.
Rising power densities compel data-center operators to instrument every cooling loop and UPS string, feeding sub-second tags into high-availability historians that forecast hot-spot formation. This shift widens addressable opportunities for vendors offering packaged energy dashboards, carbon accounting modules, and ML-based failure prediction. Adjacent growth stems from chemicals, pharmaceuticals, and utilities modernizing legacy environments to satisfy net-zero pledges and stringent validation reporting.
By Data Frequency: Real-Time Dominance Reflects Operational Criticality
Real-time (sub-second) collection captured 51.60% of the data historian market share in 2025, emphasizing mission-critical process control. Steam crackers, rolling mills, and microelectronics fabs rely on deterministic performance to circumvent safety trips and yield losses. Systems employ memory-resident buffers, lossless compression, and redundant pairs to meet zero-data-loss objectives.
Near-real-time (1 second – 1 minute) feeds are registering 7.65% CAGR through 2031, bolstered by condition-monitoring, batch analytics, and remote diagnostics. Hitachi and NTT’s 600 km real-time synchronization trial demonstrated long-haul data consistency for disaster recovery, validating cross-site historian replication. Batch/periodic polling retains relevance for environmental compliance and quality sampling, yet vendors increasingly unify all frequencies under single tag-licensing models to streamline administration within the data historian market.
Geography Analysis
North America dominates the data historian market with 35.10% share in 2025, underwritten by large installed bases in oil & gas, power generation, and automotive assembly. Federal infrastructure programs and workforce modernization grants accelerate retrofits of aging DCS nodes into API-enabled historians. Siemens’ USD 10 billion investments in Texas and California illustrate how OEM manufacturing and AI data-center growth reinforce domestic demand.
Asia-Pacific delivers the fastest CAGR at 8.25% through 2031 on the back of China’s data-economy blueprint and Japan’s advanced robotics initiatives. Hitachi and Microsoft plan to upskill 50,000 staff in generative-AI methodologies, highlighting the human-capital dimension of historian adoption. Indian policy incentives for semiconductor fabs and electric-vehicle battery plants further enlarge the regional pipeline of green-field historian installations. Also, Beijing’s three-year action plan targets 20% annual data-industry growth and over 300 use-case demonstrations, highlighting strong policy support. Europe maintains steady contributions under reinforced GDPR 2024 mandates that formalize retention, audit, and transfer rules.
Europe records moderate growth as revised GDPR provisions and the Digital Operational Resilience Act compel firms to prove lineage, access controls, and immutability of industrial data. Energy-intensive industries adopt historians to certify carbon-footprint disclosures, while EU investment in hydrogen value chains triggers demand for high-frequency data capture across electrolyzer fleets. Emerging economies in Latin America, Middle East, and Africa remain nascent yet attractive long-term opportunities as they install new process plants without legacy constraints, enabling direct leapfrog to cloud-ready historian topologies within the data historian market.
Competitive Landscape
The data historian market displays moderate concentration as multi-discipline automation vendors embed historian engines into unified OT platforms to defend share against cloud-native challengers. AVEVA, Honeywell, Siemens, and GE Vernova leverage decades of domain knowledge and service footprints, reinforcing customer stickiness through template libraries and lifecycle agreements. Emerson’s buy-out of AspenTech strengthens its software-defined control ambitions, integrating advanced analytics and planning functions into one programmable environment.
Strategic consolidation extends downstream: CAI Software acquired Parsable to merge connected-worker insights with historian data, aiming to reduce mean-time-to-resolution via guided workflows. Start-ups differentiate through open-standards connectors, subscription pricing, and rapid deployment kits that minimize capital expenditure. Competitive success hinges on three capabilities: AI model orchestration, secure edge-to-cloud pipelines, and industry-specific compliance packages. Vendors that master these levers will capture the incremental spend as enterprises transition to predictive, autonomous operations.
Data Historian Industry Leaders
General Electric Company
Siemens AG
ABB Group
Honeywell International Inc.
Emerson Electric Co.
- *Disclaimer: Major Players sorted in no particular order

Recent Industry Developments
- May 2025: Hitachi launched a product traceability solution that unifies historian feeds and no-code device connectivity to strengthen quality and risk management.
- January 2025: Honeywell introduced Batch Historian software, adding contextualized batch records for life-sciences and food-and-beverage compliance.
- January 2025: Honeywell and Danfoss signed an MoU to co-develop automation solutions that resolve data-integration pain points across multi-vendor OT estates.
- September 2024: CAI Software acquired Parsable, adding connected-worker capabilities to its manufacturing execution suite.


Research Methodology Framework and Report Scope
Market Definitions and Key Coverage
Our study defines the data historian market as all commercial software and associated services that capture, compress, store, and retrieve time-stamped operational data from industrial assets, including PLCs, SCADA, DCS, and IIoT sensors, for rapid analysis, visualization, and optimization across process and discrete industries. Coverage spans on-premise, edge, and cloud-native deployments sold on license or subscription models.
Scope exclusion: Generic time-series databases used solely for IT log, website, or consumer-app analytics lie outside our scope.
Segmentation Overview
- By Component
- Software
- Services
- By Deployment Mode
- On-premise
- Cloud
- By End-user Industry
- Oil and Gas
- Power and Utilities
- Chemicals and Petrochemicals
- Pulp and Paper
- Metals and Mining
- Water and Waste-water
- Data Centers
- Food and Beverages
- Pharmaceuticals
- By Data Frequency
- Real-time (<1 sec)
- Near-real-time (1 sec - 1 min)
- Batch / Periodic (>1 min)
- By Geography
- North America
- United States
- Canada
- Mexico
- South America
- Brazil
- Argentina
- Rest of South America
- Europe
- Germany
- United Kingdom
- France
- Italy
- Spain
- Russia
- Rest of Europe
- APAC
- China
- Japan
- India
- South Korea
- Australia and New Zealand
- Southeast Asia
- Rest of APAC
- Middle East
- Saudi Arabia
- UAE
- Turkey
- Rest of Middle East
- Africa
- South Africa
- Egypt
- Nigeria
- Rest of Africa
- North America
Detailed Research Methodology and Data Validation
Primary Research
Mordor analysts interviewed plant digitalization leads, OT integrators, and cloud historian product managers across North America, Europe, and Asia-Pacific. Discussions tested adoption rates, average tag counts, price trajectories, and regional regulatory triggers, letting us refine assumptions that desk sources could not quantify. Follow-up surveys with mid-tier manufacturers validated service attach rates and migration timelines.
Desk Research
We began with public domain benchmarks from sources such as the US Energy Information Administration, Eurostat industrial investment statistics, NIST IIoT program papers, OPC Foundation member studies, and major trade associations for oil and gas and discrete manufacturing. Company filings, 10-Ks, investor decks, and news archived on Dow Jones Factiva and D&B Hoovers added vendor-level revenue clues. Additional context on sensor shipments, controller installs, and cloud uptake was gathered from IEEE journals, patent abstracts pulled through Questel, and customs import codes visible on Volza. These references underpin the baseline yet are not exhaustive; many further publications aided data checks and clarification.
Market-Sizing & Forecasting
A top-down model links the global installed base of industrial controllers to historian penetration and typical annual license value; selective bottom-up supplier roll-ups and channel checks fine-tune totals. Key variables include growth in connected industrial sensors, average license revenue per data tag, cloud historian share, upstream CAPEX in oil and gas, and global data-center floor space. Multivariate regression and scenario analysis project each driver, while gap areas in vendor disclosures are bridged through triangulated ASP times volume proxies.
Data Validation & Update Cycle
Outputs face cross-tab checks against independent production indices and vendor earnings. Senior reviewers interrogate anomalies before sign-off. Reports refresh every twelve months, with interim revisions triggered by material events; a last-mile analyst sweep ensures clients receive the most current view.
Why Mordor's Data Historian Baseline Commands Reliability
Published figures frequently diverge because firms adopt different scope choices, price curves, and refresh cadences.
Our disciplined variable selection and yearly update cadence reduce drift and give decision-makers a balanced anchor.
Benchmark comparison
| Market Size | Anonymized source | Primary gap driver |
|---|---|---|
| USD 1.32 B (2025) | Mordor Intelligence | - |
| USD 1.40 B (2024) | Regional Consultancy A | Omits cloud service fees and near-real-time analytics layers |
| USD 1.45 B (2024) | Global Consultancy B | Blends historian revenue with broader asset-management suites; assumes steeper price erosion |
| USD 1.74 B (2024) | Industry Association C | Adds IoT platform modules and applies aggressive multi-category growth multipliers |
The comparison shows how broader or narrower scopes, unchecked ASP paths, or infrequent updates inflate or compress totals. By anchoring on clear functional boundaries and verified price-volume pairs, Mordor delivers a transparent, reproducible baseline clients can trust.


Key Questions Answered in the Report
What is the current size and projected growth rate of the global data historian market?
The market stands at USD 1.41 billion in 2026 and is expected to reach USD 1.99 billion by 2031, reflecting a 7.05% CAGR.
Which component segment is expanding the fastest?
Services is the quickest-growing component, advancing at a 8.85% CAGR as enterprises seek expert support for OT-IT integration, cybersecurity, and AI enablement.
Why are cloud deployments gaining traction despite on-premise dominance?
Cloud-native platforms offer elastic scalability, automatic updates, and easier integration with modern analytics, driving an 8.20% CAGR even though on-premise still holds 70.90% share.
Which end-user industry shows the strongest growth outlook?
Data centers lead with a 8.75% CAGR through 2031, as hyperscale operators use historian data to optimize cooling, predict failures, and manage rising AI workloads.
What primary factors are boosting adoption of historian platforms?
Key drivers include the need for consolidated operational data, surging industrial IoT data streams, migration to cloud-native architectures, and vendor bundling of historian functions within full-stack OT suites.
How significant are cybersecurity concerns for cloud historian adoption?
Cybersecurity remains a chief restraint, cutting forecast CAGR by 0.9 percentage points as critical-infrastructure operators weigh data-sovereignty and threat-landscape risks before moving OT data to the cloud.
Page last updated on:


