Optical Sorter Market Size and Share
Market Overview
| Study Period | 2020 - 2031 |
|---|---|
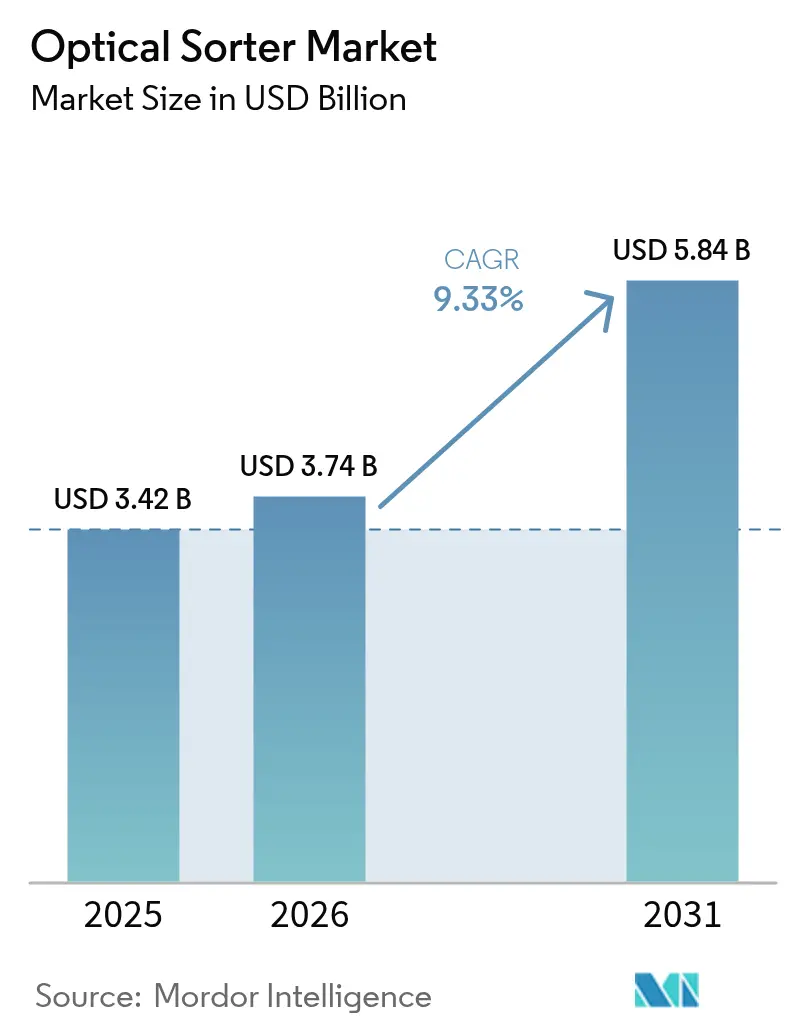
| Market Size (2026) | USD 3.74 Billion |
| Market Size (2031) | USD 5.84 Billion |
| Growth Rate (2026 - 2031) | 9.33% CAGR |
| Fastest Growing Market | Asia Pacific |
| Largest Market | North America |
| Market Concentration | Medium |
Major Players *Disclaimer: Major Players sorted in no particular order Image © Mordor Intelligence. Reuse requires attribution under CC BY 4.0. | |
Optical Sorter Market Analysis by Mordor Intelligence
The optical Sorter market size in 2026 is estimated at USD 3.74 billion, growing from 2025 value of USD 3.42 billion with 2031 projections showing USD 5.84 billion, growing at 9.33% CAGR over 2026-2031. This expansion stems from three intersecting forces: widening labor gaps across manufacturing hubs, increasingly stringent food safety and recycling mandates, and the rapid diffusion of AI-driven hyperspectral imaging that detects defects invisible to the human eye or to legacy camera systems. Suppliers are also benefiting from falling sensor costs and government funding that offsets capital expenditure for high-efficiency sorting equipment in food, recycling, and mining facilities. Competitive intensity is rising as Asian entrants roll out lower-priced, AI-infused platforms while Western incumbents integrate deep-learning modules into existing belt systems to protect installed bases. In parallel, sustainability regulations such as Extended Producer Responsibility (EPR) in Asia and deposit-return schemes in Europe continue to enlarge the total addressable market by tightening purity requirements for plastics, metals, and textiles.
Key Report Takeaways
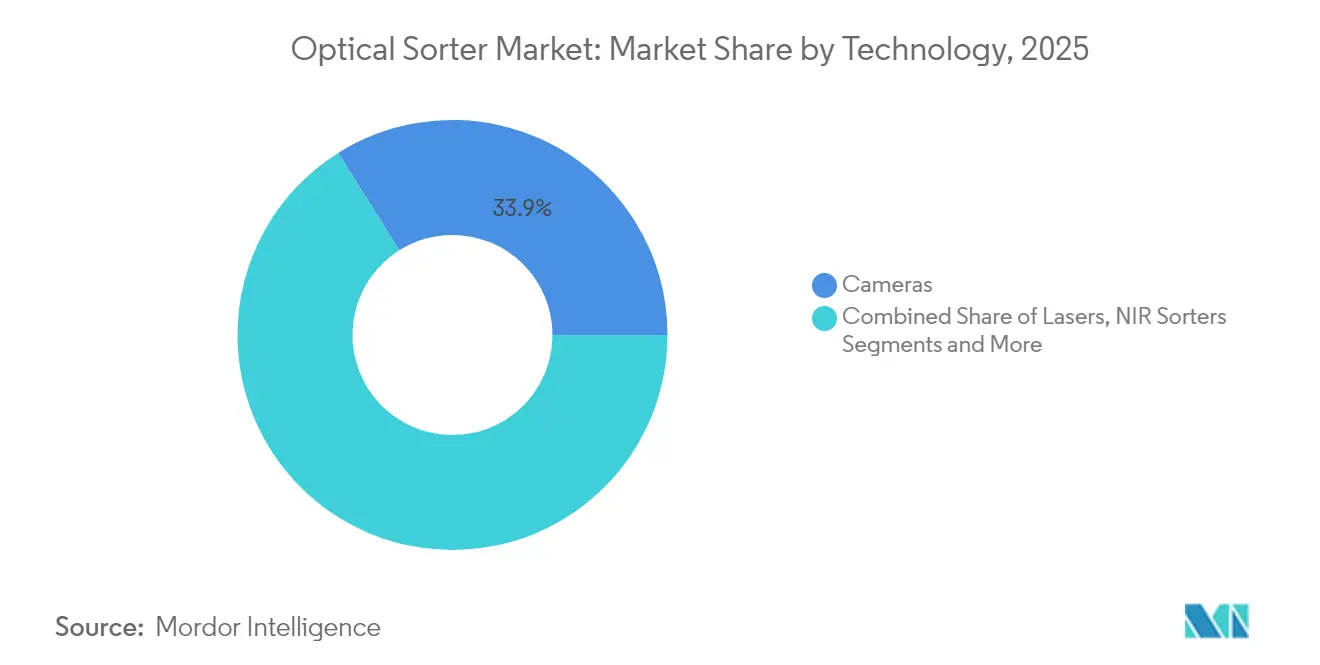
- By technology, camera-based systems led the optical sorter market with 33.92% of the market share in 2025, whereas near-infrared (NIR) sorters are projected to post the fastest growth of 11.45% CAGR through 2031.
- By platform, belt configurations accounted for 54.35% of the optical sorter market size in 2025 and are set to expand at a 11.86% CAGR, reflecting strong scalability for high-throughput lines.
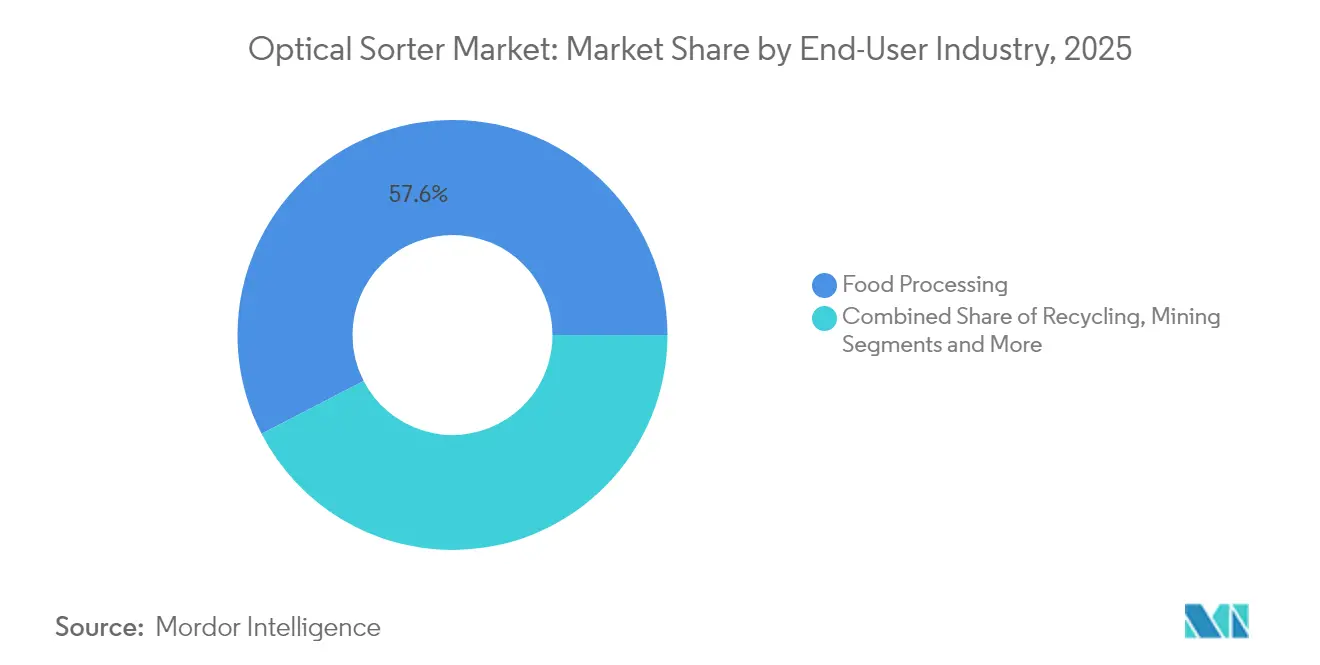
- By end-user industry, food processing dominated with a 57.60% revenue share in 2025; the recycling segment is projected to grow at a 10.28% CAGR through 2031.
- By geography, North America held 33.55% revenue share of the optical sorter market in 2025, while Asia-Pacific is forecast to register the fastest 12.32% CAGR to 2031.
Note: Market size and forecast figures in this report are generated using Mordor Intelligence’s proprietary estimation framework, updated with the latest available data and insights as of 2026.
Global Optical Sorter Market Trends and Insights
Drivers Impact Analysis*
| Driver | (~) % Impact on CAGR Forecast | Geographic Relevance | Impact Timeline |
|---|---|---|---|
| Automation demand in large-scale North American food plants | +2.10% | North America; spill-over to Europe | Medium term (2-4 years) |
| Tightening global HACCP and EU food-hygiene regulations | +1.80% | EU, North America, Asia | Long term (≥ 4 years) |
| Labor shortages and wage inflation in European recycling | +1.60% | Europe; spill-over to Asia-Pacific | Short term (≤ 2 years) |
| AI-driven hyperspectral breakthroughs | +2.30% | Global | Long term (≥ 4 years) |
| Extended Producer Responsibility (EPR) mandates in Asia | +1.20% | Asia-Pacific; emerging in MEA | Medium term (2-4 years) |
| Declining ore grades prompting sensor-based pre-concentration | +1.40% | South America; Australia, Africa | Medium term (2-4 years) |
| Source: Mordor Intelligence | |||
Automation demand in large-scale North American food plants
Persistent staffing gaps 615,000 manufacturing jobs remained vacant in the United States at end-2024 are forcing processors to replace manual inspectors with high-speed optical sorters that sustain 24/7 uptime while securing 25–35% higher product yield.[1]Mick Dueholm et al., “Does Worker Scarcity Spur Investment, Automation and Productivity?” stlouisfed.org Platform vendors now bundle vision algorithms that learn from production drifts to preserve accuracy without halting the line. Capital budgets reflect this priority shift, as U.S. food manufacturers invested USD 55 billion in automation between 2021 and 2024, allocating a growing slice to next-generation belt sorters capable of achieving 99% detection precision.[2]Karen Hanna, “High-speed sorting technology recovers 25–35% more product compared to manual inspection,” processingmagazine.com
Tightening global HACCP and EU food-hygiene regulations
EU Regulation 2023/915 explicitly positions optical sorter as an endorsed mitigation measure against mycotoxins and physical contaminants, compelling processors targeting the European market to adopt certified systems.[3]European Commission, “Regulation 2023/915,” eur-lex.europa.euComparable rules are rippling across Asia, prompting multinational food companies to synchronize quality-control investments. Compliance audits are increasingly requesting digital defect logs, a feature integrated into AI-enabled sorters that archives every rejected item for traceability.
Labor shortages and wage inflation in European recycling
Western European recovery facilities report double-digit wage inflation and rising absenteeism, a mix that lifts the payback attractiveness of robotic optical sorter. Deployments of AI-guided pick-and-place arms have delivered 40% material-recovery gains at German plants while slashing labor costs 40–60%
AI-driven hyperspectral breakthroughs
The cost per hyperspectral line-scan sensor fell nearly 35% between 2021 and 2024, enabling vendors to combine visible, NIR, and short-wave infrared data streams on a single platform. Deep-learning firmware lifts yield by recognizing subtle spectral signatures of aflatoxins or polymer fillers, unlocking new use cases in nuts, pet food, and lithium ore sorting
Restraints Impact Analysis*
| Restraint | (~) % Impact on CAGR Forecast | Geographic Relevance | Impact Timeline |
|---|---|---|---|
| High CapEx for hyperspectral & X-ray systems in SME grain mills | –1.8% | Developing markets worldwide | Medium term (2-4 years) |
| Frequent calibrations increase downtime in continuous-flow mining | –1.2% | South America, Australia, Africa | Short term (≤ 2 years) |
| Data-ownership concerns in cloud-connected sorters | –0.9% | North America, EU | Medium term (2-4 years) |
| Sensor fouling in high-moisture food applications | –0.7% | Global | Short term (≤ 2 years) |
| Source: Mordor Intelligence | |||
High CapEx for hyperspectral and X-ray systems in SME grain mills
A fully loaded hyperspectral sorter can exceed USD 500,000, a threshold that strains balance sheets of small and medium grain processors. surveys rank upfront cost as the primary barrier to advanced equipment, especially where credit lines remain tight. Without leasing schemes, many mills continue to rely on less capable camera-only machines.
Frequent calibrations increase downtime in continuous-flow mining
Sensor drift from dust, humidity, and ore variability forces mines to recalibrate optical sorters every few shifts, pausing throughput and eroding return on investment. Remote sites often lack vision-system technicians, compounding the interruption and prompting requests for self-calibrating hardware
*Our forecasts treat driver/restraint impacts as directional, not additive. The impact forecasts reflect baseline growth, mix effects, and variable interactions.
Segment Analysis
By Technology: AI Integration Accelerates NIR Adoption
In revenue terms, camera systems accounted for 33.92% of the optical sorter market share in 2025, owing to their versatility in color-based defect removal. The optical sorter market size attributable to NIR platforms is on track to post the fastest 11.45% CAGR as processors utilize spectral fingerprints to distinguish polymers, proteins, and valuable ore fractions. Vendors now embed machine-learning engines that raise detection accuracy to 95%, trimming false-reject rates by double digits. Laser solutions retain niche demand for geometry-based differentiation, while hyperspectral systems target premium segments such as aflatoxin detection in pistachios or gemstone sorting. X-ray transmission is gaining traction in the separation of dense materials within copper and lithium mines, complementing optical sensors when density, rather than color, determines value recovery.
Blended sensing is becoming standard as OEMs stack cameras, NIR arrays, and short-wave infrared detectors inside the same chassis. This convergence cuts footprint, eases calibration, and broadens target defect profiles. Euro-funded R&D consortia anticipate that AI-assisted hyperspectral modules will increase overall yield by 20% compared to 2023 baselines. As multinationals demand turnkey solutions, platform suppliers that master cross-sensor data fusion stand to secure long-term service contracts.


By Platform: Belt Systems Strengthen Scalability Lead
Belt architectures held 54.35% of the optical sorter market size in 2025, due to compatibility with conventional conveyor layouts and the ability to process up to 10 metric tons per hour in cereal, nut, and polymer recycling lines. Engineering refinements such as velocity-controlled feed belts and automatic singulation now push defect detection above 98%, mitigating historical mis-sort issues. Compact free-fall designs remain favored for fragile dried fruits, while lane configurations address items requiring precise orientation, such as blister-pack tablets or sliced vegetables. Hybrid footprints merge belt infeed with cascade or chute discharge to cope with variable bulk densities.
AI-backed condition-monitoring modules are reducing the total cost of ownership by predicting actuator wear days in advance of failure. A leading cereal producer reported an 8% reduction in downtime after installing cloud-linked vibration sensors on its main ejection cylinders. As OEMs standardize modular frames, operators can retrofit sensor suites instead of replacing entire units, prolonging asset life and encouraging incremental upgrades.
By End-User Industry: Recycling Becomes Growth Engine
Food processors remained the revenue anchor with a 57.60% share in 2025, driven by safety mandates and retailer zero-defect contracts. However, the recycling sector is poised for the most rapid growth, with a 10.28% CAGR, as EPR legislation in China, Vietnam, and South Korea elevates purity thresholds for rPET, rPP, and aluminum flake. The optical sorter market serves recycling by combining vision, spectroscopy, and robotics to hit ≥95% purity at lower labor cost, as evidenced by Korean facilities running AI-guided arms that achieve 99.3% accuracy across 96 picks per minute.
Mining now moves beyond the pilot stage as ore grades deteriorate. A CAD 7.6 million ore-sorting trial at Rio Tinto’s Lac Tio mine underscores how sensor-based pre-concentration can defer costly mill expansions by stripping barren rock early in the flow sheet. Over the forecast horizon, mixed-material applications, such as textile-to-textile recycling, create new revenue streams for versatile optical sorters capable of distinguishing between cotton, polyester, and elastane blends.
Geography Analysis
North America commanded 33.55% of 2025 revenues as processors adopted automation to address persistent labor shortages and comply with FSMA and state-level recycled-content regulations. Federal energy grants totaling USD 33 million earmarked for smart manufacturing accelerate optical-sorting retrofits across meat, dairy, and beverage facilities. Canada’s Plastics Innovation Challenges channel additional funds toward AI-led hyperspectral projects, enabling recyclers to double the recovery of flexible packaging.
The Asia-Pacific region is forecast to lead with a 12.32% CAGR to 2031, driven by China’s first fully automated carton-sorting plant in Xiamen and Japan’s demographic headwinds, which are expected to boost demand for robotic vision systems. Vietnam’s EPR rollout mandates brands to finance downstream purity improvements, mobilizing capex for optics-rich PET and HDPE sorting. South Korea’s 49% increase in plastic waste since 2018, along with a 70% recycling rate goal, bolsters orders for high-throughput belt platforms. Meanwhile, Australia leverages its AUD 200 million (USD 128.64 million) Recycling Modernisation Fund to support local optical-sorter assembly, thereby shortening supply chains.
Europe sustains steady demand by coupling circular-economy directives with subsidies for textile, WEEE, and fiber-based packaging recovery. ANDRITZ’s automated line in France that classifies garments by fiber composition illustrates how EU funding expands beyond food and beverage into new feedstocks. Latin America and Middle East & Africa remain nascent but strategic, with copper and lithium mines in Chile and Zimbabwe piloting sensor-based pre-concentration to offset declining ore grades and constrained water resources.


Competitive Landscape
Global leadership rests with TOMRA, Bühler, Key Technology, and Sesotec, whose combined portfolio spans cameras, NIR, X-ray, and data analytics. These players integrate AI inference engines; TOMRA’s GAINnext detects over 95% of opaque plastic contaminants to safeguard installed bases and increase service revenue. Acquisition remains the primary route to capability expansion; TOMRA’s 25% stake in PolyPerception enhances waste-flow monitoring, and Duravant’s Key Technology has absorbed Herbert Solutions to extend its root-crop equipment lines.
Asian challengers reshape price-performance curves. AETECH’s ATron robot, marketed at a 20–30% discount to its European counterparts, achieves 99.3% accuracy and operates in 13 Korean plants, underscoring how home-grown AI technology helps narrow performance gaps. Chinese OEMs are exporting belt sorters, bundled with cloud analytics, at aggressive financing terms, capturing small- to mid-sized recycling sites that previously relied on manual triage.
Competitive differentiation now hinges on full-suite offerings, including hardware, adaptive firmware, cloud dashboards, and predictive maintenance services. Vendors that master sensor fusion and data valorization secure multiyear service contracts, raising switching costs for operators. Conversely, markets with commodity-grade requirements bulk grain cleaning or quartz sorting remain price sensitive, enabling lower-cost suppliers to win share on capex efficiency.
Optical Sorter Industry Leaders
TOMRA Systems ASA
Eagle Vizion Inc.
Key Technology Inc. (A Duravant LLC)
Hefei Meyer Optoelectronic Technology Inc.
Machinex Industries Inc.
- *Disclaimer: Major Players sorted in no particular order

Recent Industry Developments
- June 2025: Pellenc ST outfitted a Norwegian PET facility to process 14,000 t/y at 99% clear-PET purity.
- June 2025: Rio Tinto invested CAD 7.6 million (USD 5.39 million) in ore-sorting trials at Lac Tio mine, co-funded by Quebec’s government.
- April 2024: Canada launched grants for AI-powered hyperspectral sorters under its Plastics Innovation Challenges.
- April 2024: TOMRA acquired 25% of PolyPerception to bolster AI-based waste-flow analytics.


Global Optical Sorter Market Report Scope
The optical sorter is an automated process that enables the user to sort solid products using cameras, lasers, or both, working in conjunction with sensors and software-driven image processing systems. It recognizes objects' color, size, shape, structural properties, and chemical composition.
The optical sorter market is segmented by technology (X-ray transmission, camera solutions, NIR solutions, and other technologies (hyperspectral, laser, etc.)), by end-user industries (food processing, recycling, mining, other end-user industries), and by geography (North America, Europe, Asia Pacific, and Rest of the World). The report offers market forecasts and size in value (USD) for all the above segments.
| Cameras |
| Lasers |
| NIR Sorters |
| Hyperspectral Cameras |
| X-ray Transmission |
| Belt |
| Freefall |
| Lane |
| Hybrid |
| Food Processing | Fruits and Vegetables |
| Grains and Cereals | |
| Nuts and Dry Fruits | |
| Meat and Seafood | |
| Confectionery and Snacks | |
| Recycling | Plastics |
| Metals | |
| Glass | |
| E-waste | |
| Mining | Coal |
| Precious and Base Metals | |
| Industrial Minerals | |
| Other Industries |
| North America | United States |
| Canada | |
| Mexico | |
| Europe | United Kingdom |
| Germany | |
| France | |
| Italy | |
| Rest of Europe | |
| Asia-Pacific | China |
| India | |
| Japan | |
| South Korea | |
| Australia | |
| Rest of Asia-Pacific | |
| South America | Brazil |
| Argentina | |
| Rest of South America | |
| Middle East and Africa | Turkey |
| South Africa | |
| Saudi Arabia | |
| Rest of Middle East and Africa |
| By Technology | Cameras | |
| Lasers | ||
| NIR Sorters | ||
| Hyperspectral Cameras | ||
| X-ray Transmission | ||
| By Platform | Belt | |
| Freefall | ||
| Lane | ||
| Hybrid | ||
| By End-User Industry | Food Processing | Fruits and Vegetables |
| Grains and Cereals | ||
| Nuts and Dry Fruits | ||
| Meat and Seafood | ||
| Confectionery and Snacks | ||
| Recycling | Plastics | |
| Metals | ||
| Glass | ||
| E-waste | ||
| Mining | Coal | |
| Precious and Base Metals | ||
| Industrial Minerals | ||
| Other Industries | ||
| By Geography | North America | United States |
| Canada | ||
| Mexico | ||
| Europe | United Kingdom | |
| Germany | ||
| France | ||
| Italy | ||
| Rest of Europe | ||
| Asia-Pacific | China | |
| India | ||
| Japan | ||
| South Korea | ||
| Australia | ||
| Rest of Asia-Pacific | ||
| South America | Brazil | |
| Argentina | ||
| Rest of South America | ||
| Middle East and Africa | Turkey | |
| South Africa | ||
| Saudi Arabia | ||
| Rest of Middle East and Africa | ||


Key Questions Answered in the Report
What is the current size of the optical sorter market?
The optical sorter market stands at USD 3.74 billion in 2026 and is projected to reach USD 5.84 billion by 2031.
Which technology segment is growing the fastest?
Near-infrared (NIR) systems are expected to register the highest 11.45% CAGR due to superior material-identification capabilities.
Why are belt platforms so dominant?
Belt sorters integrate easily with existing conveyors, handle large throughputs, and now feature AI modules that cut downtime, giving them 54.35% revenue share in 2025.
Which end-user will drive future demand?
Recycling plants will be the growth engine, advancing at 10.28% CAGR as EPR policies tighten purity targets for plastics and metals.
Page last updated on:


