Solid State Drive (SSD) Market Size and Share
Market Overview
| Study Period | 2020 - 2031 |
|---|---|
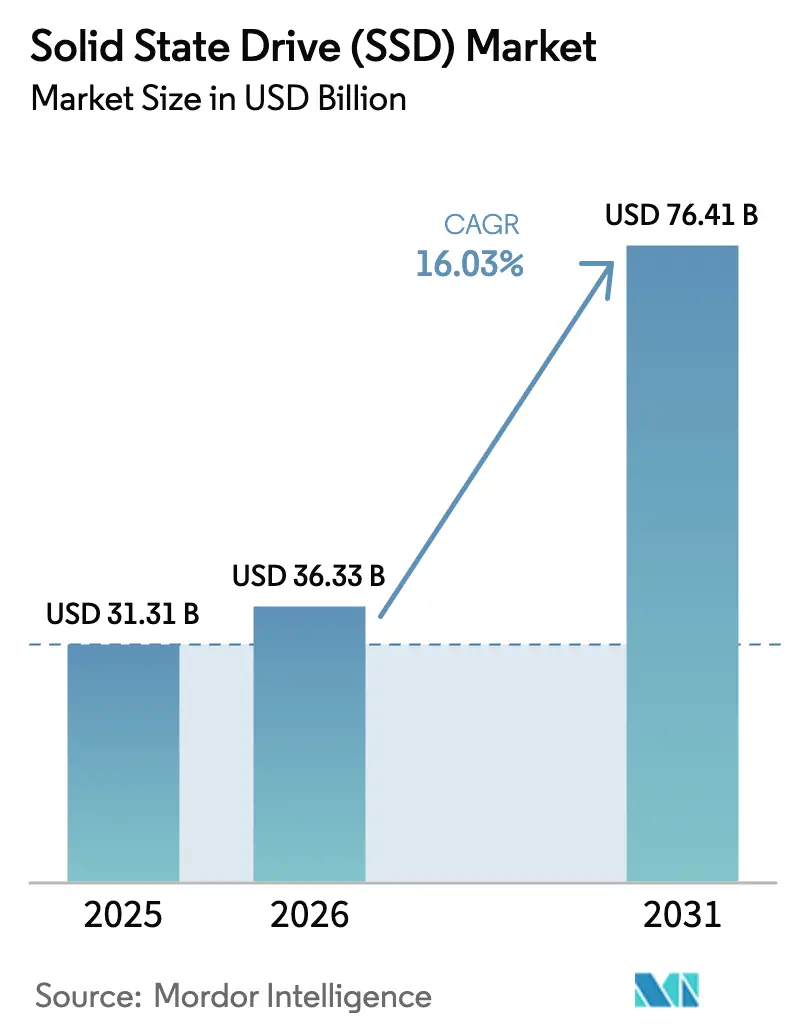
| Market Size (2026) | USD 36.33 Billion |
| Market Size (2031) | USD 76.41 Billion |
| Growth Rate (2026 - 2031) | 16.03% CAGR |
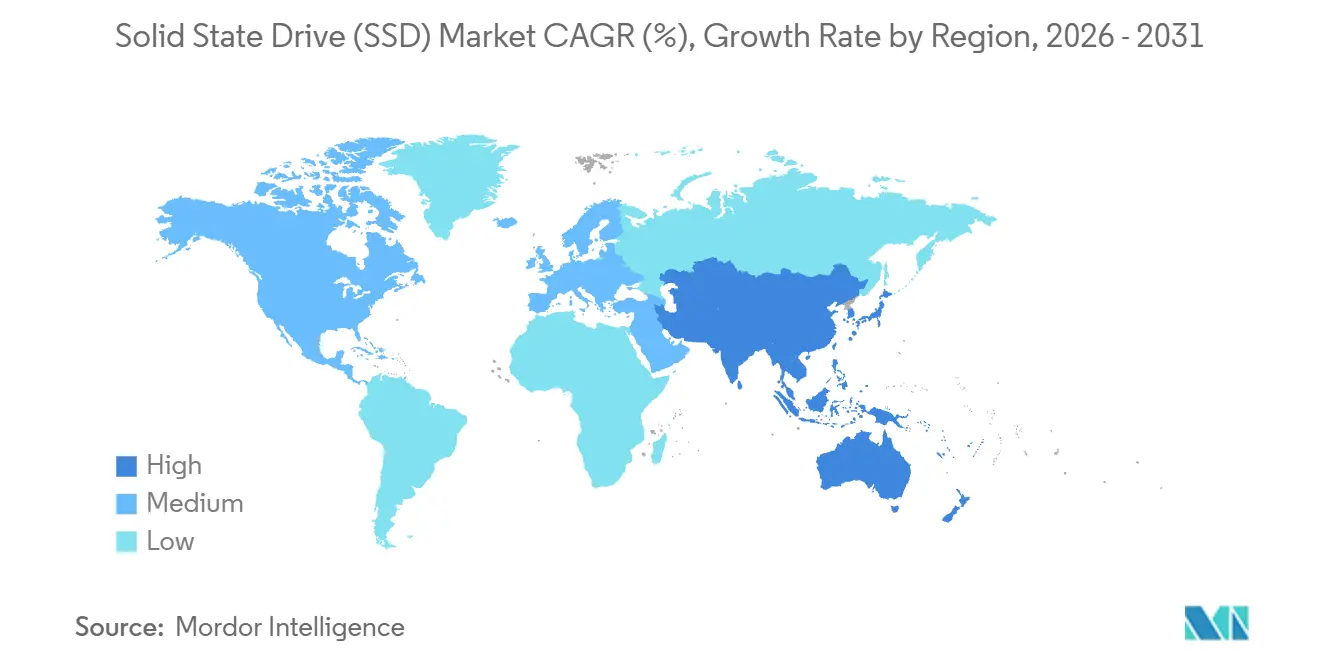
| Fastest Growing Market | Asia Pacific |
| Largest Market | Asia Pacific |
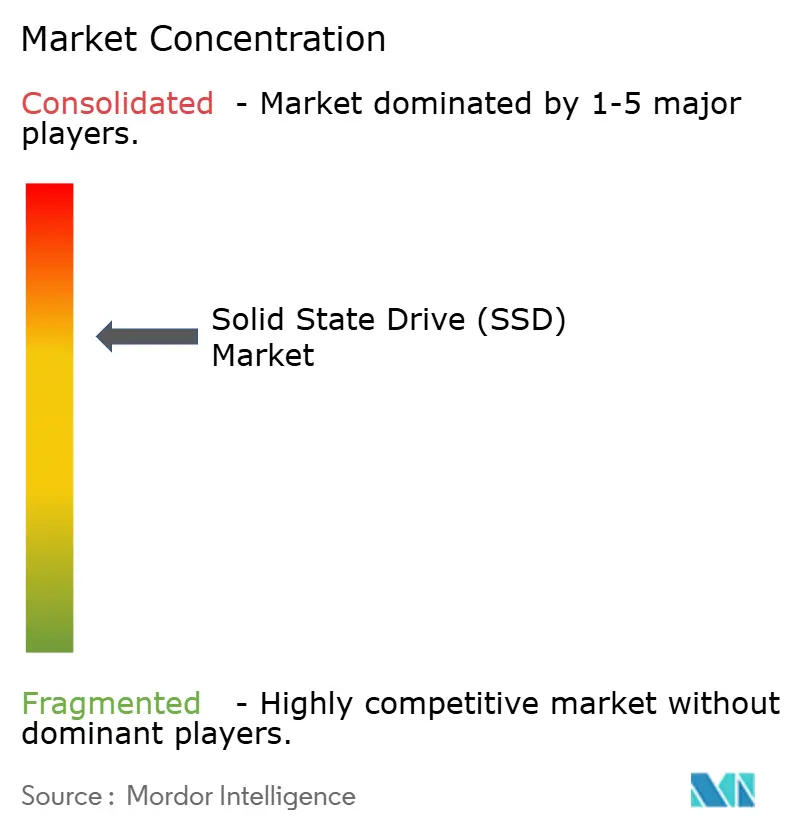
| Market Concentration | Medium |
Major Players *Disclaimer: Major Players sorted in no particular order Image © Mordor Intelligence. Reuse requires attribution under CC BY 4.0. | |
Solid State Drive (SSD) Market Analysis by Mordor Intelligence
The Solid State Drive Market size is expected to grow from USD 31.31 billion in 2025 to USD 36.33 billion in 2026 and is forecast to reach USD 76.41 billion by 2031 at 16.03% CAGR over 2026-2031. Hyperscale and enterprise buyers are pivoting from legacy hard-disk shelves to NVMe flash to run generative AI training, vector databases, and real-time analytics at sub-millisecond latency, while edge-computing nodes in 5G base stations and autonomous vehicles add a second engine of demand. QLC cost parity with TLC, PCIe Gen5 bandwidth gains, and the migration from 2.5-inch U.2 to EDSFF modules all reinforce the adoption curve. Consumer sentiment also matters: gamers, content creators, and AI developers favor larger drives, pushing the above-2 TB band toward a 19.41% CAGR that tops the overall solid state drive market trajectory. On the supply side, five vertically integrated NAND makers account for roughly three-quarters of global output, yet rivalry remains intense as they race to 300-layer nodes, firmware-defined flash, and thermal innovations.
Key Report Takeaways
- By interface, PCIe and NVMe captured 62.34% solid state drive market share in 2025 while registering a 17.03% CAGR through 2031.
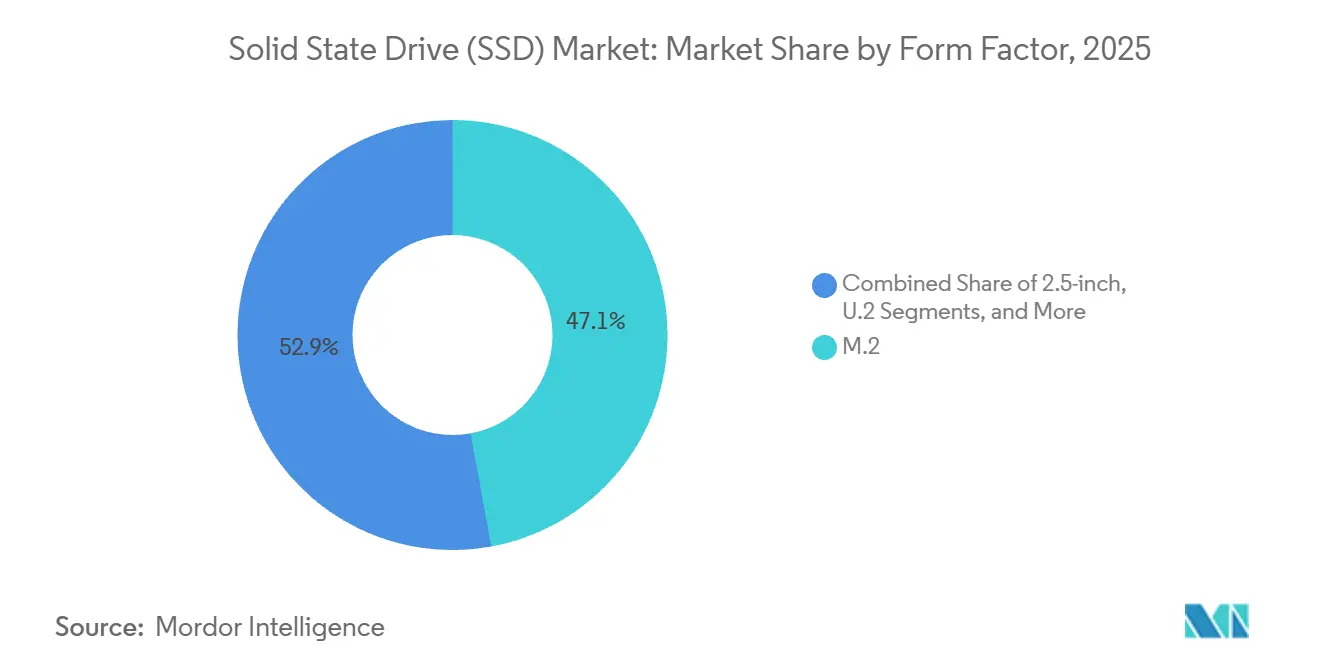
- By form factor, M.2 accounted for 47.11% of the solid state drive market size in 2025; EDSFF modules are forecast to grow at 18.12% CAGR to 2031.
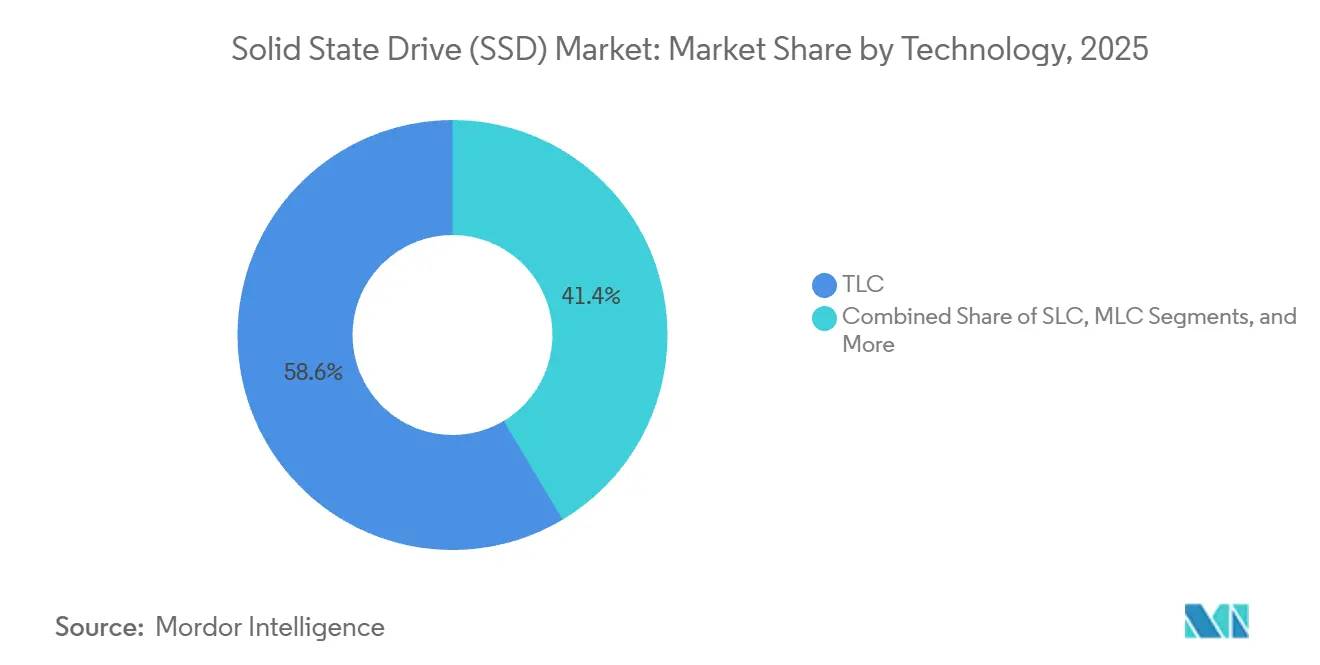
- By technology, triple-level-cell NAND generated 58.56% of the revenue in 2025, whereas QLC NAND is expanding at an 18.12% CAGR as the endurance gap narrows.
- By capacity, the above-2 TB tier represented 19.41% of the solid state drive market size in 2025 and is the fastest-growing band at 19.41% CAGR.
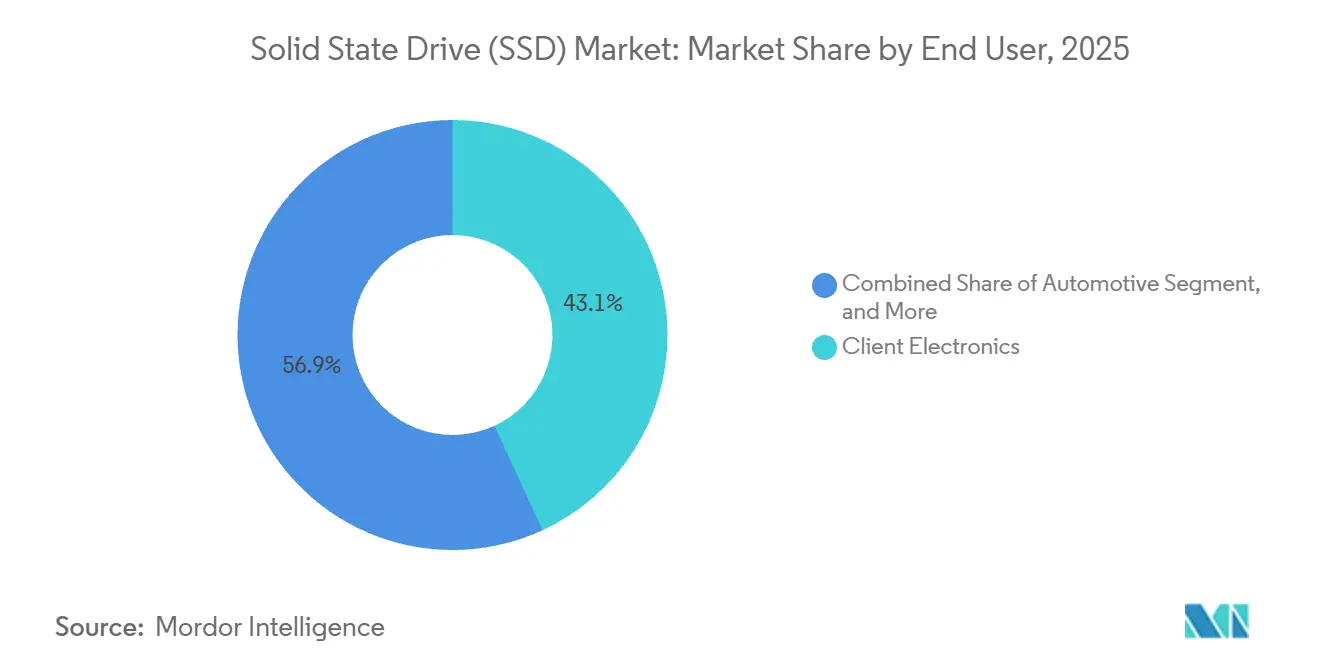
- By end-user, client devices still accounted for 43.12% of revenue in 2025, and enterprise and data-center servers are advancing at an 18.72% CAGR, outpacing client devices.
- By sales channel, online retail is projected to grow at a 17.82% CAGR through 2031, eroding the share of offline stores and certain distribution channels.
- By geography, Asia Pacific held 46.73% revenue in 2025 and is expected to expand at an 18.67% CAGR, the strongest regional growth pace.
Note: Market size and forecast figures in this report are generated using Mordor Intelligence’s proprietary estimation framework, updated with the latest available data and insights as of January 2026.
Global Solid State Drive (SSD) Market Trends and Insights
Drivers Impact Analysis*
| Driver | (~) % Impact on CAGR Forecast | Geographic Relevance | Impact Timeline |
|---|---|---|---|
| Rising Demand From AI/ML Data-Center Workloads | +4.2% | Global, concentrated in North America and Asia Pacific hyperscale hubs | Medium term (2-4 years) |
| Accelerating NVMe Adoption Across Enterprise Storage Arrays | +3.1% | Global, early adoption in North America and Europe enterprise segments | Short term (≤ 2 years) |
| Rapid Growth of Edge Computing Nodes in 5G and IoT | +2.8% | Asia Pacific and North America 5G infrastructure, global IoT deployments | Medium term (2-4 years) |
| Mainstreaming of PCIe 5.0 and EDSFF Form-Factors | +3.5% | North America and Asia Pacific data center markets, Europe enterprise | Short term (≤ 2 years) |
| Government Green-Data Policies Favor Flash Over HDDs | +1.4% | Europe (EU Energy Efficiency Directive), North America, China | Long term (≥ 4 years) |
| OEM Firmware-Defined Flash Creating New Upgrade Cycles | +1.3% | Global, concentrated in enterprise and hyperscale segments | Medium term (2-4 years) |
| Source: Mordor Intelligence | |||
AI and ML Workloads Reshape Data-Center Storage
Generative AI clusters now stream terabyte-scale parameter files from local NVMe tiers rather than network shares, and Meta’s 2025 report showed Llama 3 training pulling 2.4 exabytes of flash, up 60% from 2024. PCIe Gen5 drives offering more than 10 GB/s sequential writes are therefore replacing SATA and early-generation PCIe devices. Edge AI compounds demand autonomous vehicles ship with 4 TB to 8 TB SSDs for onboard inference, and every millisecond saved translates into safer control loops. Nvidia highlighted at GTC 2025 that storage I/O, not GPU cycles, cap many AI pipelines. Hyperscalers have shifted budgets accordingly, viewing flash as an operating-expense reducer because they can increase VM density per rack and lower power draw once latency is removed from the data path.
Enterprise NVMe Uptake Accelerates Legacy Replacement
NVMe crossed a 60% shipment threshold for enterprise arrays in 2025, and NVMe-over-Fabrics is displacing SAS and Fibre Channel because it brings tenfold throughput at similar reliability. Dell’s PowerStore uses NVMe-oF zoning to hit 7 million IOPS, making array consolidation economical.[1]Dell Technologies, “Supply-Chain Update FY 2025,” investors.delltechnologies.com The NVMe 2.0 spec added zoned namespaces and key-value commands that cut CPU cycles, so buyers are scrapping SATA shelves years ahead of depreciation. PCIe Gen4 satisfies mixed workloads today, yet early adopters already specify Gen5 for analytics clusters, turning protocol migration into the fastest lever for solid state drive market growth.
Edge-Computing Nodes Boost Demand Beyond the Core
Telcos cache CDN assets at 5G macro sites, slicing backhaul 38% and enabling cloud gaming and augmented-reality services, as Ericsson’s 2025 study confirmed. Tesla embeds 2TB SSDs in its autonomous platform for over-the-air model updates, demonstrating that automotive use cases increasingly rely on local flash storage. Industrial IoT gateways, point-of-sale kiosks, and rugged edge servers all need extended temperature tolerance and power-loss protection, creating premium niches within the broader solid state drive market.
PCIe 5.0 Bandwidth and EDSFF Density Reach the Mainstream
Intel Sapphire Rapids and AMD Genoa unlocked real Gen5 deployments, and attach rates topped 40% of new servers by mid-2025. Heat output climbed to 18 W per drive, yet Microsoft Azure cut cooling energy 22% by adopting E1.S drives that streamline airflow. Meta’s Open Rack V3 mandates E3.S, and Alibaba shifted 80% of its 2025 procurement to EDSFF, proving that density wins once rack slots become scarce. As PCIe Gen6 sampling starts in 2027, flash suppliers are already prototyping thermally efficient controller silicon to sustain performance without throttling.
Restraints Impact Analysis*
| Restraint | (~) % Impact on CAGR Forecast | Geographic Relevance | Impact Timeline |
|---|---|---|---|
| High ASP Volatility Due to NAND Bit Oversupply | -2.7% | Global, acute in regions dependent on spot-market procurement | Short term (≤ 2 years) |
| Supply-Chain Concentration Risk in NAND Wafer Manufacturing | -1.8% | Global, acute in regions dependent on Taiwan and South Korea fabrication | Medium term (2-4 years) |
| Thermal Management Challenges in Ultrathin Client Devices | -1.2% | Global, concentrated in consumer laptop and mobile workstation segments | Short term (≤ 2 years) |
| Growing Security-Certification Costs for Enterprise Drives | -0.6% | North America and Europe enterprise segments, government procurement | Long term (≥ 4 years) |
| Source: Mordor Intelligence | |||
Pricing Volatility Clouds Procurement
Quarterly NAND prices swung 35% during 2024-2025, compressing OEM margins and forcing buyers to lock in 24-month contracts to avoid budget shortfalls. Excess wafer starts in 2023 combined with rapid QLC conversions pushed the solid state drive market into oversupply, dropping consumer SSD ASPs 28% year-on-year. Smaller brands lacking die or controller plants felt the squeeze most, underscoring that vertical integration is an insurance policy against price cycles.
Concentration Exposes the Supply Chain to Shock
Taiwan and South Korea house 68% of global NAND capacity; a 2024 earthquake idled 15% of Kioxia output and lifted spot prices 12% within weeks. Incentive programs under the U.S. CHIPS and Science Act and EU Chips Act promise local fabs but none will reach volume before 2027.[2]U.S. Department of Commerce, “CHIPS and Science Act Overview,” commerce.gov Until then, any geopolitical or seismic event at Asia’s fabrication hubs threatens the delivery schedules that keep the solid state drive market running.
*Our forecasts treat driver/restraint impacts as directional, not additive. The impact forecasts reflect baseline growth, mix effects, and variable interactions.
Segment Analysis
By Form Factor: EDSFF Momentum Redefines Rack Economics
M.2 drives generated 47.11% of 2025 revenue as laptops, SFF desktops, and consoles standardized on the gum-stick layout. However, the solid state drive market is pivoting in the data center; EDSFF E1.S, E1.L, and E3.S modules are forecast to post an 18.12% CAGR through 2031, the highest among form factors. Meta’s Open Rack V3 now accommodates 32 E3.S drives per 1U server, 33% more than U.2 bays, reducing floor space and cooling costs per petabyte.[3]Open Compute Project, “Open Rack V3 Specification,” opencompute.org
Samsung’s upcoming 64 TB E1.L showcases why hyperscalers prefer the elongated shell thermal spreader across the PCB, which avoids throttling even under 18 W write loads. Outside hyperscale halls, EDSFF uptake lags because traditional IT shops lack tool-free trays and budget for new chassis. Yet Alibaba’s 80% EDSFF procurement mix signals that scale tips the cost balance, so EDSFF should eclipse U.2 for fresh deployments before 2029. Meanwhile, add-in cards stay niche at <5% share, mostly in workstations and scientific clusters craving direct x16 bandwidth.


By Interface: NVMe Consolidates Dominance While SATA Fades
NVMe over PCIe claimed 62.34% of revenue in 2025 and is marching toward ubiquity at a 17.03% CAGR. NVMe’s lean command set halves CPU overhead compared to AHCI, and its multi-queue depth aligns perfectly with modern core counts. Conversely, SATA slid below 25% as motherboards drop ports or repurpose lanes for USB 4. SAS clings to dual-port enterprise arrays, yet its share is under 8% because NVMe-oF meets the same redundancy target with five times the throughput.
The adoption of PCIe Gen5 raises the solid-state drive market size for NVMe even faster. Dell’s PowerEdge Gen5 servers ship NVMe as the default, offering SATA only on special, build-to-order SKUs. Looking ahead, PCIe Gen6’s PAM-4 signaling promises equal bandwidth at lower watts, keeping NVMe firmly at the center of product roadmaps while legacy protocols linger only in brownfield refresh cycles.
By Technology: QLC Approaches TLC Performance
Triple-level-cell NAND retained a 58.56% share in 2025, balancing cost and endurance, while QLC is the growth star, with an 18.12% CAGR. Micron’s 232-layer QLC clocks 600 TBW for 2 TB drives, hitting 90% of TLC endurance by caching writes in dynamic SLC regions. This advance enables hyperscalers to store cold data on QLC, shaving the cost per gigabyte by 30% in tiers such as AWS Glacier.
SLC and MLC remain in industrial and automotive gear where -40 °C to 125 °C ratings and >10,000 cycle endurance outweigh price. PLC entered pilot tape-out at SK hynix in late 2025, but its sub-1,000-cycle ceiling keeps it in archival niches for now. Net-net, the solid-state drive market will bifurcate, with QLC for read-heavy caches and TLC/SLC for sustained writes, driven more by workload profile than any top-line specification.
By Capacity: High-Density Drives Outpace the Pack
The 500 GB-1 TB tier still shipped the most units in 2025, holding 39.41% share, yet buyers are moving up. Drives above 2 TB will log a 19.41% CAGR through 2031, as 4K video edits, AAA games exceeding 200 GB, and local AI datasets outgrow smaller volumes. Nvidia’s developer survey reported that 62% of ML engineers store datasets on local SSDs to avoid network latency.
Samsung priced its 8 TB M.2 at USD 799 in 2025, signaling mainstream viability for capacities that once required enterprise form factors. Sub-500 GB models, once prevalent in entry laptops, shrank to <12% share thanks to falling die costs. The 1 TB-2 TB bracket remains the sweet spot for corporate boot volumes and VDI images, while studio workstations and data-center boot nodes race past 4 TB to simplify RAID layouts.
By End User: Servers and Edge Nodes Lead Growth
Client devices still accounted for 43.12% of revenue in 2025, yet enterprise and data-center servers are expected to rise at an 18.72% CAGR through 2031. Microsoft Azure and AWS each bought more than 500,000 SSDs per quarter in 2025 to feed AI inference clusters. At the edge, 5G nodes with local flash sliced backhaul offer a 38% reduction, according to Ericsson, providing telcos with an immediate OPEX payback.
Industrial and automotive niches demand rugged, AEC-Q100-qualified drives; Tesla embeds 2 TB SSDs in its self-driving stack, and BYD followed suit in 2025. These segments carry 3x-5x price premiums but lower unit volumes. Client refresh cycles remain steady, yet the revenue mix swings toward servers and edge boxes where capacity and endurance outweigh pure ASP.
By Sales Channel: E-Commerce Gains Ground
OEM deals still account for 51.84% of revenue, as hyperscalers and PC builders sign multi-year contracts for guaranteed supply and custom firmware. Even so, online marketplaces are expected to post a 17.82% CAGR through 2031 as DIY builders and SMB IT shops increasingly adopt transparent pricing. Amazon logged a 28% unit surge in 2025 as PCIe Gen5 upgrade kits became widely available.
Retail shelves in brick-and-mortar stores fell to a <10% share as same-day delivery reached most metro zip codes. OEMs now operate direct-to-consumer portals, but volumes remain tiny next to entrenched e-commerce giants. Over the long haul, real-time inventory APIs and net-30 payment add-ons will blur the distinction between distribution and retail, consolidating the solid state drive market around digital channels.
Geography Analysis
The Asia Pacific region controlled 46.73% of the revenue in 2025 and is expected to advance at an 18.67% CAGR, benefiting from both increased wafer output and local consumption. Samsung, SK hynix, and Kioxia operate 200-layer fabs in South Korea, Taiwan, and Japan, which significantly influence global cost curves. In contrast, Alibaba Cloud has deployed 1.2 exabytes of flash for domestic AI training. India posted a 32% increase in enterprise SSD purchases as the Digital India agenda drove new banking and e-gov workloads. The region’s growth faces geopolitical and earthquake risks, yet no alternative hub can yet match its cost structure.
North America and Europe generated approximately 38% of the revenue in 2025. Azure and AWS each inserted half a million SSDs per quarter to support the growing demand for generative AI traffic. U.S. CHIPS funding supports Micron’s USD 15 billion New York fab, slated for a 2028 start-up, with early output focusing on DRAM before adding NAND. Europe’s GDPR and pending Data Act are prompting colocation centers to stock local flash, while the EU Chips Act earmarks EUR 43 billion (USD 50.30 billion) for onshore fabs; yet, none have yet reached pilot runs.
Middle East and Africa and South America together yielded about 15% revenue. Saudi Arabia’s NEOM specified NVMe edge storage for its smart-city grid, while South African banks adopted flash to meet instant-payment mandates. Brazilian retailers saw a 24% unit rise in 2025, though import tariffs temper high-capacity adoption. Power grid instability and limited fiber still curb enterprise rollouts, yet year-on-year growth rates eclipse global averages as digital transformation leapfrogs legacy IT.
Mordor Intelligence provides coverage of the solid state drive (ssd) market across other key regional markets. Detailed country-level analysis extends to China incorporating local coverage and market participation, as required.

Competitive Landscape
The solid state drive market remains moderately concentrated, with Samsung, SK hynix, Micron, Kioxia, and Western Digital collectively owning roughly 75% of NAND bits; yet, rivalry is fierce. Samsung’s vertical stack combines NAND, DRAM, and controllers, cutting time to market. Micron’s USD 15 billion New York fab diversifies its geography and pursues CHIPS subsidies, although volume is expected to arrive only in 2028. Western Digital co-develops BiCS 8 with Kioxia to share USD 3 billion node costs.
Smaller challengers attack niches. Solidigm optimizes QLC for CDN workloads, while YMTC leverages a 321-layer Xtacking die to win price-sensitive Chinese tenders. Automotive SSDs require a temperature tolerance of -40 °C to 125 °C and a ten-year retention period, enabling Samsung to secure design wins with Tesla and BYD. Computational-storage startups raised USD 200 million in 2025, embedding FPGAs in drives for on-disk SQL filters. Patent activity in phase-change heat sinks and graphene spreaders reflects a shared problem: cooling 18 W Gen5 drives without throttling. NVMe 2.0, ratified in 2025, formalizes computational storage commands and telemetry hooks, providing innovators with a standards-based runway.[4]NVM Express, “NVMe 2.0 Specification,” nvmexpress.org
Solid State Drive (SSD) Industry Leaders
Samsung Electronics Co., Ltd.
Western Digital Corporation
Kioxia Holdings Corporation
SK hynix Inc. (incl. Solidigm)
Micron Technology, Inc.
- *Disclaimer: Major Players sorted in no particular order

Recent Industry Developments
- March 2025: SK Hynix closed Intel’s NAND technology purchase for USD 1.9 billion, finalising integration of the acquired IP into its enterprise roadmap.
- March 2025: KIOXIA introduced the LC9 Series 122.88 TB NVMe SSD built on 8th-gen BiCS FLASH and PCIe 5.0 to serve AI training clusters.
- February 2025: PNY launched aiDAPTIV+ SSDs that couple firmware and software hooks for scalable LLM training on-prem without data-sharing risks.
- January 2025: Lenovo agreed to acquire Infinidat, broadening its high-end storage line and opening cross-sell options into hyperscale contracts.
- January 2025: Pure Storage and Micron expanded collaboration around Micron G9 QLC NAND to slash hyperscale power envelopes.


Research Methodology Framework and Report Scope
Market Definitions and Key Coverage
Our study defines the solid-state drive market as sales revenue from newly manufactured, NAND-flash based SSDs that slot inside or attach to computing, consumer, industrial, and enterprise equipment at the factory gate. Drives covered span 2.5-inch, M.2, U.2, EDSFF, and similar formats, across SATA, SAS, and PCIe/NVMe interfaces.
Scope exclusion: External USB flash sticks, hybrid HDDs, and refurbished or gray-market SSDs fall outside the boundary.
Segmentation Overview
- By Form Factor
- 2.5-inch
- M.2
- U.2
- PCIe Add-in Card
- EDSFF
- Other Form Factors
- By Interface
- SATA
- PCIe/NVMe
- SAS
- By Technology (NAND Type)
- SLC
- MLC
- TLC
- QLC
- Other NAND Types
- By Capacity
- Up to 500 GB
- 500 GB - 1 TB
- 1 TB - 2 TB
- Above 2 TB
- By End-user/Application
- Client Electronics (Laptops, Desktops)
- Enterprise/Data-Center Servers
- Industrial and Embedded Systems
- Automotive
- Other End-user/Application
- By Sales Channel
- Direct/OEM
- Distribution and Resellers
- Online Retail
- By Geography
- North America
- United States
- Canada
- Mexico
- South America
- Brazil
- Argentina
- Rest of South America
- Europe
- Germany
- United Kingdom
- France
- Italy
- Spain
- Russia
- Rest of Europe
- Asia Pacific
- China
- Japan
- South Korea
- India
- Australia
- New Zealand
- Rest of Asia Pacific
- Middle East
- United Arab Emirates
- Saudi Arabia
- Turkey
- Rest of Middle East
- Africa
- South Africa
- Nigeria
- Kenya
- Rest of Africa
- North America
Detailed Research Methodology and Data Validation
Primary Research
Mordor analysts interviewed flash-controller makers, enterprise storage architects, and large e-tail distributors across North America, Asia Pacific, and Europe. The conversations gave us fresh color on near-term price erosion, channel inventory, and NVMe adoption speeds, letting us tighten assumptions drawn from desk work.
Desk Research
We began by mapping global production flows through publicly available shipment tallies from bodies such as the Semiconductor Industry Association, U.S. International Trade Commission import codes, JEDEC unit statistics, and customs dashboards from Korea and China. Company 10-Ks, quarterly filings, and investor decks supplied brand-level ASP signals, which our team then averaged by interface class. News and patent alerts inside Dow Jones Factiva and Questel helped us track emerging E1. S and E3. S designs that influence forecast mix.
Next, we layered on regional consumption indicators, PC and server shipments from IDC, cloud capacity buildouts logged by the Open Compute Project, and government electronics trade surveys in the EU and Japan to sense check demand pools. These threads feed the model's base year calibration.
The list here is illustrative; many other open and subscription sources assisted data validation and context building.
Market-Sizing & Forecasting
A top-down reconstruction starts with 2024 global NAND petabytes shipped, applies SSD share, average capacity, and blended ASP to land on 2025 revenue. Select bottom-up checks, supplier roll-ups and sampled e-commerce price × volume screens, confirm the envelope. Key variables monitored include quarterly NAND cost per gigabyte, PC and server unit forecasts, hyperscale capex, enterprise PCIe penetration, and average capacity per drive; each drives either price or volume curves. Multivariate regression on these drivers underpins the 2025-2030 projection, while scenario analysis cushions demand shocks from cyclical memory pricing. When bottom-up samples deviate beyond five percent, we adjust the base with documented rationale.
Data Validation & Update Cycle
Our multi-step review compares model outputs against independent shipment, revenue, and capacity series; outliers trigger analyst re-checks before sign-off. Reports refresh each year, with mid-cycle updates issued when large fabs, trade policies, or component shortages materially shift outlooks.
Why Mordor's Solid State Drive Baseline Earns Trust
Published estimates often diverge because firms pick different drive interfaces, price bases, and refresh cadences.
Major gap drivers include whether client-grade modules are blended with enterprise SKUs, the handling of rapid ASP compression, and the forecast start year. Mordor's model locks scope first, uses mixed variables that mirror real buying behavior, and refreshes annually, which competitors sometimes skip.
Benchmark comparison
| Market Size | Anonymized source | Primary gap driver |
|---|---|---|
| USD 61.30 B (2025) | Mordor Intelligence | - |
| USD 35.55 B (2025) | Global Consultancy A | Excludes datacenter NVMe lines; applies 2023 ASPs without 2024 price drops |
| USD 71.34 B (2025) | Industry Association B | Blends refurbished drives and uses unit-based uplift without capacity weighting |
These comparisons show that our disciplined scope setting, variable choice, and yearly refresh create a balanced, transparent baseline decision-makers can rely on.


Key Questions Answered in the Report
What is the projected value of the solid state drive market by 2031?
It is forecast to reach USD 76.41 billion by 2031, growing at a 16.03% CAGR.
Which interface is overtaking SATA in new deployments?
PCIe-based NVMe leads with 62.34% share in 2025 and continues to expand as SATA retires.
Why are hyperscalers adopting EDSFF drives?
EDSFF increases drive density per rack unit and cuts cooling energy by more than 20%, improving total cost of ownership.
Is QLC NAND ready for enterprise workloads?
Yes, 232-layer QLC now delivers 600 TBW for 2 TB drives, about 90% of entry-level TLC endurance in read-heavy environments.
Which region grows fastest through 2031?
Asia Pacific leads at an 18.67% CAGR thanks to concentrated NAND output and surging local demand.
What limits PCIe Gen5 SSD adoption today?
Drives dissipate up to 18 W, so many data centers must upgrade cooling to avoid throttling.
Page last updated on:


