Market Overview
| Study Period | 2017 - 2030 |
|---|---|
| Forecast Data Period | 2025 - 2030 |
| Historical Data Period | 2017 - 2023 |
| Market Size (2025) | USD 28.56 Billion |
| Market Size (2030) | USD 38.42 Billion |
| Growth Rate (2025 - 2030) | 6.11% CAGR |
| Market Concentration | Medium |
Major Players*Disclaimer: Major Players sorted in no particular order Image © Mordor Intelligence. Reuse requires attribution under CC BY 4.0. | |

Soil Treatment Market Analysis by Mordor Intelligence
The Soil Treatment Market size is estimated at 28.56 billion USD in 2025, and is expected to reach 38.42 billion USD by 2030, growing at a CAGR of 6.11% during the forecast period (2025-2030).
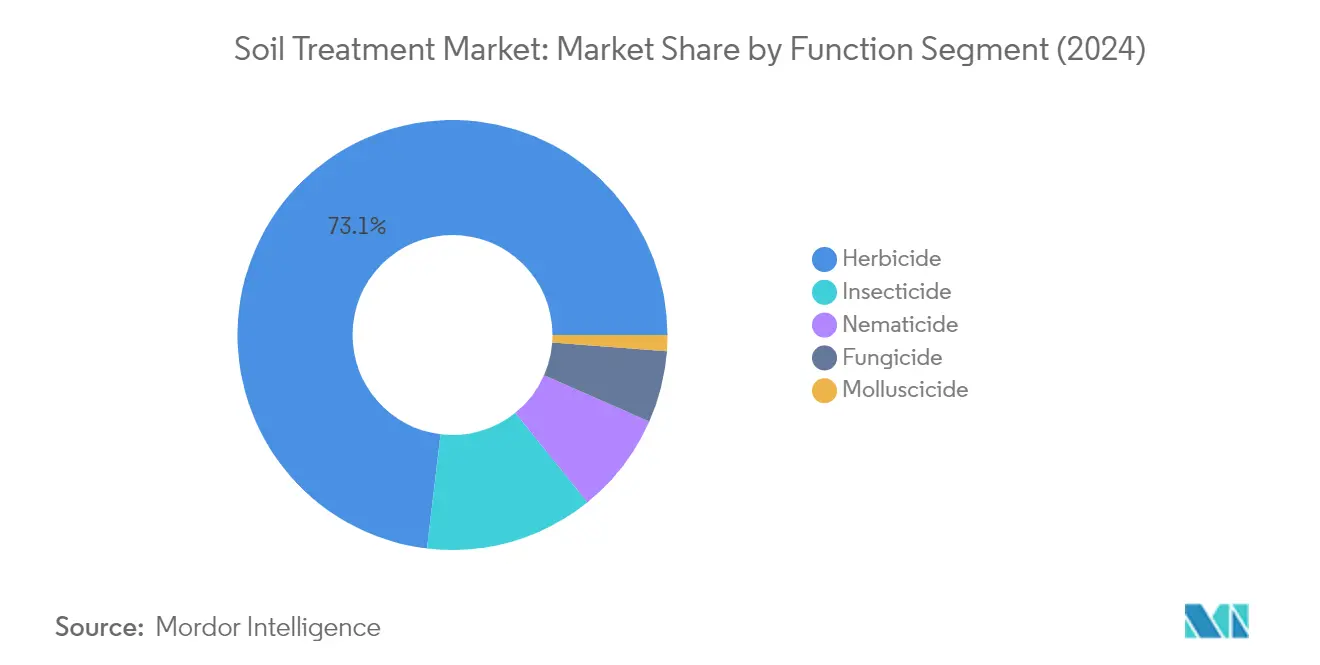
The soil treatment industry is experiencing a significant transformation driven by the adoption of modern farming practices and precision agriculture technologies. Farmers are increasingly embracing no-till and minimum-till farming methods, which require more sophisticated soil treatment approaches. These practices have led to the development of precision application technologies that allow farmers to target specific areas with high weed pressure, optimizing pesticide use and reducing overall costs. The integration of GPS-guided systems and soil mapping technologies has enabled more precise and efficient application of soil treatment products, particularly in large-scale agricultural operations where herbicides account for 72.8% of soil treatment methods.
The industry faces mounting challenges from soil-borne pests and pathogens that pose significant threats to global food security. Recent studies indicate that approximately 95% of crop pests spend at least part of their lifecycle in the soil, making effective soil treatment crucial for crop protection. The severity of these threats is exemplified by documented cases where soil-borne plant pathogens have caused between 50-75% yield losses in major crops such as wheat, cotton, maize, vegetables, and fruits. This has spurred innovation in soil treatment formulations and application methods to combat these challenges more effectively.
Environmental sustainability has emerged as a key focus area in soil treatment practices, with increasing emphasis on reducing the chemical footprint while maintaining efficacy. The industry is witnessing a shift toward more targeted application methods, including soil drenching, broadcast, and furrow application techniques, which help minimize environmental impact while maximizing treatment effectiveness. These methods have proven particularly successful in managing white grub infestations, which have been shown to reduce root systems by approximately 25% in soybeans and up to 64% in maize crops when left untreated.
The market is seeing rapid technological advancement in soil treatment formulations and application methods. Manufacturers are developing new active ingredients and improved delivery systems that offer better efficacy and longer-lasting protection. The integration of soil health monitoring systems with treatment applications is gaining traction, allowing farmers to make more informed decisions about treatment timing and dosage. This technological evolution is particularly evident in the management of weed populations, where studies have shown that untreated weed infestations can cause average yield reductions of up to 37% in major crops like soybeans, highlighting the critical importance of effective soil treatment strategies.
Global Soil Treatment Market Trends and Insights
The increasing infestation of soil borne pest, diseases, and weeds, the per hectare consumption of soil treatment of pesticides is likely to increase globally
- The global average consumption of crop protection chemicals through soil application mode was recorded as 2,345.0 g per ha of agricultural land in 2022, which increased by 13.6% compared to 2017, which was 2,065.0 g per ha.
- The growing trend toward the adoption of modern farming practices, including no-till and minimum-till farming, is increasing the pest population in the soil, necessitating the soil application of pesticides to control pests, weeds, and soil-borne diseases.
- Herbicides, specifically pre-emergent herbicides, are generally applied to soil as they specifically target weed seeds, impeding their germination even prior to crop sowing. This approach has gained popularity due to its ability to proactively manage weed populations proactively, ensuring better crop establishment and overall weed control.
- The white grub infestation reduced the root system by approximately 25% in soybeans and 64% in maize. It was observed that Phyllophaga capillata and Aegopsis bolboceridus damaged all evaluated variables, reducing overall soybean productivity by 58.62% and maize productivity by 59.76% in South American countries like Brazil. All these soil-borne pests may effectively be controlled by soil application of insecticides.
- Similarly, nematodes like Meloidogyne incognita and Pratylenchus brachyurus cause significant losses in fruit and vegetable crops. For instance, carrots are susceptible to considerable losses, averaging up to 20.0%. As these parasitic nematodes are soil-dwelling organisms, it is important to treat the soil with nematicides to kill these organisms.


Soil treatment pesticide usage is increasing with the need for controlling soil-borne diseases
- Amid the dynamic landscape of the pesticide market, soil treatment pesticides stand out as crucial components. These specialized chemicals play a pivotal role in fostering healthy crop growth, effective pest and disease control, and sustainable agricultural practices.
- Cypermethrin is a pyrethroid insecticide that may be used as a soil treatment pesticide. When applied to the soil, it provides effective control against a variety of soil-borne pests, including termites and root maggots. Cypermethrin's mode of action involves targeting the nervous system of the pests upon contact, leading to paralysis and eventual death. It was priced at USD 21.0 thousand per metric ton in 2022.
- Atrazine is an herbicide commonly used as a soil treatment to control various broadleaf and grassy weeds in agricultural fields and non-crop areas. It is particularly effective in managing weed populations that compete with crops for nutrients, water, and sunlight. In 2022, it was priced at USD 13.8 thousand per metric ton.
- Malathion is an organophosphate insecticide used as a soil treatment to control a variety of insect pests in agricultural fields and non-crop areas. It is effective in managing both flying and crawling insects that may cause damage to crops and other plants. Malathion was priced at USD 12.5 thousand per metric ton.
- Mancozeb is a fungicide and soil treatment used to control various fungal diseases such as damping-off, blight, and downy mildew. It belongs to the class of dithiocarbamates and is known for its broad-spectrum activity against a wide range of plant pathogens. In 2022, it was priced at USD 7.8 thousand per metric ton.

Segment Analysis: Function
Herbicide Segment in Soil Treatment Market
The herbicide segment dominates the global soil treatment market, commanding approximately 73% market share in 2024, with a market value of nearly USD 20 billion. This significant market position is attributed to the growing adoption of modern farming practices, including no-till and minimum-till farming, where herbicides can be applied with precision through soil treatment methods. The segment's dominance is particularly evident in targeting specific areas where weed pressure is high, thereby optimizing herbicide use and reducing costs. Herbicides specifically target weed seeds, impeding their germination even prior to crop sowing, which has gained popularity due to its proactive approach to weed population management. This method ensures better crop establishment and overall weed control, making it the preferred choice for farmers worldwide. The segment's growth is further supported by its effectiveness in both pre-emergent and post-emergent weed control applications.

Growth Trajectory of Herbicide Segment
The herbicide segment is projected to maintain its market leadership with robust growth, expected to advance at a rate of approximately 5% during the forecast period 2024-2029. This growth is driven by several factors, including the increasing adoption of precision farming techniques and the rising need for effective weed management solutions. The segment's expansion is supported by technological advancements in herbicide formulations that enhance their effectiveness when applied through soil treatment methods. Additionally, the growing awareness among farmers about the benefits of pre-emergent weed control and the cost-effectiveness of soil-applied herbicides contributes to this segment's accelerated growth. The development of new herbicide compounds specifically designed for soil application, combined with improved application technologies, is expected to further drive the segment's growth trajectory.
Remaining Segments in Function Segmentation
The soil treatment market encompasses several other important segments, including insecticides, nematicides, fungicides, and molluscicides, each serving specific pest control needs. Insecticides play a crucial role in controlling soil-dwelling pests that affect root systems and early plant growth stages. Nematicides are essential for managing microscopic worm populations that can severely impact crop yields. Fungicides are vital for preventing and treating various soil-borne diseases that affect plant health from the root level. Molluscicides, while representing a smaller segment, are important for controlling slugs and snails that can damage emerging plants. Each of these segments contributes to the comprehensive pest management approach required in modern agriculture, offering farmers a complete toolkit for soil-based pest control solutions.
Segment Analysis: Crop Type
Grains & Cereals Segment in Soil Treatment Market
The grains and cereals segment dominates the global soil treatment market, commanding approximately 45% market share in 2024, with a market value of USD 12.4 billion. This segment's prominence is primarily attributed to the extensive cultivation area of major crops like corn, wheat, rice, oats, and barley, which collectively cover about 49% of the total crop area. These crops face significant challenges during their early growth stages from soil-borne diseases, pests, and weeds, necessitating comprehensive soil treatment solutions. The segment is projected to maintain its market leadership while growing at around 5% CAGR through 2024-2029, driven by rising crop losses and an increasing focus on enhancing crop protection and productivity. Soil treatments provide a long-lasting and preventive approach to pest control by targeting soil-dwelling pests like nematodes and soil-borne insects and diseases, while herbicides suppress weed growth, preventing competition for resources with the desired crops.
Remaining Segments in Crop Type
The soil remediation market encompasses several other significant segments, including pulses & oilseeds, fruits & vegetables, commercial crops, and turf & ornamental applications. The pulses & oilseeds segment represents the second-largest share, driven by the cultivation of crops like soybeans, sunflower, groundnut, sesame, and rapeseed. The fruits & vegetables segment focuses on protecting high-value crops from soil-borne diseases and pests, while the commercial crops segment serves important crops like coffee, rubber, tea, cashew nuts, and cotton. The turf & ornamental segment, though smaller, plays a crucial role in maintaining the health and appearance of golf courses, sports fields, and ornamental plantations. Each of these segments contributes uniquely to the market's diversity, addressing specific crop protection needs and soil health requirements across different agricultural applications.
Soil Treatment Market Geography Segment Analysis
Soil Treatment Market in Africa
The African soil treatment market demonstrates significant potential across various agricultural sectors. South Africa leads the regional soil market with advanced agricultural practices and increasing adoption of soil treatment solutions. The region faces unique challenges in pest management, with insect pests causing substantial crop yield losses. African countries are increasingly recognizing the importance of soil treatment methods, particularly in controlling soil-borne diseases and managing persistent pests that affect crop productivity.
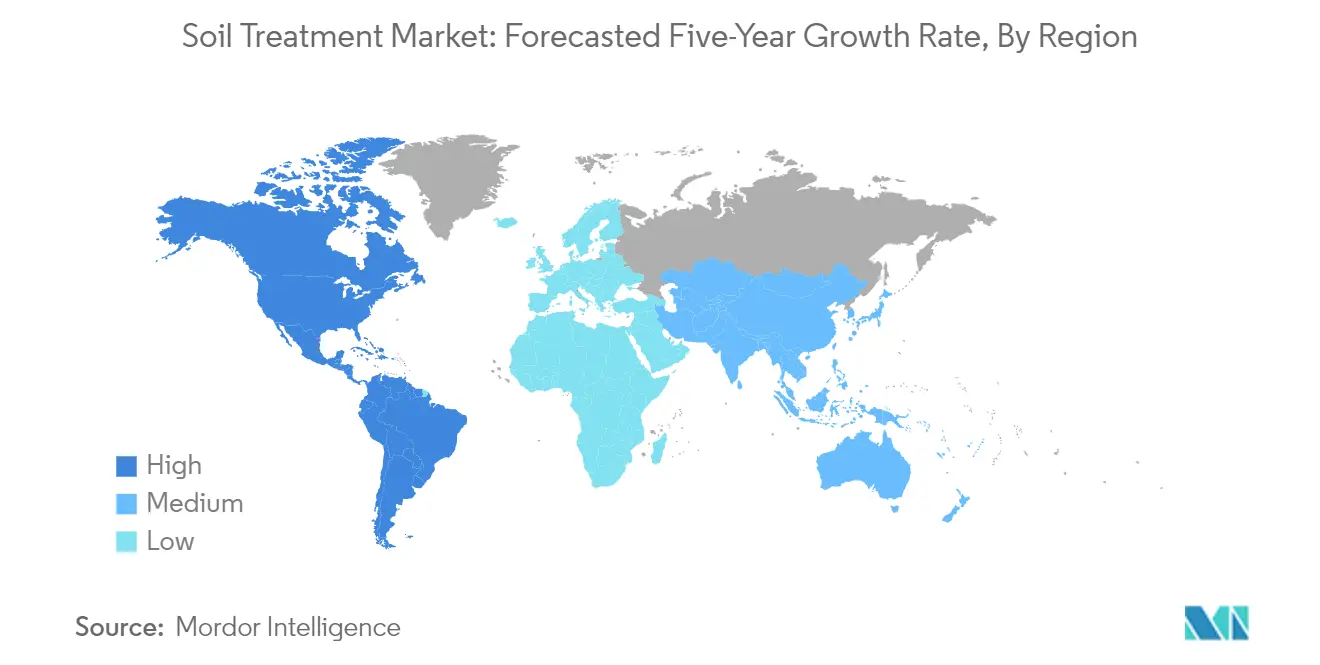
Soil Treatment Market in Asia-Pacific
The Asia-Pacific region represents a dynamic soil treatment market for soil treatment solutions, characterized by diverse agricultural landscapes and varying pest management needs. Countries like Australia, Japan, China, and India demonstrate strong market presence, with different approaches to soil treatment based on their specific agricultural requirements and environmental conditions. The region's agricultural sector faces challenges from various soil-borne diseases, pests, and weeds, driving the demand for effective soil treatment solutions.
Soil Treatment Market in Australia
Australia leads the Asia-Pacific soil treatment market with approximately 25% market share in 2024. The country's advanced agricultural practices and comprehensive pest management strategies contribute to its market dominance. Australian farmers particularly focus on herbicide applications through soil treatment methods, effectively managing various weed species that pose significant threats to crop productivity.
Soil Treatment Market in Thailand
Thailand emerges as the fastest-growing market in the Asia-Pacific region, with an expected growth rate of approximately 8% from 2024 to 2029. The country's agricultural sector demonstrates increasing adoption of soil treatment methods, particularly in rice cultivation where soil-borne pests and diseases pose significant challenges. Thai farmers are increasingly recognizing the importance of soil-borne pest control and the advantages of utilizing soil treatment to protect their crops.
Soil Treatment Market in Europe
The European soil treatment market showcases a sophisticated approach to agricultural pest management, supported by stringent regulations and advanced farming practices. The region's market is characterized by a strong presence in countries like France, Germany, Russia, and the United Kingdom, each contributing significantly to the overall market dynamics. The European Union's mission "A Soil Deal for Europe" demonstrates the region's commitment to sustainable soil treatment practices.
Soil Treatment Market in France
France maintains its position as the largest market in Europe, holding approximately 28% market share in 2024. The country's advanced agricultural sector and comprehensive approach to pest management contribute to its market leadership. French farmers demonstrate particular emphasis on pre-emergent herbicide applications and integrated pest management strategies, which are integral to the soil treatment market.
Soil Treatment Market in France - Growth Trajectory
France also leads the European region in terms of growth, with an anticipated growth rate of approximately 6% from 2024 to 2029. The country's agricultural sector shows increasing adoption of innovative soil treatment solutions, particularly in vineyard management and cereal crop protection. French farmers are increasingly embracing sustainable soil treatment practices while maintaining high agricultural productivity.
Soil Treatment Market in North America
North America represents a mature soil treatment market for soil treatment solutions, with extensive agricultural operations across the United States, Canada, and Mexico. The region demonstrates advanced farming practices and sophisticated pest management strategies. The United States emerges as both the largest and fastest-growing market in the region, driven by extensive agricultural operations and increasing adoption of innovative soil treatment solutions.
Soil Treatment Market in South America
The South American soil treatment market shows significant potential, with countries like Argentina, Brazil, and Chile demonstrating strong agricultural sectors. The region's diverse agricultural landscape and increasing focus on crop protection drive market growth. Argentina emerges as both the largest and fastest-growing market in the region, supported by extensive soybean cultivation and advanced farming practices. The integration of soil monitoring technologies is also enhancing the effectiveness of soil treatment strategies across the continent.

Competitive Landscape
Top Companies in Soil Treatment Market
The global soil treatment market features several prominent players, including Syngenta Group, Bayer AG, BASF SE, FMC Corporation, and ADAMA Agricultural Solutions Ltd, leading the competitive landscape. These companies are actively investing in research and development to create innovative soil treatment solutions, particularly focusing on environmentally sustainable products and precision application technologies. Strategic expansion through manufacturing facility investments has been a key trend, with companies establishing new production sites to strengthen their regional presence and supply chain capabilities. Product portfolio diversification through both organic development and strategic acquisitions has enabled companies to offer comprehensive soil treatment solutions across different crop segments. The industry has witnessed significant collaboration between major players and agricultural technology firms to develop integrated digital solutions for optimized soil treatment applications.
Consolidated Market with Strong Regional Players
The soil treatment market exhibits a moderately fragmented structure, characterized by the presence of both global agricultural conglomerates and specialized regional players. The major multinational companies leverage their extensive distribution networks, established brand recognition, and significant research capabilities to maintain their market positions. These industry leaders have built strong relationships with farmers through comprehensive support services, including soil analysis, application guidance, and post-treatment monitoring. The market has witnessed considerable consolidation through strategic acquisitions, particularly in emerging agricultural markets, as companies seek to expand their geographical footprint and acquire local expertise.
The competitive dynamics vary significantly across regions, with local players maintaining strong positions in specific markets through their deep understanding of regional agricultural practices and established farmer relationships. Market entry barriers are relatively high due to the extensive regulatory requirements, need for significant research and development investments, and importance of established distribution networks. The industry has seen increased collaboration between established players and agricultural technology startups, particularly in developing digital solutions for precision agriculture and sustainable soil treatment applications.
Innovation and Sustainability Drive Future Success
Success in the soil treatment market increasingly depends on companies' ability to develop sustainable and environmentally friendly solutions while maintaining efficacy. Market leaders are investing heavily in developing new active ingredients and formulations that offer improved performance with reduced environmental impact. Digital integration has become crucial, with companies developing smart soil treatment solutions that enable precise application and monitoring. The ability to provide comprehensive solutions that address multiple soil-related challenges while complying with evolving regulatory requirements has become a key differentiator for market players.
For new entrants and smaller players, success lies in identifying and serving specific market niches or regional opportunities where larger players may have limited presence. Companies are focusing on developing specialized solutions for specific crop types or soil conditions, creating opportunities for differentiation. Building strong relationships with local farming communities and offering specialized technical support has proven effective in gaining market share. The increasing focus on sustainable agriculture and organic farming practices presents opportunities for companies to develop innovative biological soil treatment solutions. Success also depends on the ability to navigate complex regulatory environments while maintaining cost-effective operations and establishing reliable distribution networks.
Soil Treatment Industry Leaders
ADAMA Agricultural Solutions Ltd
BASF SE
Bayer AG
FMC Corporation
Syngenta Group
- *Disclaimer: Major Players sorted in no particular order


Recent Industry Developments
- January 2023: Bayer formed a new partnership with Oerth Bio to enhance crop protection technology and create more eco-friendly crop protection solutions.
- June 2022: AgriNova New Zealand Ltd was acquired by ADAMA Ltd. With this acquisition, ADAMA expanded its product line in the New Zealand market.
- October 2021: By investing in a new chemist's center, ADAMA enhanced its R&D capabilities that are aimed to expand and accelerate its own research and development in the field of plant protection.


Global Soil Treatment Market Report Scope
Fungicide, Herbicide, Insecticide, Molluscicide, Nematicide are covered as segments by Function. Commercial Crops, Fruits & Vegetables, Grains & Cereals, Pulses & Oilseeds, Turf & Ornamental are covered as segments by Crop Type. Africa, Asia-Pacific, Europe, North America, South America are covered as segments by Region.Function
| Fungicides |
| Herbicides |
| Insecticides |
| Molluscicide |
| Nematicide |
Crop Type
| Commercial Crops |
| Fruits & Vegetables |
| Grains & Cereals |
| Pulses & Oilseeds |
| Turf & Ornamental |
Region
| Africa | By Country | South Africa |
| Rest of Africa | ||
| Asia-Pacific | By Country | Australia |
| China | ||
| India | ||
| Indonesia | ||
| Japan | ||
| Myanmar | ||
| Pakistan | ||
| Philippines | ||
| Thailand | ||
| Vietnam | ||
| Rest of Asia-Pacific | ||
| Europe | By Country | France |
| Germany | ||
| Italy | ||
| Netherlands | ||
| Russia | ||
| Spain | ||
| Ukraine | ||
| United Kingdom | ||
| Rest of Europe | ||
| North America | By Country | Canada |
| Mexico | ||
| United States | ||
| Rest of North America | ||
| South America | By Country | Argentina |
| Brazil | ||
| Chile | ||
| Rest of South America |
| Function | Fungicides | ||
| Herbicides | |||
| Insecticides | |||
| Molluscicide | |||
| Nematicide | |||
| Crop Type | Commercial Crops | ||
| Fruits & Vegetables | |||
| Grains & Cereals | |||
| Pulses & Oilseeds | |||
| Turf & Ornamental | |||
| Region | Africa | By Country | South Africa |
| Rest of Africa | |||
| Asia-Pacific | By Country | Australia | |
| China | |||
| India | |||
| Indonesia | |||
| Japan | |||
| Myanmar | |||
| Pakistan | |||
| Philippines | |||
| Thailand | |||
| Vietnam | |||
| Rest of Asia-Pacific | |||
| Europe | By Country | France | |
| Germany | |||
| Italy | |||
| Netherlands | |||
| Russia | |||
| Spain | |||
| Ukraine | |||
| United Kingdom | |||
| Rest of Europe | |||
| North America | By Country | Canada | |
| Mexico | |||
| United States | |||
| Rest of North America | |||
| South America | By Country | Argentina | |
| Brazil | |||
| Chile | |||
| Rest of South America | |||


Market Definition
- Function - Crop Protection Chemicals are apllied to control or prevent pests, including insects, fungi, weeds, nematodes, and mollusks, from damaging the crop and to protect the crop yield.
- Application Mode - Soil Treatment is a method of applying crop protection chemicals to the soil directly to prevent or control pests.
- Crop Type - This represents the consumption of crop protection chemicals by Cereals, Pulses, Oilseeds, Fruits, Vegetables, Turf, and Ornamental crops.
| Keyword | Definition |
|---|---|
| IWM | Integrated weed management (IWM) is an approach to incorporate multiple weed control techniques throughout the growing season to give producers the best opportunity to control problematic weeds. |
| Host | Hosts are the plants that form relationships with beneficial microorganisms and help them colonize. |
| Pathogen | A disease-causing organism. |
| Herbigation | Herbigation is an effective method of applying herbicides through irrigation systems. |
| Maximum residue levels (MRL) | Maximum Residue Limit (MRL) is the maximum allowed limit of pesticide residue in food or feed obtained from plants and animals. |
| IoT | The Internet of Things (IoT) is a network of interconnected devices that connect and exchange data with other IoT devices and the cloud. |
| Herbicide-tolerant varieties (HTVs) | Herbicide-tolerant varieties are plant species that have been genetically engineered to be resistant to herbicides used on crops. |
| Chemigation | Chemigation is a method of applying pesticides to crops through an irrigation system. |
| Crop Protection | Crop protection is a method of protecting crop yields from different pests, including insects, weeds, plant diseases, and others that cause damage to agricultural crops. |
| Seed Treatment | Seed treatment helps to disinfect seeds or seedlings from seed-borne or soil-borne pests. Crop protection chemicals, such as fungicides, insecticides, or nematicides, are commonly used for seed treatment. |
| Fumigation | Fumigation is the application of crop protection chemicals in gaseous form to control pests. |
| Bait | A bait is a food or other material used to lure a pest and kill it through various methods, including poisoning. |
| Contact Fungicide | Contact pesticides prevent crop contamination and combat fungal pathogens. They act on pests (fungi) only when they come in contact with the pests. |
| Systemic Fungicide | A systemic fungicide is a compound taken up by a plant and then translocated within the plant, thus protecting the plant from attack by pathogens. |
| Mass Drug Administration (MDA) | Mass drug administration is the strategy to control or eliminate many neglected tropical diseases. |
| Mollusks | Mollusks are pests that feed on crops, causing crop damage and yield loss. Mollusks include octopi, squid, snails, and slugs. |
| Pre-emergence Herbicide | Preemergence herbicides are a form of chemical weed control that prevents germinated weed seedlings from becoming established. |
| Post-emergence Herbicide | Postemergence herbicides are applied to the agricultural field to control weeds after emergence (germination) of seeds or seedlings. |
| Active Ingredients | Active ingredients are the chemicals in pesticide products that kill, control, or repel pests. |
| United States Department of Agriculture (USDA) | The Department of Agriculture provides leadership on food, agriculture, natural resources, and related issues. |
| Weed Science Society of America (WSSA) | The WSSA, a non-profit professional society, promotes research, education, and extension outreach activities related to weeds. |
| Suspension concentrate | Suspension concentrate (SC) is one of the formulations of crop protection chemicals with solid active ingredients dispersed in water. |
| Wettable powder | A wettable powder (WP) is a powder formulation that forms a suspension when mixed with water prior to spraying. |
| Emulsifiable concentrate | Emulsifiable concentrate (EC) is a concentrated liquid formulation of pesticide that needs to be diluted with water to create a spray solution. |
| Plant-parasitic nematodes | Parasitic Nematodes feed on the roots of crops, causing damage to the roots. These damages allow for easy plant infestation by soil-borne pathogens, which results in crop or yield loss. |
| Australian Weeds Strategy (AWS) | The Australian Weeds Strategy, owned by the Environment and Invasives Committee, provides national guidance on weed management. |
| Weed Science Society of Japan (WSSJ) | WSSJ aims to contribute to the prevention of weed damage and the utilization of weed value by providing the chance for research presentation and information exchange. |


Research Methodology
Mordor Intelligence follows a four-step methodology in all our reports.
- Step-1: Identify Key Variables: In order to build a robust forecasting methodology, the variables and factors identified in Step-1 are tested against available historical market numbers. Through an iterative process, the variables required for market forecast are set and the model is built on the basis of these variables.
- Step-2: Build a Market Model: Market-size estimations for the forecast years are in nominal terms. Inflation is not a part of the pricing, and the average selling price (ASP) is kept constant throughout the forecast period.
- Step-3: Validate and Finalize: In this important step, all market numbers, variables and analyst calls are validated through an extensive network of primary research experts from the market studied. The respondents are selected across levels and functions to generate a holistic picture of the market studied.
- Step-4: Research Outputs: Syndicated Reports, Custom Consulting Assignments, Databases & Subscription Platforms


