
Soft Magnetic Material Market Size and Share
Market Overview
| Study Period | 2021 - 2031 |
|---|---|
| Market Volume (2026) | 11.43 Million tons |
| Market Volume (2031) | 15.97 Million tons |
| Growth Rate (2026 - 2031) | 6.92 % |
| Fastest Growing Market | Middle East and Africa |
| Largest Market | Asia Pacific |
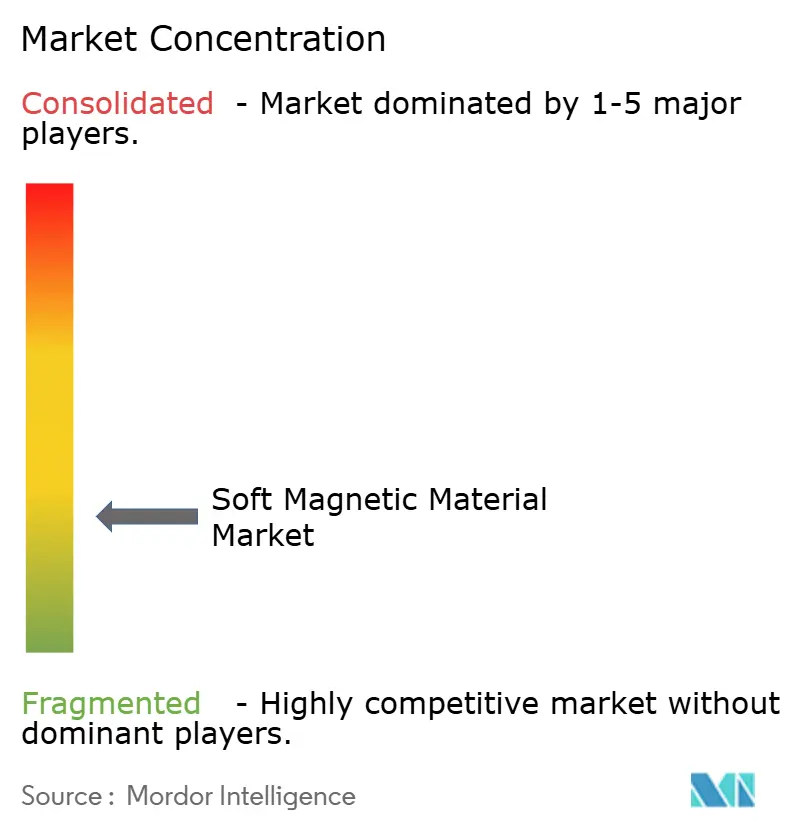
| Market Concentration | Low |
Major Players *Disclaimer: Major Players sorted in no particular order Image © Mordor Intelligence. Reuse requires attribution under CC BY 4.0. | |
Soft Magnetic Material Market Analysis by Mordor Intelligence
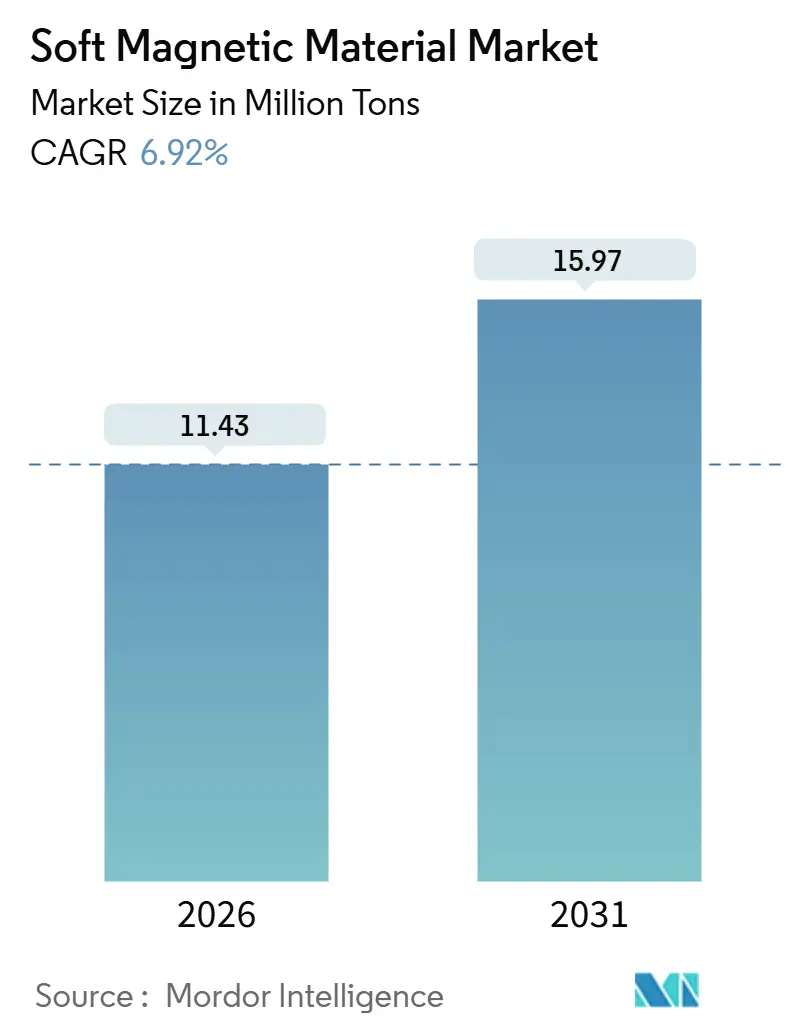
The Soft Magnetic Material Market size is estimated at 11.43 million tons in 2026, and is expected to reach 15.97 million tons by 2031, at a CAGR of 6.92% during the forecast period (2026-2031). Rapid electrification of vehicle powertrains, stringent energy-efficiency rules for transformers and motors, and the migration of consumer-electronics power stages toward switching frequencies above 100 kHz are the primary growth catalysts. Electric steel retains critical volume thanks to its cost-per-kilowatt advantage, yet demand for soft magnetic composites and nanocrystalline ribbons is accelerating as designers target lighter, quieter, and higher-frequency cores. Asia-Pacific dominates the soft magnetic materials market due to China’s integrated steel ecosystem and India’s transformer build-out, while the Middle-East and Africa are emerging as the fastest-growing region on the back of grid-modernization projects. Competitive dynamics are shifting as powder-metallurgy specialists and additive-manufacturing start-ups win share from incumbent steelmakers through custom geometries and three-dimensional flux paths.
Key Report Takeaways
- By material type, electric steel led with 52.46% of the soft magnetic materials market share in 2025, while soft magnetic composites and advanced ferrites are advancing at a 7.34% CAGR through 2031.
- By end-user industry, electronics contributed 34.28% of 2025 volume, but automotive is forecast to expand at a 7.27% CAGR to 2031 on the back of rapid EV and HEV adoption.
- By geography, the Asia-Pacific held 49.37% of the market share in 2025. While the Middle-East and Africa are forecast to expand at a 7.22% CAGR through 2031, the fastest regional pace.
Note: Market size and forecast figures in this report are generated using Mordor Intelligence’s proprietary estimation framework, updated with the latest available data and insights as of January 2026.
Market Trends and Insights
Drivers Impact Analysis of Soft Magnetic Material Market*
| Drivers | (~) % Impact on CAGR Forecast | Geographic Relevance | Impact Timeline |
|---|---|---|---|
| Electronics-miniaturization demand surge | +1.2% | APAC core, spill-over to North America | Medium term (2-4 years) |
| Electrification of transformers and motors | +1.5% | EU and China, expanding to India and ASEAN | Long term (≥ 4 years) |
| Rapid EV/HEV power-train adoption | +1.8% | APAC core, North America, Western Europe | Medium term (2-4 years) |
| Additive manufacturing of custom cores | +0.6% | North America and EU | Long term (≥ 4 years) |
| Nanocrystalline and amorphous cores for SiC/GaN power electronics | +1.1% | Global research and development led by Japan, Germany, United States | Medium term (2-4 years) |
| Source: Mordor Intelligence | |||
Electronics-Miniaturization Demand Surge
As demand surges for ultra-compact inductors in smartphones, wearables, and edge-AI servers, designers are increasingly gravitating towards switching frequencies exceeding 1 MHz[1]Apple Inc., “Apple Annual Report 2025,” apple.com. At these frequencies, laminated silicon steel faces significant eddy-current losses. In the realm of DC-DC converters under 100 W, ferrite beads, powder cores, and soft magnetic composites have taken the lead. Within rack-level power-delivery networks, point-of-load converters are now seeking magnetic components under 5 mm³. This preference has led to a rise in distributed-gap powder cores, known for maintaining inductance even under DC bias. Suppliers are innovating by co-firing nickel-zinc ferrite with low-temperature co-fired ceramic substrates. This integration allows for the embedding of capacitors and magnetics within modules just 1 mm thick, marking a decisive move away from conventional laminated cores. The outcome? Enhanced performance characterized by increased power density and reduced EMI, solidifying the position of advanced ferrites and composites in the soft magnetic materials market.
Electrification of Transformers and Motors
Regulators have aggressively targeted loss reductions for transformers and industrial motors. Under IEC 60034-30-1, the IE4 and IE5 classes are mandated, achieving significant cuts in no-load losses[2]International Electrotechnical Commission, “IEC 60034-30-1,” iec.ch. To comply, grain-oriented electric steel is needed, boasting a high flux density at 50 Hz. Additionally, non-oriented grades must be optimized for high-frequency traction motors. The EU's Ecodesign extension is now encompassing sub-0.75 kW motors. This shift is channeling additional volumes into fractional-horsepower drives, which traditionally relied on lower-grade cold-rolled steel. On another front, there's ongoing experimentation with amorphous metal stators. These hold the potential for a remarkable reduction in core losses, though their brittleness poses a challenge in manufacturing. As a result of these regulatory pushes, there's a sustained baseline demand for electric steel. Simultaneously, these developments are carving out niches for amorphous and nanocrystalline alternatives in the soft magnetic materials market.
Rapid EV/HEV Power-Train Adoption
Battery-electric and plug-in hybrids consumed soft magnetic material in 2025, with a significant portion going into traction motors. Each permanent-magnet synchronous motor requires non-oriented electric steel, and migration to 800 V architectures is boosting the need for nanocrystalline common-mode chokes. Ferrite-assisted synchronous reluctance motors, commercialized by leading European automakers in 2024–2025, forgo rare-earth magnets but raise soft magnetic content per vehicle. China’s production of new-energy vehicles increased in 2025, and output is expected to grow further by 2028, implying cumulative demand over the forecast horizon. This makes automotive the highest-growth opportunity within the soft magnetic materials market.
Additive Manufacturing of Custom Cores
Laser powder-bed fusion and binder jetting have enabled the creation of toroidal and topology-optimized cores, a feat previously unattainable through stamping or tape winding. A 3D-printed nanocrystalline transformer core achieved a reduction in no-load losses and elevated power density. Presently, challenges persist with build speeds lagging and powder costs remaining high. Yet, aerospace and medical OEMs have emerged as early adopters, drawn by the elimination of tooling and the advantages of conformal cooling features. Additive manufacturing could capture demand in programs characterized by low volume and high mix. As advancements in throughput and powder recycling continue, additive manufacturing is poised to become a pivotal differentiator for suppliers in the competitive landscape of the soft magnetic materials market.
Restraints Impact Analysis of Soft Magnetic Material Market*
| Restraints | (~) % Impact on CAGR Forecast | Geographic Relevance | Impact Timeline |
|---|---|---|---|
| Raw-material price volatility (Fe, Ni, Co) | -0.8% | Global, with acute impact on permalloy and supermalloy producers in North America and Europe | Short term (≤ 2 years) |
| Substitute competition (laminated alloys, powder cores) | -0.4% | Global, concentrated in mid-frequency applications (10-100 kHz) across automotive and industrial segments | Medium term (2-4 years) |
| EMC and safety compliance cost escalation | -0.3% | Global, most acute in EU and North America due to stringent IEC 61000 series enforcement | Medium term (2-4 years) |
| Source: Mordor Intelligence | |||
Raw-Material Price Volatility (Fe, Ni, Co)
Nickel prices swung during 2024–2025, while cobalt also experienced significant fluctuations, compressing margins for nickel permalloy producers. Silicon-metal surcharges for electrical steel spiked in early 2025 after power-curtailment policies in Yunnan and Sichuan provinces, further unsettling cost structures. Several western mills idled capacity or reformulated toward iron-cobalt alloys, creating supply uncertainty that encourages OEMs to dual-source or backward-integrate. Although iron ore stayed relatively stable, the nickel and cobalt volatility introduced a drag on the soft magnetic materials market CAGR.
Substitute Competition and EMC Compliance Cost Escalation
Powder cores and distributed-gap ferrites are eroding silicon-steel share below 100 kHz by offering lower eddy-current loss and complex shapes despite higher raw-material cost. IEC 61000-4-8 now mandates magnetic-field immunity testing, adding shielding or core redesign per inverter and extending product cycles. Certification fees burden small manufacturers and consolidate demand with vertically integrated players. The combined expense shaves growth from the forecast CAGR across the soft magnetic materials market.
*Our forecasts treat driver/restraint impacts as directional, not additive. The impact forecasts reflect baseline growth, mix effects, and variable interactions.
Soft Magnetic Material Market Segment Analysis
By Material Type:
Volume Anchored in Electric Steel, Innovation Led by CompositesElectric steel captured 52.46% of 2025 volume, buoyed by grain-oriented grades achieving high flux density and low core losses. To cater to the rising demand for traction motors, manufacturers bolstered their cold-rolling capacity during 2024 and 2025. Cobalt alloys, prized in aerospace, maintain Curie points exceeding 900 °C. While iron-based powder cores cater to mid-frequency inductors, their permeability is capped at sub-200 values. On the other hand, soft magnetic composites and advanced ferrites are advancing at a 7.34% CAGR through 2031. Dominating EMC suppression, nickel-zinc and manganese-zinc ferrites saw widespread adoption. This landscape positions electric steel as the volume cornerstone, while composites and nanocrystalline alloys command premium margins, highlighting a strategic investment landscape in the soft magnetic materials market from 2026 to 2031.




By End-User Industry:
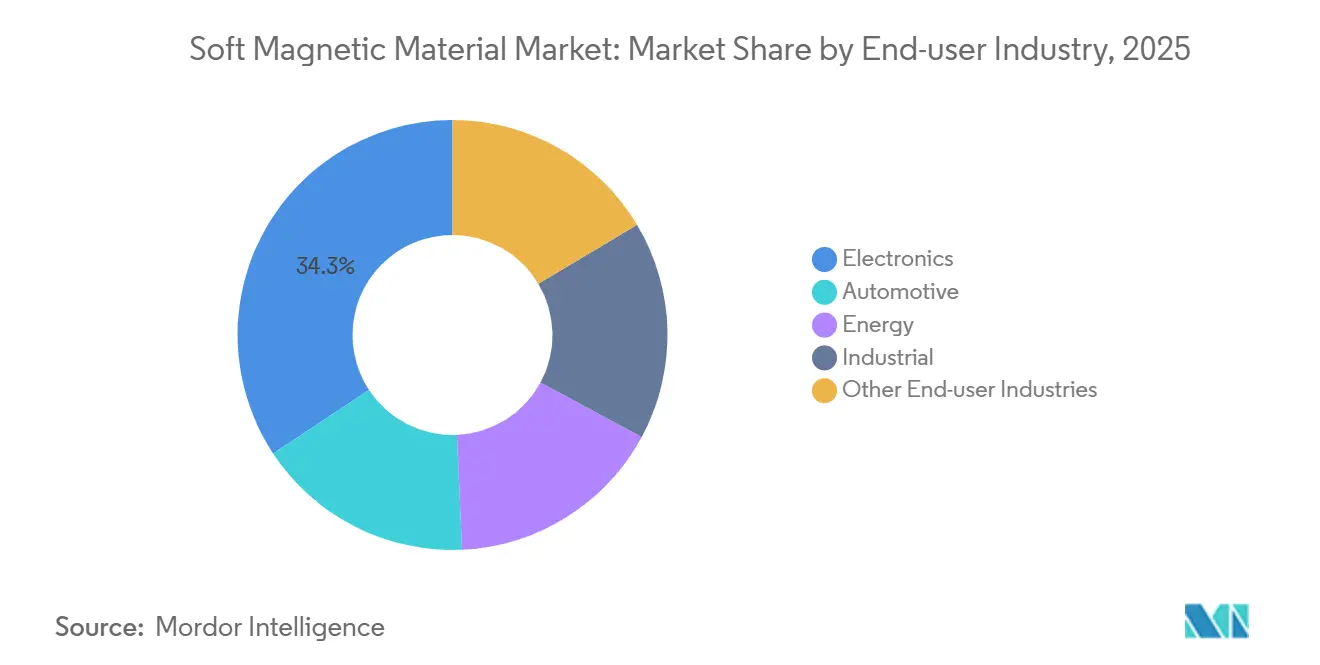
Electronics Leads Share, Automotive Powers GrowthElectronics accounted for 34.28% of 2025 demand, reflecting massive inductor and filter counts in power supplies, data-center racks, and mobile devices. Unit growth is modest, but miniaturization steers the mix toward high-value ferrites. Automotive applications are expanding at a 7.27% CAGR, with battery-electric vehicles now incorporating more magnetics compared to internal-combustion cars.
In 2025, energy infrastructure consumption was driven by UHV lines in China and India that necessitate premium grain-oriented steel. Industrial motors and automation saw increased demand, with upgrades to IE4/IE5 boosting the need for non-oriented steel. While niche applications in medical imaging and telecom together make up a smaller share of the volume, they command elevated prices due to their stringent performance requirements. This diverse consumption profile highlights the need for multi-material portfolios in the soft magnetic materials market to strike a balance between scale and profitability.
Geography Analysis
APAC Soft Magnetic Material Market
Asia-Pacific held 49.37% of global volume in 2025, accounting for a significant share of the total volume. China's output of electrical steel and Japan's expertise in nanocrystalline ribbons were pivotal. India, with its consumption of grain-oriented steel for transformers, is ramping up local mill capacities to reduce imports. During 2024–2025, ASEAN nations drew in substantial foreign direct investment for magnetic-materials manufacturing, as producers shifted closer to automotive assembly hubs.
North America and Europe Soft Magnetic Material Market
North America, capturing a notable portion of the 2025 demand, was driven by sectors like EV powertrains, data-center expansions, and aerospace electrification. Thanks to the Inflation Reduction Act, new electrical-steel lines are emerging, highlighted by Arnold Magnetic Technologies' addition of capacity in 2025. Europe, with its consumption of electrical steel, is navigating strict Ecodesign regulations, especially with many of its industrial motors set for IE4 upgrades by 2027.
MEA and South America Soft Magnetic Material Market
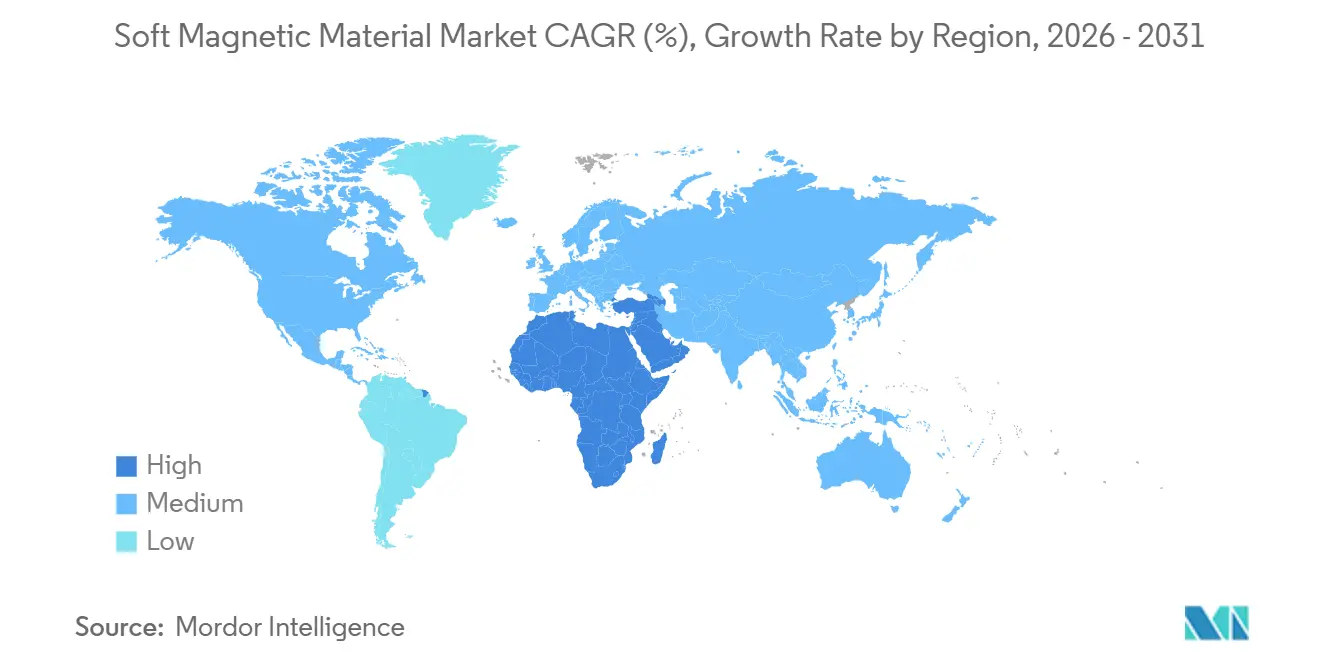
The Middle-East and Africa are on track for a 7.22% CAGR, bolstered by renewable-grid projects in Saudi Arabia, the UAE, and South Africa, all of which have a pressing need for low-loss transformer cores. In South America, the market is predominantly Brazilian, where the production of automotive and white goods propels the demand for non-oriented steel. While Gerdau and Aperam cater to local motor manufacturers, grain-oriented grades still find their way through imports. This geographic dispersion in both demand and capacity highlights the critical need for regionalized supply chains in the soft magnetic materials market.

Regulatory Landscape
Regulation for soft magnetic materials is shaped by energy-efficiency rules that translate into transformer and motor loss limits, alongside chemical compliance requirements that govern material formulations and supply documentation. Industrial motor efficiency requirements referenced under IEC 60034-30-1 (IE4/IE5 classes) raise the bar for non-oriented electrical steel and alternative core materials used in electrified drives, while EMC compliance is tightened through enforcement of IEC 61000-series immunity testing requirements that can drive core redesigns and additional qualification steps.
Market access also depends on standards and substance compliance tracking. China issued GB/T 21220-2024 (soft magnetic metallic materials) on September 29, 2024, and released GB/T 44654-2024 (amorphous soft magnetic alloy wire) and GB/T 44655-2024 (amorphous soft magnetic alloy powder) on September 29, 2024, with implementation beginning April 1, 2025, signaling tighter specification control for amorphous and powder forms used in high-frequency and molded-inductor applications. The EU continues to anchor chemical requirements under REACH Regulation (EC) No 1907/2006, with ongoing SVHC list updates through 2026. This pushes producers and downstream component makers to maintain compliance documentation and material traceability for cores, binders, and coatings used across electronics, automotive, and grid equipment.
Value Chain Analysis
The value chain starts with upstream feedstocks (iron ore and scrap, nickel and cobalt for specialty alloys, and silicon metal for electrical steel). It then moves through melting and alloying, casting and rolling for electrical steel, or rapid-solidification routes for amorphous and nanocrystalline ribbons, along with powder production via atomized or milled iron-based and alloy powders. Midstream converters and component makers perform annealing, coating or insulation, slitting, stamping or blanking and stacking (laminations), tape-winding (toroids and cut cores), and powder compaction with heat treatment for soft magnetic composites. Downstream demand concentrates in electronics (inductors, filters, chokes for high-frequency power conversion), automotive (traction motors and EMI suppression in 400 V to 800 V architectures), and energy and industrial infrastructure (transformer cores and high-efficiency motors).
Industry structure is moving toward tighter integration between alloy producers and finished-core capability, where stress sensitivity and annealing control drive losses for both electrical steel and nanocrystalline products. Aperam’s April 2026 acquisition of Magnetec Group is a concrete example, adding nanocrystalline ribbon and core manufacturing across facilities in Hungary, Moldova, Vietnam, and China, while linking alloy supply with downstream component production. Service models are also expanding beyond raw material delivery into custom processing and finished components to reduce customer qualification cycles and logistics complexity, and industry bodies such as the International Magnetics Association (IMA) under The Transformer Association support benchmarking and standardization across magnetic materials used by transformer and power-electronics supply chains.
Competitive Landscape
The soft magnetic material market is fragmented. Integrated steel giants have slashed conversion costs by operating continuous-annealing lines. Leaders in powder metallurgy are outpacing their competitors by offering soft magnetic composites that not only reduce assembly labor but also allow for intricate shapes. Suppliers of nanocrystalline materials dominate high-margin niches, with their ribbons fetching high prices and boasting significant gross margins. In terms of strategic maneuvers, expansions and acquisitions have been notable, along with joint ventures focusing on high-flux-density electric steel. The landscape of technology differentiation is evolving, now emphasizing additive manufacturing, gradient-index cores, and alloys tailored for specific applications, thereby elevating the entry barriers for newcomers in the soft magnetic materials arena.
Soft Magnetic Material Industry Leaders
PROTERIAL, Ltd.
TDK Corporation
JFE Steel Corporation
VACUUMSCHMELZE GmbH & Co. KG
Daido Steel Co., Ltd.
- *Disclaimer: Major Players sorted in no particular order
Soft Magnetic Material Market Companies Covered in this Report
- Acme Electronics Corporation
- Advanced Technology & Materials Co., Ltd.
- Arnold Magnetic Technologies
- Daido Steel Co., Ltd.
- DMEGC Magnetics Co., Ltd.
- Ferroxcube.
- JFE Steel Corporation
- Mate Co. Ltd.
- Mk Magnetics Inc
- PROTERIAL, Ltd.
- Sg Technologies
- Steward Advanced Materials LLC
- Sumitomo Metal Mining Co., Ltd
- TDK Corporation
- Toshiba Materials Co., Ltd
- VACUUMSCHMELZE GmbH & Co. KG

Market Opportunities and Future Outlook
A key whitespace is advanced soft magnetic materials for high-frequency, high-power-density conversion where traditional laminated electrical steel faces eddy-current losses, and where qualification and supply continuity limit adoption. Nanocrystalline cores illustrate the constraint and premiumization: April 2026 industry coverage reported that leading nanocrystalline core supply (including FINEMET and VITROPERM ecosystems) was sold out into mid-2026, tying demand pull to AI data-center power, EV powertrains, and solid-state transformer programs. In parallel, China’s transformer export strength and overseas order visibility through 2027, as reported in April 2026 industry updates, reinforces demand for low-loss core solutions and tighter specification control for amorphous and nanocrystalline strip and powder inputs.
Manufacturing localization and vertical integration offer a near-term lever to shorten lead times and reduce import dependence in large transformer markets. Proterial’s February 2026 announcement to establish Metglas amorphous metal material production in Sri City, India, with planned 30,000 tons annual capacity, points to investment aimed at domestic transformer efficiency upgrades and supply security for amorphous cores. On the technology front, ongoing R&D progress in 2026 on ultrathin nanocrystalline ribbon processing and loss-suppression approaches for Fe-based composites supports product roadmaps for switching frequencies above 100 kHz and compact converter magnetics. That, in turn, creates room for suppliers with process control in annealing, insulation or coating, and powder-to-core conversion to capture higher-value applications in electronics and electrified mobility.
Recent Industry Developments in Soft Magnetic Material Market
- April 2026: Aperam acquired Magnetec Group, adding nanocrystalline soft magnetic ribbon and core manufacturing capabilities across sites in Europe and Asia. The move deepens downstream integration within Aperam’s Alloys and Specialties activities and strengthens its position in higher-margin soft magnetic components used in power electronics and electrification.
- July 2025: Advanced Technology and Materials Co., Ltd. reported that it started new projects in 2025 across its materials portfolio, including amorphous and nanocrystalline materials. The initiative signals added development and potential capacity focus in advanced soft magnetic materials where demand is tied to high-efficiency transformers and high-frequency power conversion.
- March 2024: Cyclic Materials partnered with VACUUMSCHMELZE (VAC) to recycle by-products from permanent magnets. The collaboration supports circular supply-chain pathways for electrification end markets and strengthens availability of processed material streams that can reduce waste and improve sustainability credentials for magnetic-material manufacturing.


Soft Magnetic Material Market Report Scope and Research Methodology
Market Definition and Coverage
For this study, the market is defined as the global demand for soft magnetic materials used to carry and control magnetic flux in devices like motors, generators, transformers, inductors, and other electromagnetic components, measured as material consumption volume.
Scope exclusions: This sizing does not count permanent (hard) magnets or downstream finished electrical equipment revenues, and it also avoids double counting of in-house transfers across integrated producers.
Segments Covered in This Report
- By Material Type
- Electric Steel
- Cobalt
- Iron
- Nickel
- Other Material Types (Soft Magnetic Composites (SMC), Soft Ferrite, Silicon Ferrite, Permalloy, Supermalloy, etc.)
- By End-user Industry
- Electronics
- Automotive
- Energy
- Industrial
- Other End-user Industries (Telecommunication, Medical, Industrial Transformers, etc.)
- By Geography
- Asia-Pacific
- China
- India
- Japan
- South Korea
- ASEAN Countries
- Rest of Asia-Pacific
- North America
- United States
- Canada
- Mexico
- Europe
- Germany
- United Kingdom
- France
- Italy
- Spain
- Russia
- Rest of Europe
- South America
- Brazil
- Argentina
- Rest of South America
- Middle-East and Africa
- Saudi Arabia
- South Africa
- Rest of Middle-East and Africa
- Asia-Pacific
Data Sources, Market Sizing, and Validation
Desk Research
Desk research is used to set the market boundaries and to build the initial demand picture by region. We rely on public series such as USGS minerals and metals statistics, UN Comtrade trade flows for relevant metal and alloy forms, International Energy Agency electricity and grid indicators, World Steel Association production statistics, and selected standards and technical publications from IEEE and IEC that clarify typical use in motors and transformers.
Along with this, company annual reports, investor presentations, and reputed press are checked to understand capacity moves, plant utilization signals, and mix shifts between electrical steel, powder cores, and specialty alloys. Patent database screening is also used to see where newer soft magnetic composites and amorphous or nanocrystalline materials are being adopted, which helps validate direction of change even when volumes are not directly reported. The sources listed here are illustrative only, and many other public references were also used to collect, validate, and clarify data points.
Primary Interviews and Surveys
Primary work is used to confirm how demand is actually formed across end uses, and where substitution is happening between material families. We speak with a mix of material suppliers, component makers, and downstream users in power, industrial equipment, automotive electrification, and electronics, and we also test assumptions with independent technical experts so the volume conversion and loss-performance tradeoffs are not overstated.
Distribution of primary research fieldwork respondents
| Company type | Respondent position | Region |
|---|---|---|
| Top tier: 28% | CXOs: 18% | APAC: 38% |
| Mid tier: 51% | Functional/Unit leaders: 37% | EMEA: 37% |
| Smaller Players: 21% | Managers: 45% | Americas: 25% |
Market-Sizing & Forecasting
The market is primarily built using a top-down demand pool approach where electricity infrastructure build, motor and generator output, and power electronics adoption are translated into soft magnetic material consumption through realistic intensity factors. Because usage per unit can vary a lot by design, these factors are adjusted by application mix and by the prevailing technology choice in each region.
To keep the totals practical, the model is cross-checked with selective bottom-up approximations, such as sampling major supplier shipments, validating channel movements for electrical steel and powder cores, and sanity checking implied volumes against trade and production signals. Inputs that tend to matter most include transformer and motor production trends, vehicle electrification penetration, renewable grid connection additions, efficiency regulation tightening for motors and transformers, and the observed shift toward higher-frequency designs that favor certain core materials.
For forecasting, scenario analysis is used around a core case, since policy timing and industrial cycle swings can move volumes meaningfully. Where direct volume disclosure is missing, gaps are handled by using regional proxies and application-level shares confirmed in interviews, and then reconciled so material totals remain consistent with known upstream supply constraints.
Data Validation & Update Cycle
Outputs are checked against independent signals such as steel and alloy production trends, trade movements, and expected consumption per end-use device, followed by a second pass that hunts for outliers at region and application level. When a variance is too large to explain with mix or technology shifts, we re-check assumptions and, if needed, re-contact sources to confirm what changed.
Before sign-off, the full model goes through multiple analyst reviews so definitions, units, and conversions are consistent across years. The report is refreshed annually, and interim updates are triggered when there are material events such as major capacity announcements, regulatory changes, or demand shocks. Right before delivery, a final review is done to ensure clients receive the latest updated view.
Mordor Intelligence's Soft Magnetic Material Market Sizing Compared With Other Published Estimates
Published market sizes for soft magnetic materials often differ because the units, pricing logic, and even the timing of currency conversion are not aligned. Some sources report value in USD, while others publish volume in tons, and the conversion between the two can create large gaps if grade mix and end-use pricing are not handled carefully.
A refresh-led gap shows up when price assumptions are carried forward without rechecking alloy surcharges, electrical steel spreads, and the mix shift toward premium materials, which can move the USD number even if tonnage stays similar. Using January 2026 as the latest framework update point, Mordor Intelligence keeps the core volume model tied to end-use demand signals and then stress-tests implied pricing with recent trade and producer commentary, which limits drift from outdated ASP curves.
Benchmark comparison
| Source | Market Size | Gaps in Research Methodology |
|---|---|---|
| Mordor Intelligence | USD 11.43 M (2026) | |
| Global Consultancy A | USD 23.00 B (2025) | Reports revenue in USD and may bundle a broader set of soft magnetic products and services, so the figure can include value layers beyond raw material consumption. The estimate is also sensitive to assumed ASP by material grade, which can inflate totals when premium mixes are applied uniformly. |
| Industry Publisher B | USD 19.02 B (2024) | Uses a value-based view with a different base year and a longer horizon, which can embed older currency timing and price-cycle assumptions. If regional mix and alloy surcharge pass-through are not refreshed frequently, the USD market size can move away from observed shipment and capacity signals. |
Looking across the figures, the spread is mostly explained by unit choice and conversion choices rather than a disagreement on demand direction. A volume-led model stays traceable to devices and infrastructure build, while value-led estimates can swing more on price and mix assumptions, which is why it is important to align scope, timing, and the exact measurement unit before comparing numbers.


Key Questions Answered in the Report
What is the current global demand for soft magnetic materials and their expected growth by 2031?
Worldwide consumption is 11.43 million tons in 2026 and is projected to reach 15.97 million tons by 2031, reflecting a 6.92% CAGR.
How are electric vehicles changing the consumption of soft magnetic materials?
Each battery-electric vehicle uses magnetic cores, and rising EV output is adding incremental demand between 2026 and 2031.
Which material segment is expanding fastest within soft magnetic materials?
Soft magnetic composites and advanced ferrites are growing at a 7.34% CAGR through 2031, outpacing traditional electric steel.
Why is Asia-Pacific the dominant production hub for soft magnetic materials?
China’s integrated steel mills, India’s transformer build-out, and ASEAN’s cost-competitive plants give the region nearly half of global volume.
How do raw material price swings affect suppliers of soft magnetic materials?
Volatility in nickel and cobalt prices has impacted permalloy margins, prompting some producers to either idle their capacity or reformulate their alloys.
Page last updated on:


 Your data is secure and never sold or shared.


