
Sodium Lauryl Sulfate Market Size and Share
Market Overview
| Study Period | 2020 - 2031 |
|---|---|
| Market Size (2026) | USD 0.8 Billion |
| Market Size (2031) | USD 1.08 Billion |
| Growth Rate (2026 - 2031) | 6.18 % |
| Fastest Growing Market | Asia Pacific |
| Largest Market | Asia Pacific |
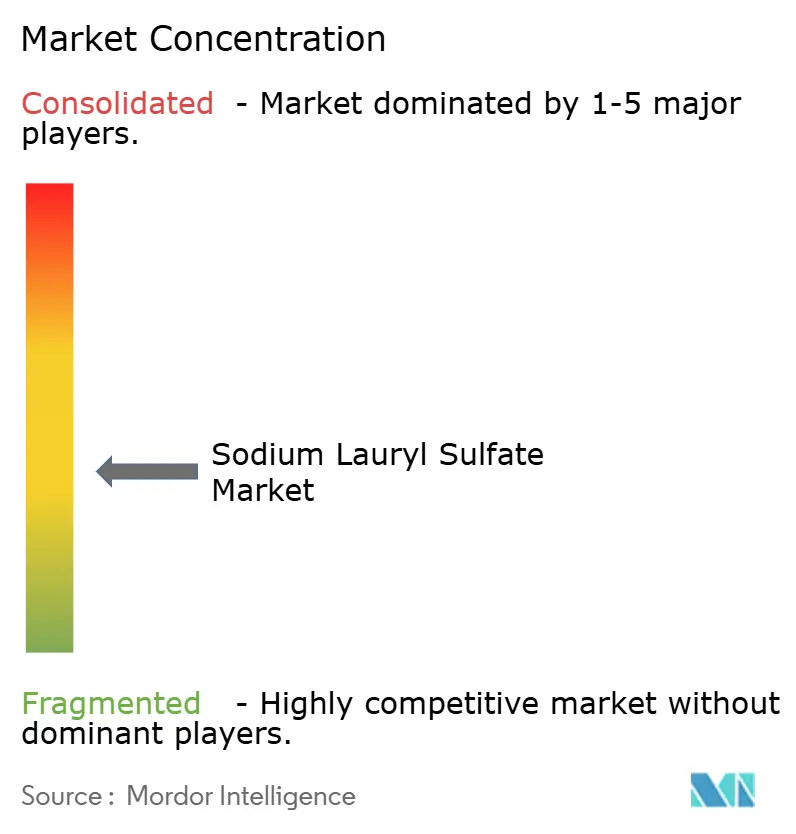
| Market Concentration | Medium |
Major Players *Disclaimer: Major Players sorted in no particular order Image © Mordor Intelligence. Reuse requires attribution under CC BY 4.0. | |
Sodium Lauryl Sulfate Market Analysis by Mordor Intelligence
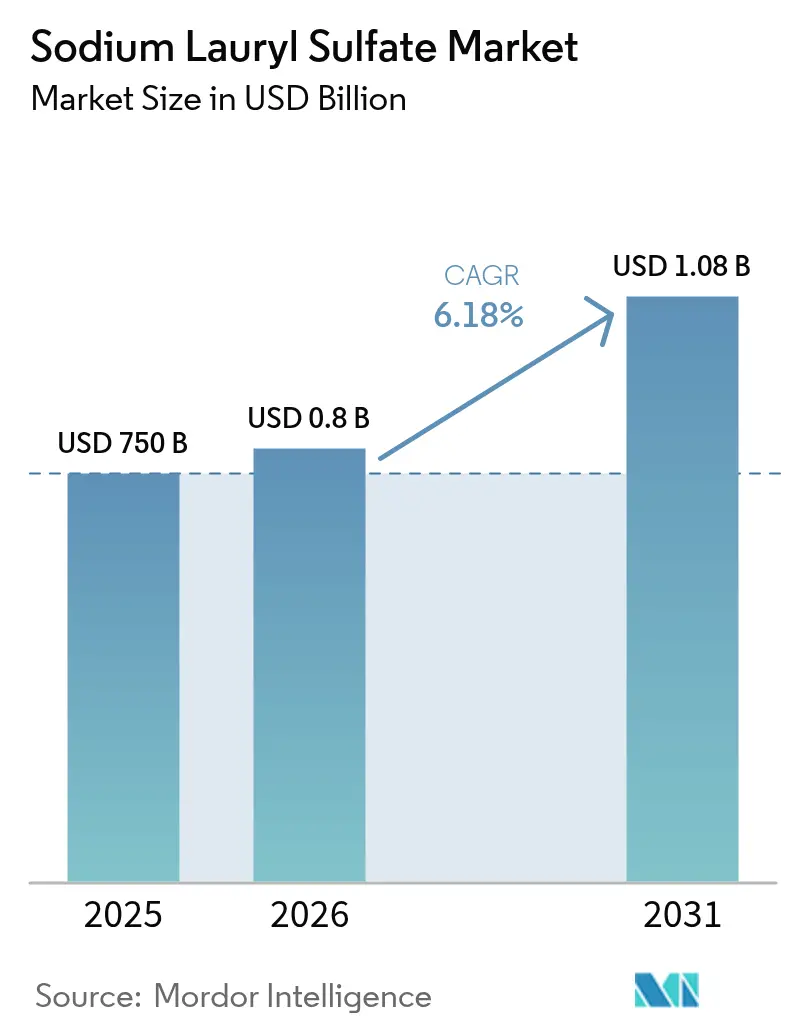
The Sodium Lauryl Sulfate market size is expected to grow from USD 750 million in 2025 to USD 800 million in 2026 and is forecast to reach USD 1.08 billion by 2031 at 6.18% CAGR over 2026-2031. This momentum stems from the compound’s entrenched role in detergents, personal-care products, oilfield chemicals, and crop-protection adjuvants, even as “sulfate-free” labeling pushes formulators toward milder alternatives. Feedstock volatility, especially in palm-derived fatty alcohols, is compressing producer margins and simultaneously highlighting cost advantages over fully bio-based surfactants. Capacity expansions in China, Malaysia, and Indonesia keep Asia-Pacific in a structural cost-lead position, while aggressive decarbonization programs by multinational majors safeguard the compound’s regulatory acceptance in North America and Europe.
Key Report Takeaways
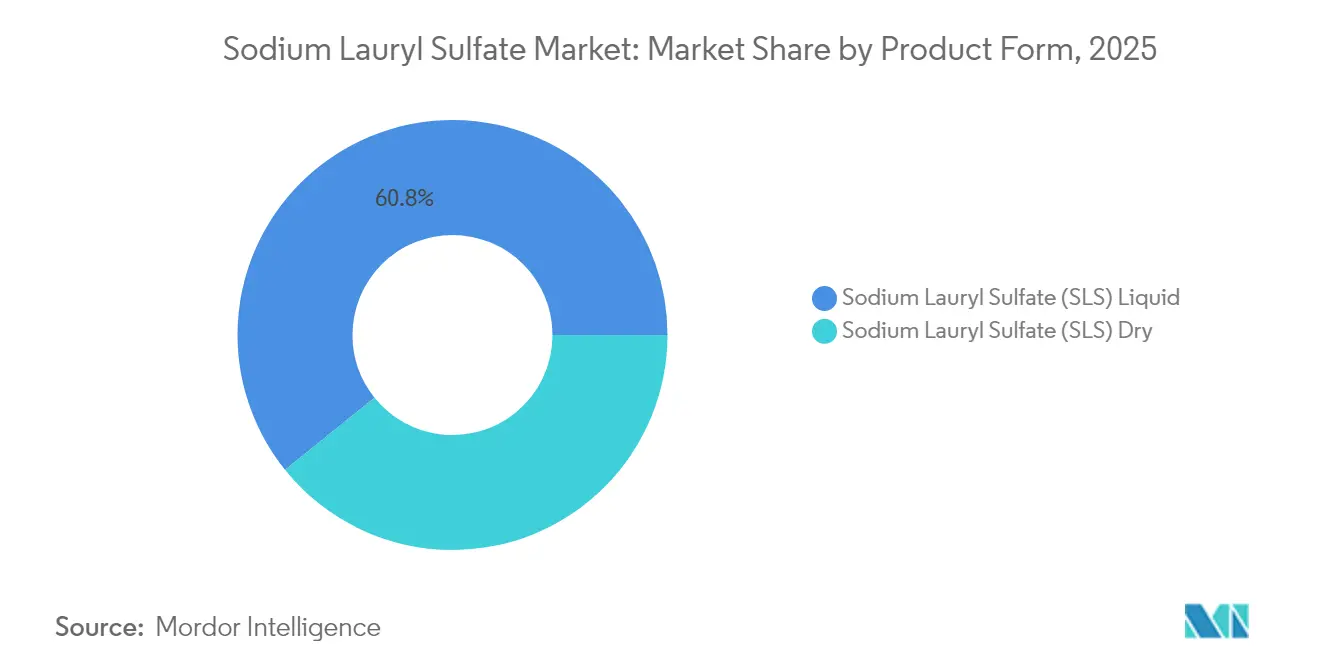
- By product form, SLS Liquid held 60.78% of the sodium lauryl sulfate market share in 2025, and this sub-segment is advancing at a 6.75% CAGR through 2031.
- By grade, Industrial Grade accounted for 43.21% revenue in 2025, while Pharmaceutical Grade led growth at 7.75% CAGR to 2031.
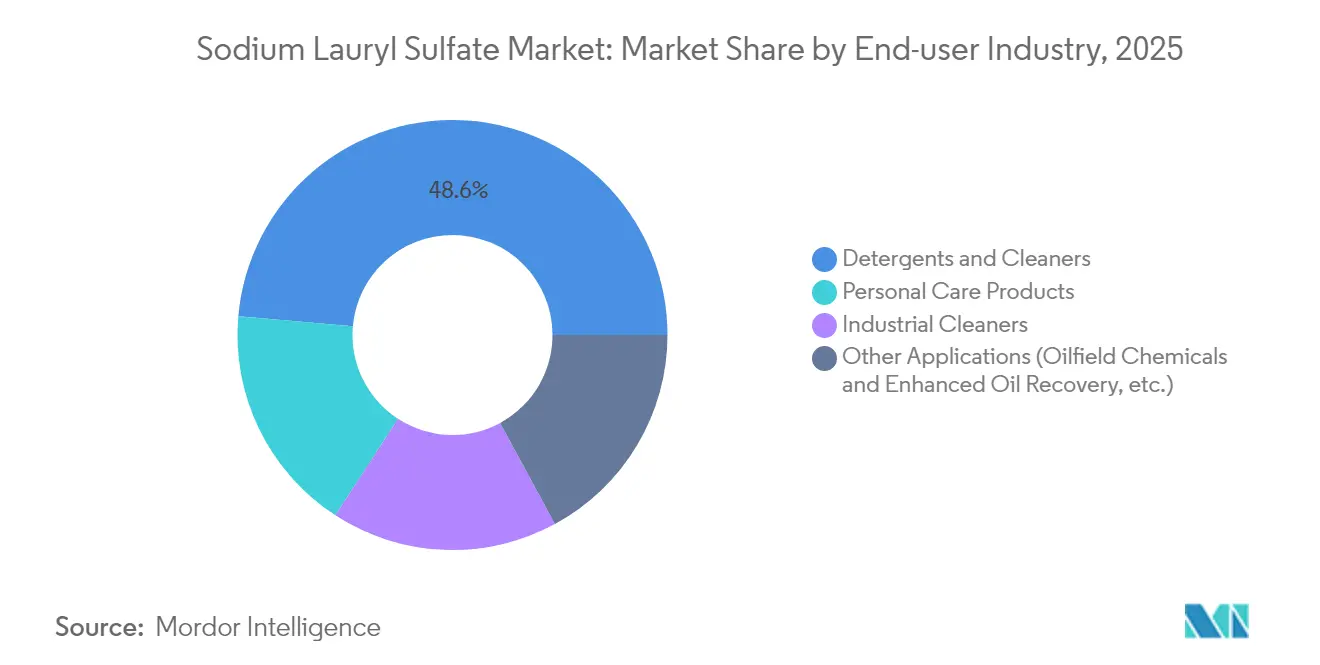
- By end-user industry, detergent and household products commanded 48.61% of the sodium lauryl sulfate market size in 2025; oilfield and chemicals are forecast to expand at an 8.29% CAGR to 2031.
- By geography, Asia-Pacific led with 44.72% revenue share in 2025 and is projected to record the fastest 7.91% CAGR over the forecast period.
Note: Market size and forecast figures in this report are generated using Mordor Intelligence’s proprietary estimation framework, updated with the latest available data and insights as of 2026.
Market Trends and Insights
Drivers Impact Analysis of Sodium Lauryl Sulfate Market*
| Drivers | (~) % Impact on CAGR Forecast | Geographic Relevance | Impact Timeline |
|---|---|---|---|
| Household detergents and cleaners demand surge | +1.8% | APAC, North America | Medium term (2-4 years) |
| Expansion of personal-care manufacturing | +1.2% | APAC core, MEA spill-over | Long term (≥4 years) |
| Post-COVID hygiene focus | +0.9% | APAC, Latin America, MEA | Short term (≤2 years) |
| Cost advantage versus bio-based surfactants | +0.7% | Global | Medium term (2-4 years) |
| Adoption of herbicide adjuvants | +0.4% | North America, Europe | Long term (≥4 years) |
| Source: Mordor Intelligence | |||
Demand Surge from Household Detergents and Cleaners
Surging appliance ownership and rising laundry frequency underpin the most resilient outlet for the sodium lauryl sulfate market demand. Formulators value the anionic surfactant’s stability under hard-water conditions, enabling lower builder loading while preserving wash performance. Its foaming profile also allows concentrated liquids to deliver the sensory cues consumers expect, a critical success factor in emerging economies where visual foam is equated with efficacy. Reformulated high-efficiency laundry liquids rely on sodium lauryl sulfate’s compatibility with protease, lipase, and cellulase enzymes, facilitating lower-temperature washes that trim energy bills. EPA Safer Choice recertification in 2024 further elevates the compound’s status as a mainstream, regulatory-endorsed ingredient for mass-market cleaners[1]Environmental Protection Agency, “Safer Choice Standard Revision August 2024,” epa.gov.
Expansion of Personal-Care Manufacturing Bases in APAC
Massive capital projects, most notably BASF’s USD 10 billion Zhanjiang Verbund complex, illustrate how brand owners are localizing ingredient supply to match explosive demand for hair-care and bath-care products in China, India, and Southeast Asia. Access to competitively priced palm lipid feedstocks and renewable electricity keeps unit costs low while trimming embedded carbon. The clustering effect attracts contract manufacturers and packaging suppliers, shortening lead times for global FMCG leaders. These dynamics strengthen the sodium lauryl sulfate market’s resilience in APAC even as premium sulfate-free lines proliferate.
Heightened Post-COVID Hygiene Focus in Emerging Economies
Pandemic-era public-health campaigns permanently raised the baseline for household and institutional cleaning frequency. Governments in India, Brazil, and Indonesia now subsidize school and clinic sanitation programs that specify moderate-foaming, broad-spectrum cleaners, segments where sodium lauryl sulfate still dominates ingredient decks for cost and availability reasons. The resulting boost to per-capita cleaner consumption supports steady, volume-driven growth across lower-income rural districts.
Cost-Competitiveness Versus Bio-Based Surfactants
At 20-30% lower conversion cost than glutamate or sarcosinate surfactants, sodium lauryl sulfate enables aggressive retail price points in mass-market detergents and economy shampoos. Mature global supply chains, high asset utilization rates, and decades of process optimization underpin this advantage. Hybrid formulations that pair sodium lauryl sulfate with APG or betaine co-surfactants help marketers claim milder profiles without losing cost control, reinforcing the market’s near-term stickiness in high-volume applications[2]American Chemical Society, “Cost Benchmarking of Bio-Based Surfactants,” pubs.acs.org .
Restraints Impact Analysis of Sodium Lauryl Sulfate Market*
| Restraints | (~) % Impact on CAGR Forecast | Geographic Relevance | Impact Timeline |
|---|---|---|---|
| Human and aquatic-toxicity concerns driving "sulfate-free" labeling | -1.4% | Global, with concentration in North America and Europe | Medium term (2-4 years) |
| Rapid commercialization of bio-based and mild surfactant substitutes | -0.8% | Europe, North America, premium segments in APAC | Long term (≥ 4 years) |
| Palm-kernel oil price volatility inflating feedstock costs | -0.6% | Global, with highest impact in APAC production hubs | Short term (≤ 2 years) |
| Source: Mordor Intelligence | |||
Human and Aquatic-Toxicity Concerns Driving “Sulfate-Free” Labeling
Although wash-off toxicology reviews from the FDA and the Cosmetic Ingredient Review reaffirm safety, social-media discussions amplify anecdotal scalp-irritation claims, pushing mid- to high-end hair-care brands toward sulfate-free positioning. These products achieve price premiums of 20-30% in North America. Retail shelf resets allocate dedicated “clean beauty” space, visibly fragmenting the sodium lauryl sulfate market in prestige segments. European eco-label schemes tighten discharge-toxicity thresholds, nudging institutional buyers of dish-wash liquids to pilot milder blends.
Rapid Commercialization of Bio-Based and Mild Surfactant Substitutes
APGs now approach mainstream cost thresholds, eroding sodium lauryl sulfate share among baby shampoos and ultra-mild facial cleansers. Fermentation-derived glycolipids attract venture funding on sustainability narratives, and fast-fashion cruelty-free cosmetics houses act as anchor customers. Yet global capacity additions remain slower than demand, preserving a sizeable value-tier space for cost-efficient anionic surfactants through 2030.
*Our forecasts treat driver/restraint impacts as directional, not additive. The impact forecasts reflect baseline growth, mix effects, and variable interactions.
Sodium Lauryl Sulfate Market Segment Analysis
By Product Form:
Liquid Dominance Underpins Automation EfficiencySLS Liquid captured 60.78% of 2025 revenue and is forecast to outpace the overall sodium lauryl sulfate market at a 6.75% CAGR. Inline dosing, fully automated batching, and instant solubility make liquids the default choice for megatonne detergent plants in China and the United States. Liquid format also minimizes dust exposure, a growing occupational-safety compliance priority. Dry SLS retains a foothold in export-driven textile auxiliaries and SDS-PAGE reagents, where lower freight mass drives logistics savings, but clocks sub-5% growth.
Formulators targeting concentrated pods or bar detergents add powder SLS for viscosity control and reduced water carry. Process improvements in spray-drying cut energy use by 15%, modestly improving powder economics. Even so, liquid capacity expansions announced for 2026 in Malaysia and Texas point to a continued tilt toward flowable formats in the sodium lauryl sulfate market.



By Grade:
Pharmaceutical Purity Gains MomentumIndustrial Grade remained the volume workhorse at 43.21% of 2025 output. High-throughput sulfonation lines balance conversion cost and quality for homecare and textile customers. Conversely, Pharmaceutical Grade will post the quickest 7.75% CAGR as biopharma manufacturing clusters in India and Singapore scale up GMP-compliant SDS requirements for protein electrophoresis and viral-vector purification.
Cosmetic and Personal-Care Grade stays resilient in mass-segment shampoos, especially where consumer acceptance of foam volume trumps sulfate-free narratives. Food Grade demand is stable, limited to emulsifier duties in whipped toppings and gelatin capsules, a niche unlikely to materially alter the sodium lauryl sulfate market size trajectory.
By End-User Industry:
Oilfield Upswing Offers DiversificationDetergent and household cleaners delivered 48.61% of 2025 turnover. Market penetration in automatic-dish and multiformat laundry categories protects baseline volumes. Oilfield and chemicals, however, are poised for an 8.29% CAGR, leveraging SLS’s ability to slash interfacial tension below 10⁻³ mN/m in surfactant–polymer floods. Pilot trials in Middle-East offshore carbonate reservoirs exceeded 99% incremental recovery in core studies, galvanizing demand for specialty-grade SLS packages.
Personal-care consumption stabilizes as value chains introduce premium sulfate-free SKUs while maintaining SLS in economy tiers. Institutional and industrial cleaning adopt low-foaming, quick-rinse variants to cut water use, sustaining incremental revenues inside the sodium lauryl sulfate market.
Geography Analysis
APAC Sodium Lauryl Sulfate Market
Asia-Pacific anchors 44.72% of global sales and will accelerate at 7.91% CAGR to 2031. Low-cost feedstock, robust consumer-goods output, and new oleochemical complexes in Malaysia, Thailand, and coastal China preserve the region’s structural advantage. Zhanjiang Verbund alone supplies enough anionic surfactant base to serve one-third of the incremental APAC demand through 2030.
North America Sodium Lauryl Sulfate Market
North America holds a mature yet steady position, bolstered by long-lived laundry-detergent brands and a vibrant oilfield-chemicals sector. Stepan’s PerformanX acquisition expands value-added agriculture surfactant capacity, mitigating import reliance.
Europe Sodium Lauryl Sulfate Market
Europe grapples with stiffer regulatory overhead, but sodium lauryl sulfate remains entrenched in industrial dish-washers and fabric-care tablets, where biodegradability hurdles for newcomers are equally onerous. Digital labeling pilots under the revised Detergent Regulation funnel granular ingredient data to smartphones, nudging formulators toward traceable, certified-sustainable palm derivatives. Mid-tier manufacturers counter margin erosion by adopting biomass-balance models similar to BASF’s EcoBalanced grades.
Value Chain Analysis
Sodium lauryl sulfate (SLS) production is anchored in upstream fatty alcohol availability, most commonly lauryl alcohol sourced from palm kernel or coconut oil value chains (with some petrochemical routes), followed by sulfation using sulfur trioxide, oleum, or chlorosulfonic acid, and then neutralization with sodium hydroxide or sodium carbonate to reach the target active level. Producers then tailor product form (liquid vs dry) through dilution and blending, and for powders, spray drying and particle engineering. The market continues to shift toward liquid formats because large detergent plants favor inline dosing and reduced dust exposure.
Downstream, SLS typically moves through bulk distribution into detergents and institutional cleaners, and through more controlled channels into cosmetic and personal care, pharmaceutical, and specialty applications, including oilfield and crop-protection adjuvants. Documentation, lot traceability, and tighter impurity control can differentiate suppliers in these segments. Key bottlenecks and cost swing factors remain concentrated in palm-derived feedstock volatility and energy and logistics intensity around sulfonation and drying. This keeps Asia-Pacific production hubs (Malaysia, Thailand, coastal China) structurally advantaged, while global brand owners and formulators increasingly dual-source and qualify alternate origins to stabilize landed costs.
Competitive Landscape
The sodium lauryl sulfate market represents moderate fragmentation. Strategic imperatives center on feedstock security, circular-economy credentials, and application-specific grades. Leaders invest in green-electricity PPAs and on-site waste-acid neutralization to pre-empt carbon-border adjustments. Second-tier firms differentiate via kosher- or halal-certified lines, niche particle-size distributions, and rapid-response customer service.
Sodium Lauryl Sulfate Industry Leaders
BASF
Galaxy
KLK OLEO
Solvay
Stepan Company
- *Disclaimer: Major Players sorted in no particular order
Sodium Lauryl Sulfate Market Companies Covered in this Report
- Aarti Surfactants
- Alpha Chemicals Pvt Ltd
- BASF
- Croda International Plc
- Dongming Jujin Chemical Co., Ltd
- Dow
- Galaxy
- Indorama Ventures Public Company Limited.
- Kao Chemicals Europe, S.L.U.
- KLK OLEO
- Sasol Limited
- Solvay
- Spectrum Chemical
- Stepan Company
- Taiwan NJC Corporation

Market Opportunities and Future Outlook
White space is most visible in higher-purity and application-specific SLS, where substitution pressure from mild and bio-based surfactants is less direct and where customers value consistency, documentation, and performance. The strongest grade signal in the current cycle is pharmaceutical-grade supply. Galaxy Surfactants commissioned an expanded pharmaceutical-grade SLS line at its Tarapur complex in Maharashtra in November 2025, adding about 18,000 metric tons per year, which points to investment flow toward GMP-aligned, high-spec material rather than commodity-only output.
Regional capacity additions and localization projects also create room for new supplier relationships with detergent and personal-care manufacturers that want shorter lead times and more resilient sourcing. In China, Licheng Industry reported trial production in February 2025 for a 0.01 million metric ton per year SLS (K12) facility at its Shanghai Aowei daily chemical base, reinforcing continued buildout close to end-use manufacturing. On the compliance side, SLS remains permitted under EU frameworks (not listed in Annex II or Annex III of the EU Cosmetics Regulation) and continues to be handled under REACH. That regulatory footing supports ongoing reformulation focused on irritation mitigation, traceable palm-derived inputs, and hybrid blends that preserve SLS cost-performance in value-tier products while meeting tighter customer documentation requirements.
Recent Industry Developments in Sodium Lauryl Sulfate Market
- June 2026: Stepan Company implemented a price increase for lauryl alcohol sulfates and dry sulfates effective June 1, 2026. The change reflected ongoing feedstock and operating-cost pressure across lauryl-based surfactants and tighter contract discussions for detergent, I&I cleaning, and industrial customers.
- March 2026: BASF inaugurated a new non-ionic surfactant production site in Seosan, Korea, via its joint venture BASF Hannong Chemicals Solutions Ltd. The added regional capacity strengthens Asia-Pacific supply proximity for home and personal care formulators. It also supports broader surfactant portfolio availability alongside anionic systems such as SLS. This expansion complements BASF Hannong's existing APAC portfolio and improves access to non-ionic formulations for regional customers.
- July 2024: KLK OLEO expanded oleochemical capacity at its China site, increasing regional availability of fatty-alcohol feedstocks used to manufacture SLS. The expansion helped shorten supply lines into Asia-Pacific surfactant production and reduced reliance on longer-haul imports for key upstream inputs.


Sodium Lauryl Sulfate Market Report Scope and Research Methodology
Market Definition and Coverage
This market tracks the value of sodium lauryl sulfate (SLS) sold as a surfactant ingredient, across the main grades and physical forms, for use in consumer and industrial formulations. We count demand from detergents and cleaners, personal care, and other standard downstream uses where SLS is a labeled input.
Scope exclusions: We exclude finished consumer products and count only the SLS ingredient value, not the full retail value of soaps, shampoos, or detergents.
Segments Covered in This Report
- By Product Form
- Sodium Lauryl Sulfate (SLS) Liquid
- Sodium Lauryl Sulfate (SLS) Dry
- By Grade
- Industrial Grade (Greater than or equal to 93% active)
- Cosmetic and Personal Care Grade
- Pharmaceutical Grade
- Food Grade
- By End-User Industry
- Detergents and Cleaners
- Personal Care Products
- Industrial Cleaners
- Other Applications (Oilfield Chemicals and Enhanced Oil Recovery, etc.)
- By Geography
- Asia-Pacific
- China
- India
- Japan
- South Korea
- Australia and New Zealand
- Rest of Asia-Pacific
- North America
- United States
- Canada
- Mexico
- Europe
- Germany
- United Kingdom
- France
- Italy
- Rest of Europe
- South America
- Brazil
- Argentina
- Rest of South America
- Middle-East and Africa
- Saudi Arabia
- South Africa
- Rest of Middle-East and Africa
- Asia-Pacific
Data Sources, Market Sizing, and Validation
Desk Research
To build the base dataset, we first relied on public and official information that can be checked and repeated, including U.S. International Trade Commission trade statistics, UN Comtrade import and export series, World Bank macro indicators, and U.S. FDA ingredient and cosmetics-related references. We also used regulatory and safety documentation from sources such as the European Chemicals Agency, since acceptance rules and concentration limits can affect where SLS demand stays resilient.
After that, we expanded inputs using company annual reports, investor presentations, technical product literature, association websites, and reputed press coverage for capacity additions and downstream formulation trends. In a few places, paid subscriptions were used for company financials and intelligence, patent lookups, and shipment-level trade checks to reduce gaps in supply mapping. The sources listed here are illustrative, and we also consulted many other public references for data collection, validation, and clarification.
Primary Interviews and Surveys
Primary conversations were run with manufacturers, distributors, and large end users in home care, personal care, and industrial cleaning, so that price bands and demand splits could be confirmed beyond what is visible in public documents. We also checked feedback across APAC, EMEA, and the Americas, since local formulation preferences, regulatory coverage, and feedstock movements can change the year-level market value.
Distribution of primary research fieldwork respondents
| Company type | Respondent position | Region |
|---|---|---|
| Top tier: 31% | CXOs: 13% | APAC: 37% |
| Mid tier: 55% | Functional/Unit leaders: 28% | EMEA: 37% |
| Smaller Players: 14% | Managers: 59% | Americas: 26% |
Market-Sizing & Forecasting
Sizing starts with a top-down reconstruction where production and trade flows of lauryl alcohol and related sulfation inputs are used to frame the feasible SLS supply pool, which is then converted into demand by applying application-level consumption shares. We then sanity-check totals using selective bottom-up approximations, such as sampling supplier price points, mapping channel mix for liquid versus dry form, and using observed grade splits to adjust the final value.
The model uses a short list of practical inputs that can be refreshed each year, including liquid versus dry mix, average selling price movement tied to feedstock cost changes, detergent and personal care output trends, import dependency by region, and regulatory acceptance for rinse-off applications. Forecasts are built using scenario analysis, where volume growth and ASP progression are stress-tested under different feedstock and downstream demand cases, then aligned to what experts consider realistic for capacity and substitution trends. Where bottom-up signals are missing for smaller consuming countries, we fill gaps using regional analogs and per-capita detergent and personal care indicators, and then re-balance totals.
Data Validation & Update Cycle
Outputs are cross-checked against independent signals, including trade series direction, capacity announcements, and downstream production indicators, before the final numbers are signed off. If a region shows unusual jumps, assumptions are reopened, and we may re-contact respondents to confirm whether it is a pricing move, a volume change, or a scope mismatch.
A second analyst review is applied to formulas, units, and currency handling, so that year-to-year comparisons stay consistent. The report is refreshed annually, and interim updates are triggered when material events occur, such as large capacity starts, major feedstock shocks, or regulatory changes that affect common use cases. Before delivery, a fresh review pass is completed so clients receive the latest updated view.
Mordor Intelligence's Sodium Lauryl Sulfate Market Size Compared Against Other Published Estimates
Published SLS market values often do not match perfectly because teams draw the boundary in different places and they also do not always use the same pricing and timing assumptions. In our checks, the main drivers behind gaps were the treatment of finished product value versus ingredient value, the year used for currency conversion, and whether the estimate is anchored on supply constraints or on downstream demand signals.
Trade statistics direction, regional capacity additions, and the observed liquid versus dry mix are the checks that keep Mordor Intelligence's estimate tied to the SLS ingredient demand pool, rather than drifting into broader surfactant or finished formulation value. Differences also show up when a publisher starts from a conservative scenario for personal care usage or uses a single global ASP without adjusting for grade and region, which can move the total even if volumes are similar.
Benchmark comparison
| Source | Market Size | Gaps in Research Methodology |
|---|---|---|
| Mordor Intelligence | USD 0.75 B (2025) | |
| Global Research Publisher A | USD 0.80 B (2024) | Uses a different base year and appears to apply a broader end-use grouping with less clarity on whether the value is strictly the SLS ingredient or partially blended with formulated product demand, which can inflate the starting point. |
| Market Advisory B | USD 0.66 B (2023) | Anchors the estimate on an earlier base year and a shorter forecast window, and it likely applies narrower application coverage with limited adjustment for regional ASP differences across grades and forms. |
The spread across publishers is mainly explained by boundary choices and year assumptions, not by a single data point. When scope stays limited to the SLS ingredient and inputs like form mix, grade pricing, and region-level demand signals are refreshed and rechecked, the resulting market size is easier to trace and repeat year after year.


Key Questions Answered in the Report
What is the current value of the sodium lauryl sulfate market?
The sodium lauryl sulfate market size stands at USD 800 million in 2026 and is projected to reach USD 1.08 billion by 2031.
Which region leads global demand?
Asia-Pacific holds 44.72% of global revenue and is set to grow at a 7.91% CAGR through 2031, supported by large-scale capacity additions and robust downstream demand.
Why do formulators still use sodium lauryl sulfate amid sulfate-free trends?
It remains 20-30% cheaper than most bio-based surfactants, performs reliably in hard-water conditions, and enjoys broad regulatory acceptance for wash-off applications.
Which segment shows the fastest growth?
Oilfield and chemicals end-uses are forecast to expand at an 8.29% CAGR, driven by enhanced-oil-recovery applications that need ultralow interfacial tension.
How are producers addressing sustainability pressure?
Leading suppliers are integrating renewable electricity, biomass-balance feedstock accounting and wastewater recycling to shrink carbon footprints while maintaining cost leadership.
Page last updated on:





