Smart Well Market Size and Share
Market Overview
| Study Period | 2020 - 2030 |
|---|---|
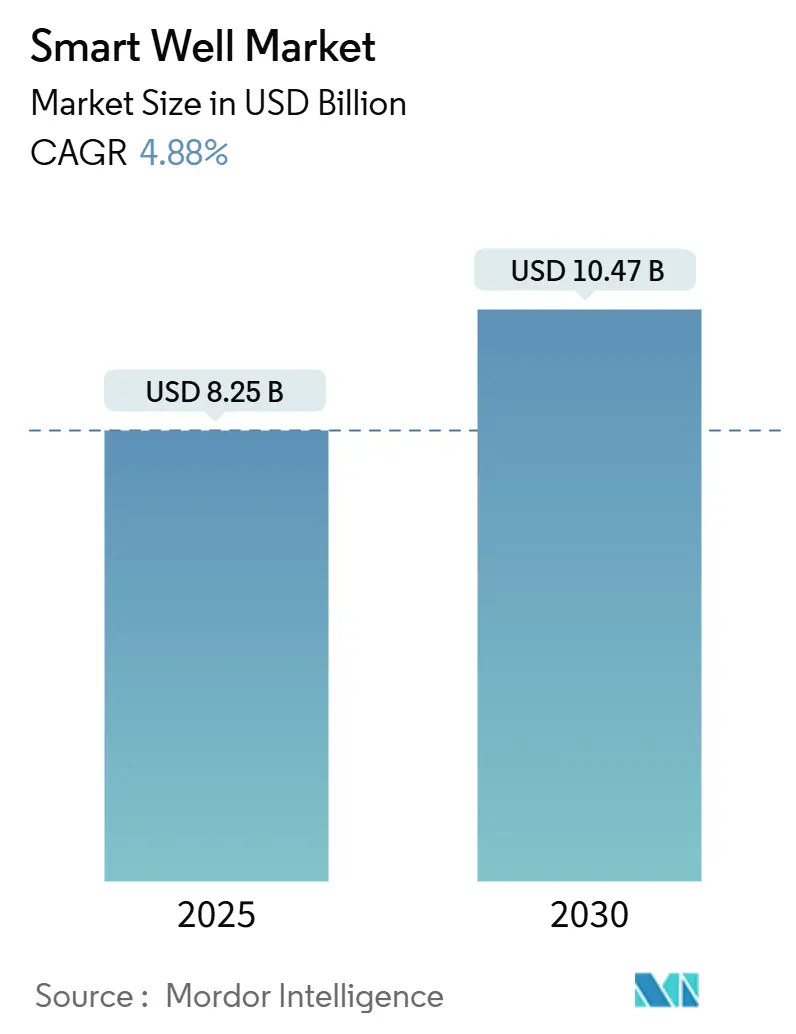
| Market Size (2025) | USD 8.25 Billion |
| Market Size (2030) | USD 10.47 Billion |
| Growth Rate (2025 - 2030) | 4.88% CAGR |
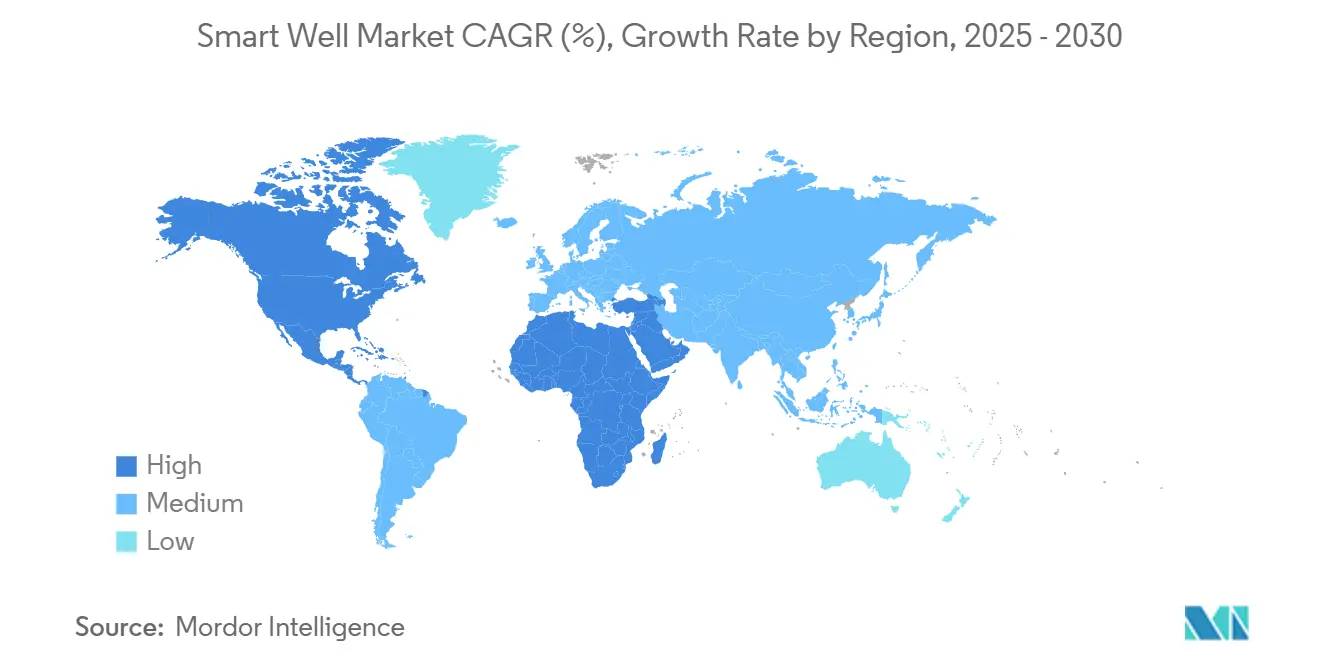
| Fastest Growing Market | Middle East and Africa |
| Largest Market | North America |
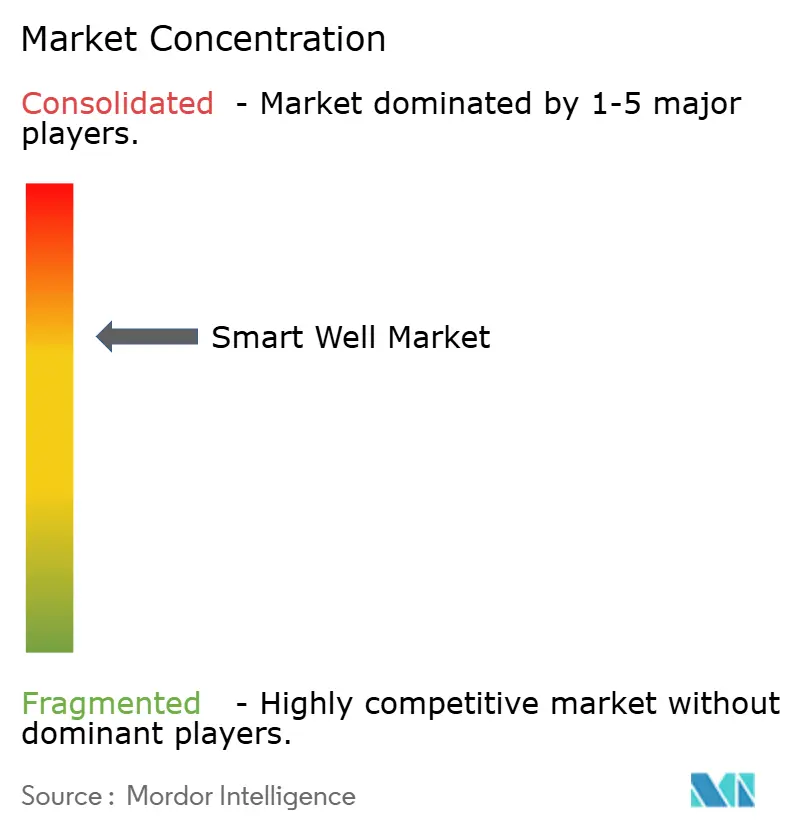
| Market Concentration | Medium |
Major Players *Disclaimer: Major Players sorted in no particular order Image © Mordor Intelligence. Reuse requires attribution under CC BY 4.0. | |
Smart Well Market Analysis by Mordor Intelligence
The Smart Well Market size is estimated at USD 8.25 billion in 2025, and is expected to reach USD 10.47 billion by 2030, at a CAGR of 4.88% during the forecast period (2025-2030).
The measured trajectory mirrors disciplined capital allocation, heavy brownfield activity, and a steady move toward digitally enabled completions that raise recovery factors while cutting intervention spending.(1)Source: SLB, “SLB Electrifies Well Control with Latest Tech,” slb.com Aging reservoirs, deep-water megaprojects in Brazil and Guyana, and real-time optimization that trims 15-25% of operating costs collectively underpin demand. At the same time, capital-spending caution and cybersecurity risk temper the pace of adoption, channeling investments toward high-value, quick-payback wells.(2)Source: Oil & Gas Journal, “US E&P Companies’ Capital Spending to Decrease in 2024,” ogj.com A moderately consolidated supplier base—led by SLB, Halliburton, and Baker Hughes—continues to differentiate through electric completions, fiber-optic sensing, and AI-driven analytics, while niche innovators target autonomous down-hole systems.
Key Report Takeaways
- By technology, single-zone systems held 55.9% of the smart well market share in 2024, whereas multi-zone systems are projected to expand at a 6.4% CAGR to 2030.
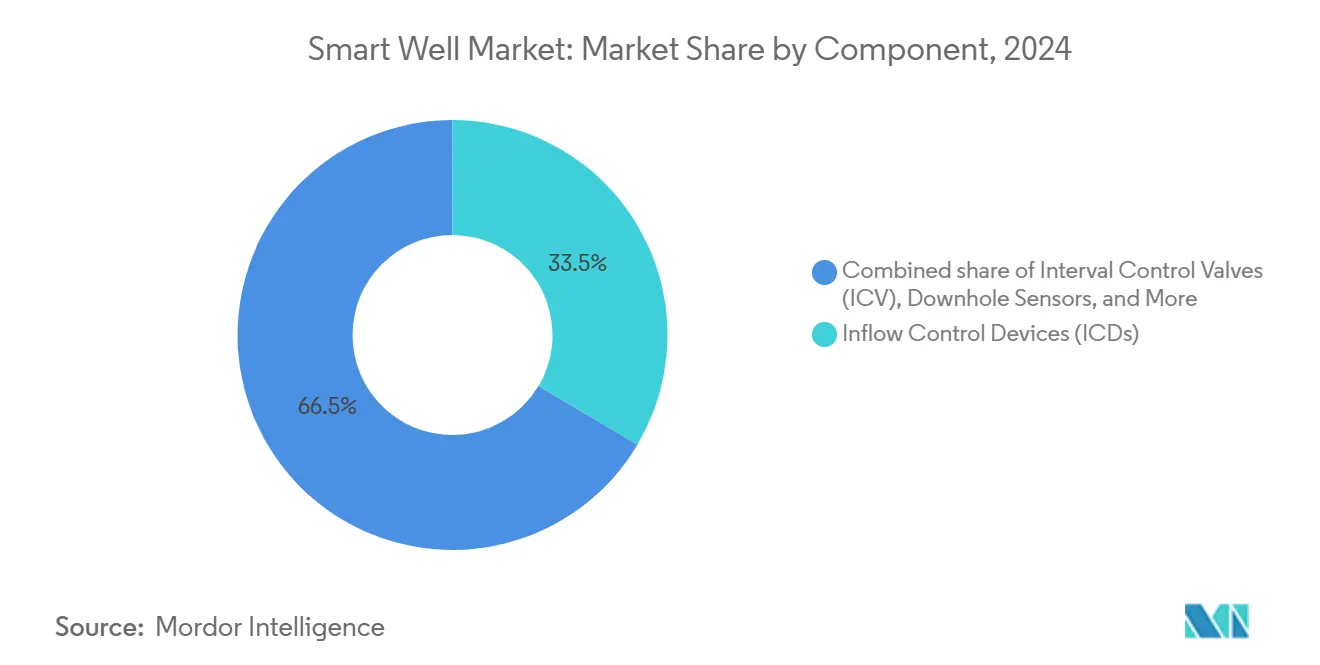
- By component, interval control valves accounted for a 33.5% share of the smart well market size in 2024; down-hole sensors are set to grow at a 7.5% CAGR through 2030.
- By well type, horizontal wells led with 48.0% share of the smart well market in 2024, while multilateral wells are forecast to post the fastest 7.2% CAGR between 2025-2030.
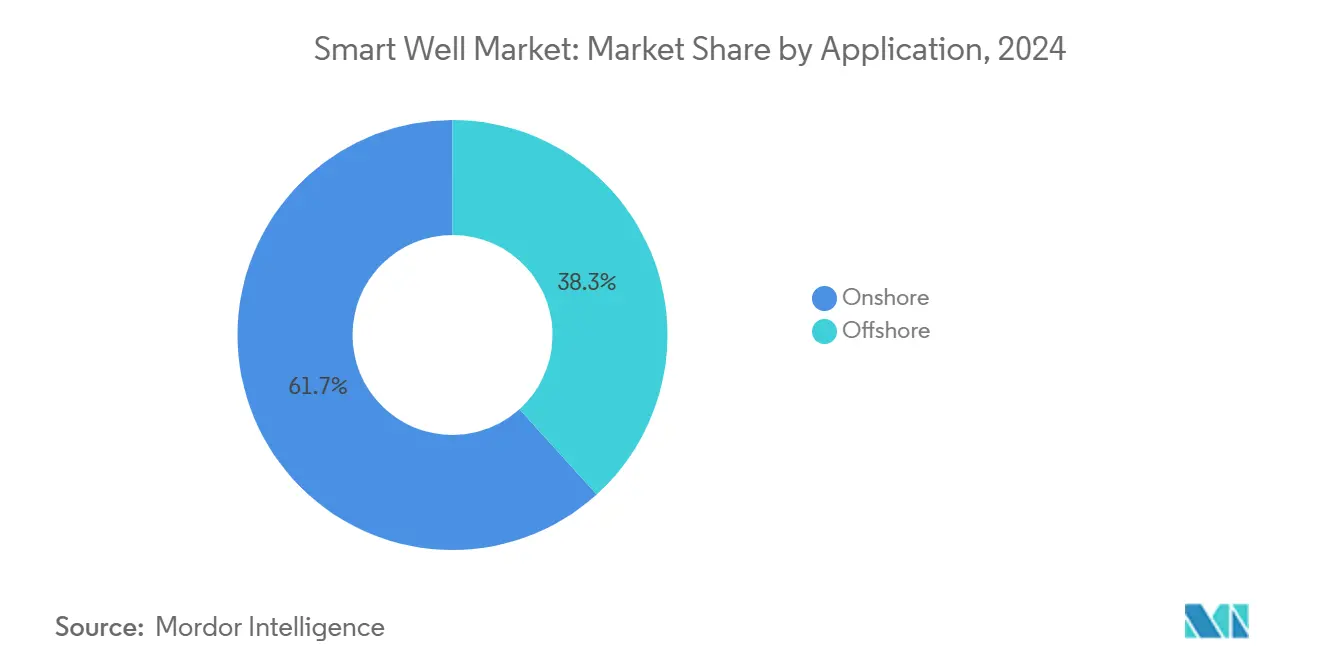
- By application, onshore completions represented 61.7% of 2024 revenue; the offshore segment is advancing at a 7.9% CAGR to 2030 as ultra-deepwater fields adopt high-value intelligent systems.
- By geography, North America commanded 36.6% of 2024 revenue; the Middle East & Africa region is projected to grow at a 7.3% CAGR through 2030 on the back of the national oil company digitalization programs.
Global Smart Well Market Trends and Insights
Drivers Impact Analysis*
| Driver | (~) % Impact on CAGR Forecast | Geographic Relevance | Impact Timeline |
|---|---|---|---|
| Aging brownfields demand zonal control | +1.2% | North America, North Sea | Medium term (2-4 years) |
| Offshore deep-water surge in Brazil & Guyana | +0.9% | South America, spill-over to West Africa | Long term (≥ 4 years) |
| Real-time optimization cuts OPEX | +1.5% | Global early adopters | Short term (≤ 2 years) |
| All-electric completions unlock HP/HT wells | +0.8% | Deep-water & unconventional plays | Long term (≥ 4 years) |
| Fiber-optic DAS for CCUS monitoring | +0.4% | North America, European Union, Asia-Pacific emerging | Medium term (2-4 years) |
| Source: Mordor Intelligence | |||
Aging brownfields demand zonal control
Mature oil and gas fields face declining productivity and rising water cut, prompting operators to retrofit intelligent completions that allow selective, remote flow regulation without costly workovers. Saudi Aramco’s carbonate fields illustrate how inflow control valves reduce water production and lengthen plateau life while avoiding USD 10 million intervention campaigns per well.(3)Source: OnePetro, “Intelligent Completions as a Key Technology in Brazilian Presalt,” onepetro.org Similar deployments in the U.K. North Sea show payback periods inside two years as incremental barrels outweigh upfront hardware cost.(4)Source: OnePetro, “Production Optimization Using 24/7 Distributed Fiber Optic Sensing,” onepetro.org The economic appeal strengthens where rig rates are high, reinforcing a global pull toward smart-well retrofits.
Offshore deep-water surge in Brazil & Guyana
Brazil’s pre-salt basins and Guyana’s Stabroek Block demand intelligent systems that thrive at 2,000 m water depth and 10,000 psi bottom-hole pressure. Petrobras awarded SLB three subsea completion packages for Búzios featuring electric interval control valves and down-hole gauges, cutting projected well count and workover frequency.(5)Source: World Oil, “SLB Secures Three Subsea Completion Contracts…,” worldoil.com Guyana’s fast-track developments mirror this template, with operators favoring multi-zone smart wells that maximize reservoir contact per slot. Spill-over interest is visible in West Africa, where Angolan pre-salt prospects specify all-electric completions in pre-FEED documents.
Real-time optimization cuts OPEX 15-25%
Fiber-optic distributed acoustic and temperature sensing streams 24/7 down-hole data to surface analytics, enabling dynamic choke settings and early-warning diagnostics. BP’s Clair Ridge field used continuous inflow profiling to halve well-startup time and cut logging runs, saving USD 2 million per well. Similar gains in Kuwait’s carbonates show water-shutoff decisions made within hours instead of weeks, translating into 15-25% lower operating costs across the asset life.
All-electric completions unlock HP/HT wells
Replacing hydraulics with fully electric power lines removes fluid-compatibility issues, improves actuation speed, and feeds real-time health checks to topsides control. SLB’s EWC platform has completed 19 HP/HT wells since 2024 with zero unplanned interventions. Baker Hughes’ electric interval control valves rated at 20,000 psi operate in geometrically complex Gulf of Mexico wells, expanding the economic envelope for ultra-high-pressure reservoirs.
Restraints Impact Analysis*
| Restraint | (~) % Impact on CAGR Forecast | Geographic Relevance | Impact Timeline |
|---|---|---|---|
| High upfront CAPEX & complexity | −1.8% | Cost-sensitive onshore markets | Short term (≤ 2 years) |
| Oil-price volatility curbs E&P capex | −1.2% | North American shale plays | Short term (≤ 2 years) |
| Cyber-security risk in open-protocol control | −0.6% | Critical infrastructure regions | Medium term (2-4 years) |
| Alloy supply-chain pinch | −0.4% | Specialized metallurgy components worldwide | Medium term (2-4 years) |
| Source: Mordor Intelligence | |||
High upfront CAPEX & complexity
Intelligent completions cost 2-4 times more than conventional strings, stretching budgets in price-sensitive basins. U.S. independents trimmed 2024 capital spending to USD 61.7-65.4 billion, delaying discretionary optimization projects.(6)Source: Oil & Gas Journal, “US E&P Companies’ Capital Spending…,” ogj.com Vendors counter with modular designs and life-of-well service contracts that shift spend from capex to opex, but adoption still lags in low-margin acreage.
Oil-price volatility curbs E&P capex
WTI swings between USD 65 and USD 95 since 2024 have injected planning uncertainty, prompting operators to favor short-cycle shale wells over multi-year offshore schemes. The resulting deferrals shrink the immediate addressable market for multi-zone smart wells, particularly in the Permian Basin, where producers prioritize cash flow generation.
*Our forecasts treat driver/restraint impacts as directional, not additive. The impact forecasts reflect baseline growth, mix effects, and variable interactions.
Segment Analysis
By Technology: Multi-Zone Systems Drive Innovation Despite Single-Zone Dominance
Single-zone strings retained 55.9% of 2024 revenue because they satisfy cost-focused producers and brownfield re-entries where simple zonal isolation suffices, anchoring the smart well market. Their streamlined design reduces installation time and packer count, making them the default in mature North Sea water injectors.
Momentum, however, tilts toward multi-zone systems growing at 6.4% CAGR as operators pursue finer reservoir steering. Second-generation interval control valves rated to 10,000 psi now tolerate sand and scale, broadening applicability in high-angle shale branches. Petrobras has installed over 50 multi-zone strings in pre-salt carbonates with minimal CAPEX delta versus conventional wells, validating their economic case. Real-time feedback loops close the optimization cycle, and by 2030, multi-zone designs are expected to approach parity with single-zone installations across new offshore wells.
By Component: Down-Hole Sensors Outpace Traditional Control Systems
Interval control valves secured 33.5% of 2024 spending and remain core to every smart well market size estimate, but the data layer is expanding faster. Down-hole sensors are forecast to post a 7.5% CAGR thanks to the shift from periodic logging to continuous surveillance.
Permanent pressure gauges, fiber-optic DAS, and multi-phasemeters stream gigabytes per day, enabling surface AI to predict water breakthrough and autonomously choke back aggressor zones. SLB has deployed more than 2,300 ICVs since 2000, yet revenue growth is increasingly tied to the analytics licenses bundled with sensor arrays. Packers and surface control units grow steadily as enablers, whereas next-gen electric feed-through packers merge power and data conduits in a single elastomer, simplifying completion geometry.


By Well Type: Multilateral Configurations Gain Traction
Horizontal wells captured 48.0% of 2024 sales, their dominance rooted in unconventional shale development that values long-reach laterals to maximize contact. Vertical wells persist in mature Gulf Coast and Middle East fields where recompletion upside remains.
Although only a niche today, multilateral wells are projected to climb at a 7.2% CAGR. Higher-level TAML junctions permit re-entry and selective stimulation, cutting drilling footage by 30% relative to equivalent single-lateral programs. Subsea retrofit multilaterals, first piloted in Norway, marry slot recovery with intelligent completions, keeping topside modifications minimal. Real-time coiled-tubing conveyed cameras and acoustic sensors further derisk complex interventions, accelerating industry confidence.
By Application: Offshore Segment Accelerates Despite Onshore Dominance
Onshore operations accounted for 61.7% of 2024 revenue, grounded in North American shale and Middle Eastern carbonate redevelopment. Lower logistics cost and ready rig access sustain uptake even when oil prices soften.
Offshore applications, however, are the smart well market’s fastest-growing slice at 7.9% CAGR, as deep-water breakevens fall below USD 40/bbl. Brazil’s Búzios Phase V wells bundle electric interval control valves with subsea boosting pumps, delivering 10% higher recovery while trimming CO₂ intensity per barrel. Gulf of Mexico 20K-psi projects and West African presalt explorers replicate this template, ensuring offshore’s share of the smart well market size widens through 2030.

Geography Analysis
North America led with 36.6% of 2024 revenue, leveraging shale innovation and deep-water Gulf of Mexico investments that demand high-spec completions. Permian Basin operators integrate fiber-optic cables during fracturing to refine stage spacing, then leave the array in place for production monitoring, illustrating the region’s data-centric culture. BP’s 20K-psi Kaskida project underscores North America’s appetite for next-generation HP/HT hardware that dovetails with electric control.
The Middle East & Africa region shows the quickest expansion, clocking a 7.3% CAGR to 2030 as NOCs pursue digital transformation. ADNOC’s USD 920 million AI-powered well program will outfit more than 2,000 wells with smart valves and private 5G links, moving the UAE toward remote-controlled production islands. Saudi Aramco’s AI-driven drilling optimization platform, projected to trim energy use by 40%, further elevates demand for intelligent completion hardware to feed clean, high-frequency data into learning models. Oman’s fully automated rotary and slide drilling run by Halliburton/Nabors extends the regional innovation narrative.
South America maintains strong momentum on the back of Brazil’s pre-salt build-out, where every new well is specified as intelligent to master labyrinthine carbonate heterogeneity. Guyana’s start-ups mirror the model, and new FPSO bids stipulate electric or hybrid hydraulic/electric completions. Meanwhile, Asia-Pacific emerges as a growth pocket tied to CCUS pilots in Australia, Malaysia, and China, each relying on distributed sensing arrays to confirm containment. Europe’s North Sea market stabilizes as operators extend field life via smart recompletions, while new projects like Equinor’s Johan Sverdrup Phase 3 integrate smart-well modules from inception.

Competitive Landscape
The smart well market is moderately concentrated, with the top five service companies accounting for roughly 68% of 2024 revenue. SLB’s USD 7.1 billion takeover of ChampionX in July 2025 folds production chemicals and digital twins into its completions franchise, targeting USD 400 million in annual synergies and reinforcing an integrated value proposition. Halliburton sharpens its edge through closed-loop hydraulic fracturing, co-developed with Chevron. It uses subsurface feedback to orchestrate stage energy in real time, demonstrating how completions and drilling automation converge.
Baker Hughes invests USD 643 million annually in R&D, focusing on all-electric interval control valves and the Leucipa production-optimization suite that can autonomously align choke settings across fields of 150+ wells, as evidenced by a 2025 Azerbaijan contract covering an entire onshore portfolio. TechnipFMC and Aker Solutions differentiate by bundling iEPCI™ or topside-modification scopes with intelligent completion packages, offering operators a single throat to choke during brownfield upgrades.
White-space entrants such as Corva (AI-drilling analytics) and specialized fiber-optic firms target data-management niches, collaborating with majors on pilot deployments. Cyber-hardened firmware, blockchain-verified command chains, and additive-manufactured valve components emerge as next-wave differentiators. At the same time, large incumbents dominate full-system delivery, partnerships with digital specialists intensify, suggesting a co-evolution of mechanical and software ecosystems.
Smart Well Industry Leaders
Schlumberger
Halliburton
Baker Hughes
Weatherford
NOV
- *Disclaimer: Major Players sorted in no particular order

Recent Industry Developments
- July 2025: SLB completed the USD 7.1 billion ChampionX acquisition, gaining chemicals and digital tools that unlock USD 400 million annual synergies.
- June 2025: TechnipFMC won a large iEPCI™ award for Equinor’s Johan Sverdrup Phase 3, incorporating smart well modules to optimize one of the North Sea’s flagship fields.
- June 2025: Chevron and Halliburton launched intelligent hydraulic fracturing in Colorado, executing closed-loop stage design without human intervention.
- June 2025: Baker Hughes secured a multi-year Azerbaijan contract to deploy electric submersible pumps and the Leucipa automation suite across 150 wells.


Global Smart Well Market Report Scope
| Single-zone Smart Well |
| Multi-zone Smart Well |
| Inflow Control Devices (ICDs) |
| Interval Control Valves (ICVs) |
| Downhole Sensors |
| Surface-Control Systems |
| Packers and Completion Equipment |
| Vertical |
| Horizontal |
| Multilateral |
| Onshore |
| Offshore |
| North America | United States |
| Canada | |
| Mexico | |
| Europe | Germany |
| United Kingdom | |
| France | |
| Italy | |
| NORDIC Countries | |
| Russia | |
| Rest of Europe | |
| Asia-Pacific | China |
| India | |
| Japan | |
| South Korea | |
| ASEAN Countries | |
| Rest of Asia-Pacific | |
| South America | Brazil |
| Argentina | |
| Rest of South America | |
| Middle East and Africa | Saudi Arabia |
| United Arab Emirates | |
| South Africa | |
| Egypt | |
| Rest of Middle East and Africa |
| By Technology | Single-zone Smart Well | |
| Multi-zone Smart Well | ||
| By Component | Inflow Control Devices (ICDs) | |
| Interval Control Valves (ICVs) | ||
| Downhole Sensors | ||
| Surface-Control Systems | ||
| Packers and Completion Equipment | ||
| By Well Type | Vertical | |
| Horizontal | ||
| Multilateral | ||
| By Application | Onshore | |
| Offshore | ||
| By Geography | North America | United States |
| Canada | ||
| Mexico | ||
| Europe | Germany | |
| United Kingdom | ||
| France | ||
| Italy | ||
| NORDIC Countries | ||
| Russia | ||
| Rest of Europe | ||
| Asia-Pacific | China | |
| India | ||
| Japan | ||
| South Korea | ||
| ASEAN Countries | ||
| Rest of Asia-Pacific | ||
| South America | Brazil | |
| Argentina | ||
| Rest of South America | ||
| Middle East and Africa | Saudi Arabia | |
| United Arab Emirates | ||
| South Africa | ||
| Egypt | ||
| Rest of Middle East and Africa | ||


Key Questions Answered in the Report
What is the current smart well market size and growth outlook?
The smart well market size is USD 8.25 billion in 2025 and is projected to reach USD 10.47 billion by 2030 at a 4.88% CAGR.
Which region leads global demand?
North America led with 36.6% revenue in 2024 due to shale activity and Gulf of Mexico deep-water projects.
Why are multi-zone systems gaining ground?
Operators want granular control over complex reservoirs; multi-zone completions are forecast to grow at 6.4% CAGR through 2030.
What drives rapid growth in the Middle East & Africa?
National oil companies are investing in large-scale digitalization and AI-enabled production systems, supporting a 7.3% regional CAGR to 2030.
How do all-electric completions improve HP/HT well economics?
Electric actuation removes hydraulic complexity, speeds valve response, and supplies continuous diagnostics, reducing downtime and broadening high-pressure field viability.
Which companies dominate the competitive landscape?
SLB, Halliburton, Baker Hughes, TechnipFMC, and Aker Solutions together control about two-thirds of global revenue, leveraging integrated mechanical and digital offerings.
Page last updated on:


