Well Completion Equipment and Services Market Size and Share
Market Overview
| Study Period | 2021 - 2031 |
|---|---|
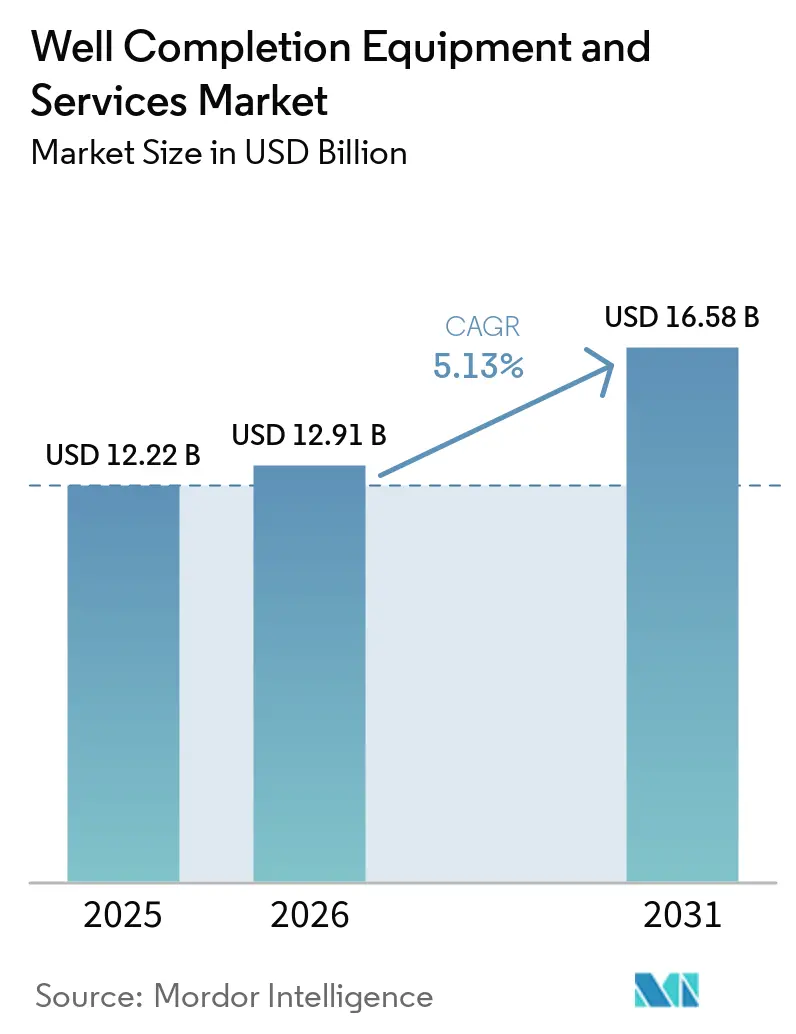
| Market Size (2026) | USD 12.91 Billion |
| Market Size (2031) | USD 16.58 Billion |
| Growth Rate (2026 - 2031) | 5.13% CAGR |
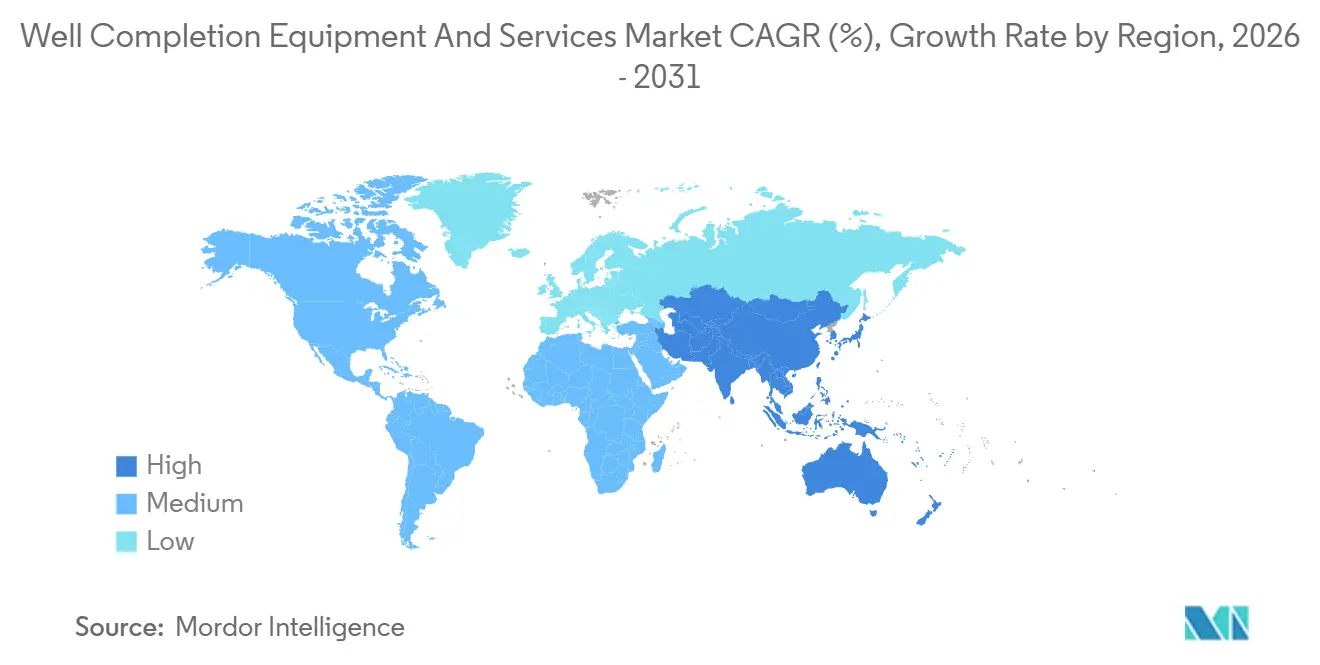
| Fastest Growing Market | Asia Pacific |
| Largest Market | North America |
| Market Concentration | Medium |
Major Players *Disclaimer: Major Players sorted in no particular order Image © Mordor Intelligence. Reuse requires attribution under CC BY 4.0. | |
Well Completion Equipment and Services Market Analysis by Mordor Intelligence
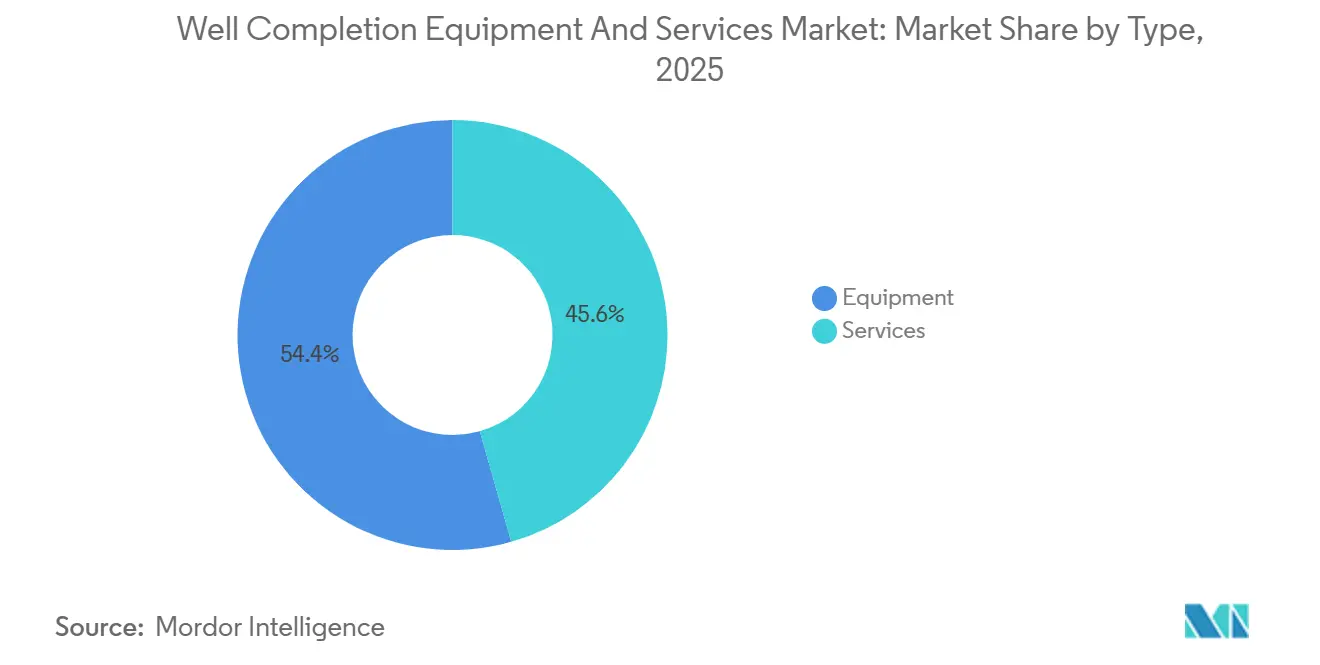
The Well Completion Equipment and Services Market size is projected to expand from USD 12.22 billion in 2025 and USD 12.91 billion in 2026 to USD 16.58 billion by 2031, registering a CAGR of 5.13% between 2026 to 2031. Operators are drilling fewer wells in North America yet extracting more hydrocarbons per completion through longer laterals and tighter stage spacing, while offshore deep-water and unconventional plays in Asia-Pacific and the Middle East continue to attract capital once earmarked for onshore shale. Equipment commanded a 54.4% revenue share in 2025, anchored by demand for packers, multi-stage fracturing tools, and liner hangers designed for 15,000 psi and 350 °F service, yet services are poised to grow faster at 6.8% annually as operators outsource hydraulic fracturing, wireline, and zonal-isolation work to shed fixed costs. Conventional wells still accounted for 61.0% of the well completion equipment and services market in 2025 due to Middle Eastern mega projects, but unconventional completions are advancing at a stronger 6.9% pace as Argentina’s Vaca Muerta and China’s Sichuan shales scale horizontal drilling. Regional dynamics favor Asia-Pacific, where offshore starts such as CNOOC’s Wenchang 16-2 and ONGC’s Krishna-Godavari cluster began producing in 2025, lifting the region’s forecast growth to 7.2%.
Key Report Takeaways
- By component, equipment led with 54.4% of well completion equipment and services market share in 2025, while services are projected to grow at a 6.8% CAGR to 2031.
- By well type, conventional wells held 61.0% of the well completion equipment and services market size in 2025, and unconventional wells are advancing at a 6.9% CAGR through 2031.
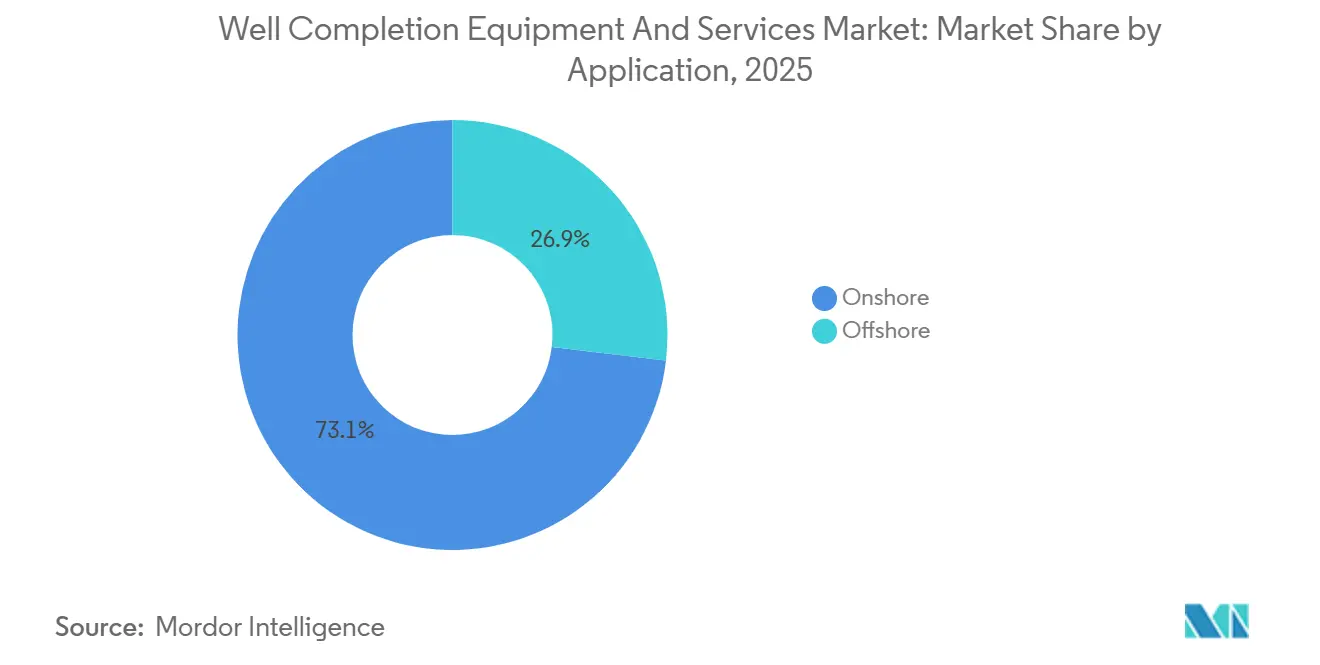
- By application, onshore completions accounted for 73.1% share of the well completion equipment and services market size in 2025, whereas offshore completions are forecast to expand at a 7.0% CAGR to 2031.
- By geography, North America held 40.3% of global revenue in 2025, whereas Asia-Pacific is expected to register the fastest regional CAGR at 7.2% by 2031.
Note: Market size and forecast figures in this report are generated using Mordor Intelligence’s proprietary estimation framework, updated with the latest available data and insights as of January 2026.
Global Well Completion Equipment and Services Market Trends and Insights
Drivers Impact Analysis*
| Driver | (~) % Impact on CAGR Forecast | Geographic Relevance | Impact Timeline |
|---|---|---|---|
| Rise in global drilling activities | +0.9% | Middle East, Asia-Pacific, Latin America | Medium term (2-4 years) |
| Increasing focus on unconventional reserves | +1.2% | North America, Argentina, Saudi Arabia, China | Long term (≥ 4 years) |
| Growing demand for advanced well-completion techniques | +0.8% | Global, with concentration in North America and Middle East | Medium term (2-4 years) |
| Offshore deep-water CAPEX rebound | +0.7% | Guyana, Brazil, Gulf of Mexico, West Africa | Long term (≥ 4 years) |
| Electrified frac fleets reduce OpEx/CO₂ | +0.6% | North America core, early adoption in Middle East | Short term (≤ 2 years) |
| Repurposing completions for CCUS and geothermal wells | +0.3% | North America, Europe, select Asia-Pacific hubs | Long term (≥ 4 years) |
| Source: Mordor Intelligence | |||
Rise in Global Drilling Activities
International rig counts climbed to 1,112 units in early 2025, adding 15 rigs year-on-year even as North American activity contracted, highlighting a pivot toward state-owned operators in the Middle East and Asia that prioritize energy security over short-cycle returns. Saudi Aramco’s Jafurah start-up and ADNOC Drilling’s USD 1 billion fleet expansion underline this trend. Deeper, hotter wells are driving demand for HPHT-rated packers, corrosion-resistant liner hangers, and multi-stage fracturing tools, pushing lead times to 26 weeks in late 2025. Completion revenue is therefore rising faster than rig count because every well consumes more value-added hardware. ONGC’s Krishna-Godavari cluster evidences the capital intensity, with roughly USD 69 million spent per well, most of which funds completion hardware and subsea tie-backs.
Increasing Focus on Unconventional Reserves
Unconventional plays are expanding at 6.9% annually as Argentina, Saudi Arabia, and China replicate North American shale economics. Vaca Muerta executed 23,784 fracturing stages in 2025, up 34% year-on-year, and will require another 1,000 wells by 2032 to meet domestic and LNG commitments. Saudi Aramco’s Jafurah aims for 2 billion scf/d of gas by 2030 from carbon-lite electric frac fleets, while China’s Sichuan and Ordos basins employ fiber-optic monitoring to trim completion time by 18%. Localized supply chains and state financing are smoothing learning curves, allowing the well-completion equipment and services market to diversify beyond North America.
Electrified Frac Fleets Reduce OpEx/CO₂
Electric fleets deliver 30%-40% fuel savings and virtually eliminate diesel particulates, advantages magnified by the U.S. EPA methane rule that adds a USD 900-1,500 per-ton waste charge from 2026. Liberty’s DuraStim system realized 99% emissions cuts and 30% fuel savings in Permian campaigns during 2025, while NexTier’s Zeus fleet posted 40% savings and secured multi-year contracts [1]Editorial Team, “Liberty’s DuraStim Achieves Emissions Milestone,” Liberty Oilfield Services, libertyoilfieldservices.com. Service companies able to finance USD 25-30 million per fleet gain pricing latitude, evidenced by Liberty’s 15% premium spreads in Q3 2025 despite an industry-wide decline in active fleets. Early pilots in Saudi Arabia and ADNOC projects show the technology’s global diffusion path.
Repurposing Completions for CCUS and Geothermal Wells
Carbon capture and geothermal pilots currently form under 2% of the well completion equipment and services market, yet they command premiums of 20%-30% because CO₂-resistant elastomers and 400 °F cement systems require custom metallurgy. Occidental’s Stratos facility injects 500,000 t/yr of CO₂ using modified packers designed for 50-year service [2]Staff Writer, “Stratos DAC Facility Online,” Occidental Petroleum, oxy.com. ExxonMobil’s Bayou Bend CCS and Fervo Energy’s Project Red geothermal plant follow similar blueprints, broadening the customer base for high-spec completion hardware. Suppliers investing in advanced materials R&D stand to capture policy-driven growth as carbon pricing expands.
Restraints Impact Analysis*
| Restraint | (~) % Impact on CAGR Forecast | Geographic Relevance | Impact Timeline |
|---|---|---|---|
| Volatile crude-oil prices | -1.1% | Global, acute in North America shale | Short term (≤ 2 years) |
| Environmental and regulatory stringency | -0.5% | North America, Europe, select Asia-Pacific markets | Medium term (2-4 years) |
| HPHT-grade elastomer and alloy shortages | -0.4% | Global, concentrated in offshore and Middle East HPHT plays | Medium term (2-4 years) |
| Data-platform interoperability gaps | -0.2% | Global, most acute in digitally mature North America and Europe | Long term (≥ 4 years) |
| Source: Mordor Intelligence | |||
Volatile Crude-Oil Prices
Brent averaged USD 69/bbl in 2025 before spiking to USD 94 in March 2026, a 36% swing that compressed completion budgets as listed E&Ps held spending flat despite higher prices. Day rates for hydraulic fracturing slipped 8% in Q1 2026 even as diesel costs rose, squeezing pressure-pumper margins. Offshore projects are less price-sensitive because multi-year commitments insulate completion schedules, yet exploration budgets and the future pipeline of wells remain tied to price sentiment.
HPHT-Grade Elastomer and Alloy Shortages
Lead times for 15,000 psi packers and liner hangers doubled to 26 weeks in late 2025 amid shortages of nickel-chromium-molybdenum alloys and fluoroelastomers. Weatherford and TechnipFMC both flagged delayed deliveries that deferred revenue, and operators now pre-order equipment up to a year ahead to avoid rig downtime [3]Earnings Call Transcript, “TechnipFMC Q3 2025 Results,” TechnipFMC, technipfmc.com. Supply-chain bottlenecks risk capping upside in fast-growing offshore and Middle Eastern HPHT projects unless new foundry capacity comes online.
*Our forecasts treat driver/restraint impacts as directional, not additive. The impact forecasts reflect baseline growth, mix effects, and variable interactions.
Segment Analysis
By Type: Services Outpace Equipment on Outsourcing Trend
Services revenue is projected to grow at a 6.8% CAGR to 2031 as operators outsource hydraulic fracturing, wireline, and zonal isolation. Liberty’s USD 727 million Q3 2025 revenue highlights demand for e-frac fleets that save 30% in fuel. Wireline is evolving into an intelligent-perforation service, with Schlumberger’s ReSOLVE iX platform reducing non-productive time by 12%. Gravel-packing demand is climbing in deepwater wells where sand control protects billion-dollar investments.
Equipment maintained a 54.4% share of the well completion equipment and services market size in 2025, fueled by packers, multi-stage fracturing tools, and liner hangers, yet growth is slowing as refurbishment programs increasingly extend tool lifespans and decrease replacement frequency. NOV logged USD 420 million in completion-equipment orders for Q4 2025, mainly from subsea systems destined for Guyana and Brazil. Suppliers able to pivot into HPHT and subsea niches or bundle installation services stand to defend margins.


By Well Type: Unconventional Gains on Horizontal Scaling
Conventional wells still held 61.0% of the well completion equipment and services market share in 2025, supported by Middle Eastern producers and mature offshore fields. These wells lean on single-zone perforations, tubing-conveyed packers, and gravel packs. ADNOC’s SARB deep-gas project will apply intelligent completions to four 4,500 m wells at 15,000 psi.
Unconventional completions are rising at 6.9% annually, propelled by 40-100 fracture stages per well, longer laterals, and higher proppant loads. Saudi Aramco’s Jafurah averages 60-80 stages per well, while CNPC’s Sichuan programs reduced completion time 18% by pairing rotary-steerable drilling with fiber-optic monitoring. Service companies that master local logistics and water management gain the inside track.
By Application: Offshore Premium Drives 7.0% Growth
Onshore captured 73.1% of the well completion equipment and services market size in 2025, reflecting North American shale’s dominance. The growth lever is completion intensity rather than rig count; average Permian laterals surpassed 10,000 ft in 2025, and cluster spacing tightened to 15-20 ft, lifting stages per well and keeping pressure-pumping fleets busy.
Offshore completions are forecast to grow 7.0% as Guyana, Brazil, and West Africa move deep-water discoveries toward first oil. Chevron’s USD 7 billion multi-basin program and TechnipFMC’s USD 11.9 billion subsea backlog illustrate capital commitments that lock in long-cycle demand. Offshore tools command 40%-60% premiums over onshore equivalents due to subsea installation complexity and HPHT metallurgy.
Geography Analysis
North America maintained a 40.3% share in 2025, yet basin-level divergence is widening. The Permian sustains momentum with longer laterals and e-frac adoption that lowers emissions ahead of EPA methane fees, while the Bakken and Eagle Ford contract as operators prioritize free cash flow. Canada’s Montney and Duvernay programs rely on high-rate pumping and dissipate completion dollars into LNG export value chains.
Asia-Pacific is the fastest-growing region at 7.2%. CNOOC’s Wenchang 16-2, Weizhou 11-4, and Panyu expansions added more than 100,000 boe/d in 2025 through subsea completions equipped with sand-control screens and HPHT packers, while ONGC’s Krishna-Godavari cluster produced 25,000 b/d from eight wells and a USD 477.28 million investment [4]Press Release, “Wenchang 16-2 First Oil,” CNOOC, cnooc.com. Indonesian and Malaysian unconventional gas targets are driving collaboration accords, such as Pertamina’s 2025 pact with Halliburton to automate completions.
The Middle East and Africa revolve around Aramco’s Jafurah and ADNOC’s SARB deep-gas buildouts, along with TechnipFMC’s integrated subsea work in West Africa. ADNOC Drilling plans to expand its fleet to 151 rigs by 2028 after investing more than USD 1 billion in 2025, signaling longer-term completion demand beyond oil recovery. South America’s Vaca Muerta remains a bright spot, with a 34% annual jump in fracture stages and cross-border gas sales approved to Petrobras, ensuring sustained activity through the decade.

Competitive Landscape
The well completion equipment and services market features moderate concentration. Schlumberger, Halliburton, and Baker Hughes together hold a major share of the market and continue to leverage digital platforms and electric fleets. Schlumberger’s ReSOLVE iX wireline cut non-productive time by 12% and commands price premiums in the Permian, while Baker Hughes’ Kantori platform, launched in January 2026, aggregates operator data to predict failures and anchors outcome-based contracts. Halliburton’s automated well construction shaved 15% off completion times in Guyana, accelerating Chevron’s FPSO schedule.
Pure-play pressure pumpers such as Liberty and NexTier seize share through e-frac economics. Liberty expanded its DuraStim fleet to 12 units and captured 15% pricing premiums, and NexTier’s Zeus units achieved 40% fuel savings in multi-year deals.
White-space gains are forming in CCUS and geothermal, where Occidental’s Stratos and ExxonMobil’s Bayou Bend set benchmarks for CO₂-resistant completions. Niche specialists like TAM International and Packers Plus are winning orders in Argentina and Canada by shortening run-in-hole time and eliminating casing cementation costs.
Well Completion Equipment and Services Industry Leaders
Schlumberger
Halliburton
Baker Hughes
Weatherford
NOV
- *Disclaimer: Major Players sorted in no particular order


Recent Industry Developments
- July 2025: SLB closed its USD 7.8 billion acquisition of ChampionX, targeting USD 400 million in annual pretax synergies within three years.
- March 2025: SLB secured a drilling contract for Woodside’s ultra-deepwater Trion project offshore Mexico, covering 18 wells over three years with AI-enabled capabilities.
- December 2024: Using integrated services, SLB and ADNOC Drilling formed Turnwell Industries LLC to complete 144 UAE unconventional wells by Q4 2025.
- August 2024: Chevron’s USD 5.7 billion Anchor project began production with industry-first 20,000 psi completions, unlocking 440 million boe over 30 years.


Global Well Completion Equipment and Services Market Report Scope
Well completion equipment and services include the tools and processes required to transform a drilled oil or gas well into a functional and productive asset. This involves installing components such as tubing, packers, valves, and surface control systems, as well as performing activities like perforation, stimulation, and testing. These measures ensure controlled hydrocarbon flow, enhance reservoir performance, and extend the well's operational lifespan.
The Well Completion Equipment and Services market is segmented by type, well type, application, and geography. By type, the market is segmented into equipment and services; equipment includes packers, sand-control tools, multi-stage fracturing tools, liner hangers, valves, and others, while services include hydraulic fracturing, wireline services, perforating, gravel packing, and zonal-isolation services. By well type, the market is segmented into conventional and unconventional wells. By application, the market is segmented into onshore and offshore. The report also covers market sizes and forecasts for the global well completion equipment and services market across major countries in key regions. For each segment, market sizing and forecasts have been conducted on the basis of value (USD).
| Equipment | Packers |
| Sand-control tools | |
| Multi-stage fracturing tools | |
| Liner hangers | |
| Valves and others | |
| Services | Hydraulic fracturing |
| Wireline services | |
| Perforating | |
| Gravel packing | |
| Zonal-isolation services |
| Conventional |
| Unconventional |
| Onshore |
| Offshore |
| North America | United States |
| Canada | |
| Mexico | |
| Europe | Germany |
| United Kingdom | |
| France | |
| Italy | |
| NORDIC Countries | |
| Russia | |
| Rest of Europe | |
| Asia-Pacific | China |
| India | |
| Japan | |
| South Korea | |
| ASEAN Countries | |
| Rest of Asia-Pacific | |
| South America | Brazil |
| Argentina | |
| Rest of South America | |
| Middle East and Africa | Saudi Arabia |
| United Arab Emirates | |
| South Africa | |
| Egypt | |
| Rest of Middle East and Africa |
| By Type | Equipment | Packers |
| Sand-control tools | ||
| Multi-stage fracturing tools | ||
| Liner hangers | ||
| Valves and others | ||
| Services | Hydraulic fracturing | |
| Wireline services | ||
| Perforating | ||
| Gravel packing | ||
| Zonal-isolation services | ||
| By Well Type | Conventional | |
| Unconventional | ||
| By Application | Onshore | |
| Offshore | ||
| By Geography | North America | United States |
| Canada | ||
| Mexico | ||
| Europe | Germany | |
| United Kingdom | ||
| France | ||
| Italy | ||
| NORDIC Countries | ||
| Russia | ||
| Rest of Europe | ||
| Asia-Pacific | China | |
| India | ||
| Japan | ||
| South Korea | ||
| ASEAN Countries | ||
| Rest of Asia-Pacific | ||
| South America | Brazil | |
| Argentina | ||
| Rest of South America | ||
| Middle East and Africa | Saudi Arabia | |
| United Arab Emirates | ||
| South Africa | ||
| Egypt | ||
| Rest of Middle East and Africa | ||


Key Questions Answered in the Report
How large is the well completion equipment and services market in 2026?
The well completion equipment and services market size is projected to expand from USD 12.22 billion in 2025 and USD 12.91 billion in 2026 to USD 16.58 billion by 2031, registering a CAGR of 5.13% between 2026 to 2031.
What is the forecast CAGR for completions between 2026 and 2031?
The market is projected to register a 5.1% CAGR over the 2026-2031 period.
Which segment is expanding fastest within completions?
Services, particularly hydraulic fracturing and wireline, are forecast to grow 6.8% annually to 2031.
Why are electric fracturing fleets gaining traction?
E-frac units cut fuel use by up to 40% and virtually eliminate diesel particulates, helping operators comply with EPA methane rules while reducing operating costs.
Which region will contribute the most incremental growth?
Asia-Pacific leads with a forecast 7.2% CAGR, driven by new offshore fields in China and India.
Page last updated on:


