Smart Railways Market Size and Share
Market Overview
| Study Period | 2020 - 2031 |
|---|---|
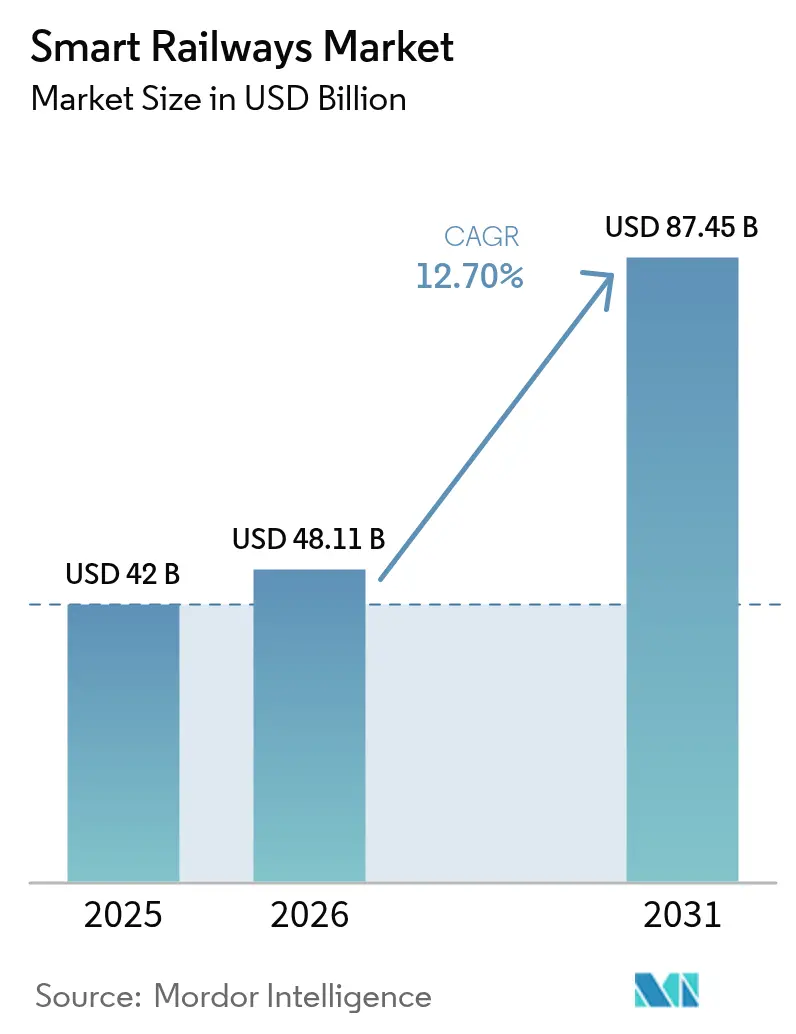
| Market Size (2026) | USD 48.11 Billion |
| Market Size (2031) | USD 87.45 Billion |
| Growth Rate (2026 - 2031) | 12.70% CAGR |
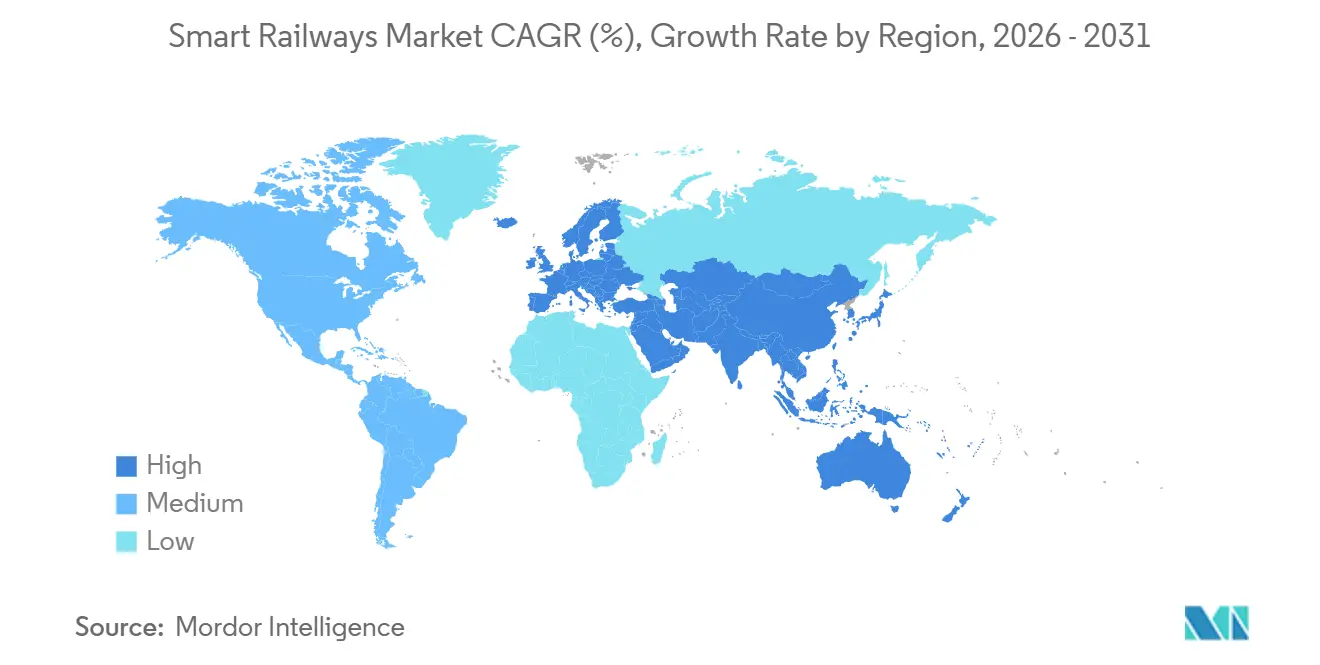
| Fastest Growing Market | Asia Pacific |
| Largest Market | Europe |
| Market Concentration | Medium |
Major Players *Disclaimer: Major Players sorted in no particular order Image © Mordor Intelligence. Reuse requires attribution under CC BY 4.0. | |
Smart Railways Market Analysis by Mordor Intelligence
The smart railways market size is projected to be USD 42 billion in 2025, USD 48.11 billion in 2026, and reach USD 87.45 billion by 2031, growing at a CAGR of 12.7% from 2026 to 2031. Growing commitments to net-zero transportation, large-scale 5 G rollouts, and multibillion-dollar European Rail Traffic Management System (ERTMS) grants are pushing rail operators to replace analogy signalling with digital-native platforms. Operators are prioritizing software-defined networking and predictive analytics that extend the life of existing rolling stock, reducing the need for costly new trains even as passenger demand rebounds. Procurement teams are shifting capital toward integrated turnkey projects because governments now tie financing to interoperable, open-architecture solutions rather than proprietary point products. The net effect is a market in which signalling upgrades, edge-AI hardware, and cloud-hosted traffic-management applications all expand in lockstep, creating scale economics that further accelerate adoption.
Key Report Takeaways
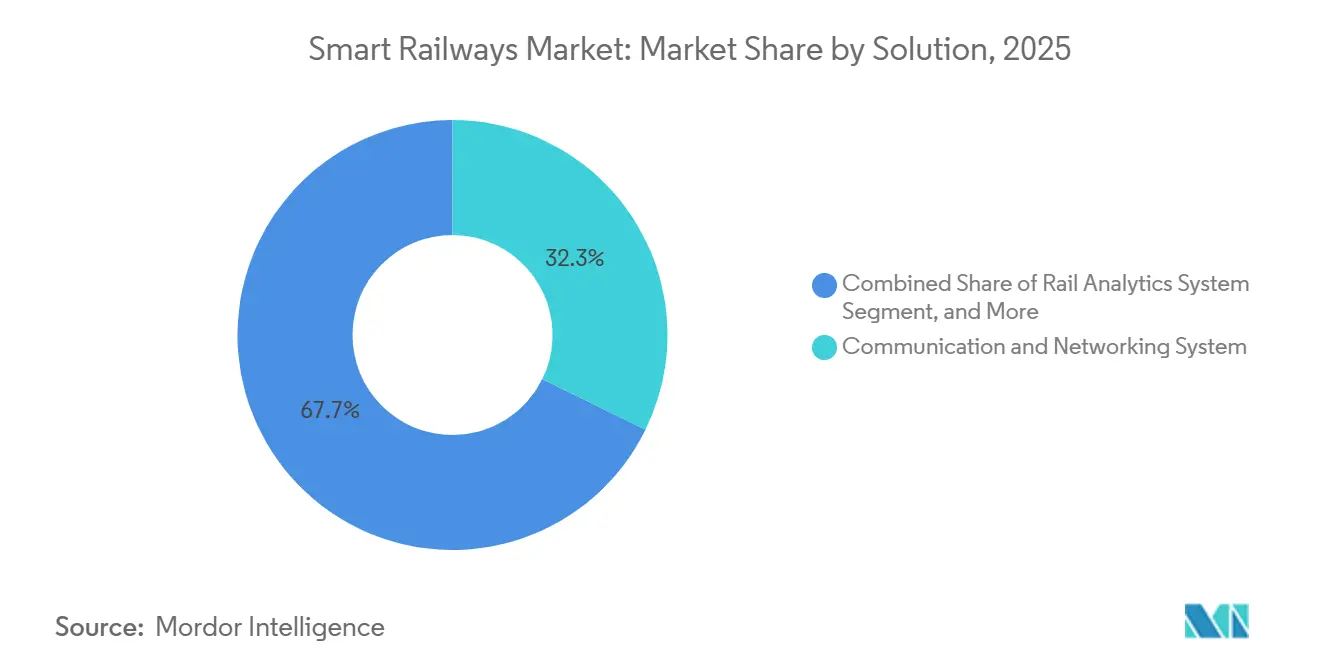
- By solution, Communication and Networking Systems held 32.27% of 2025 revenue while Rail Analytics Systems are expanding at a 13.8% CAGR through 2031.
- By rail type, Passenger Rail commanded 46.75% share of the smart railways market size in 2025, and High-Speed Rail is projected to advance at a 13.34% CAGR between 2026 and 2031.
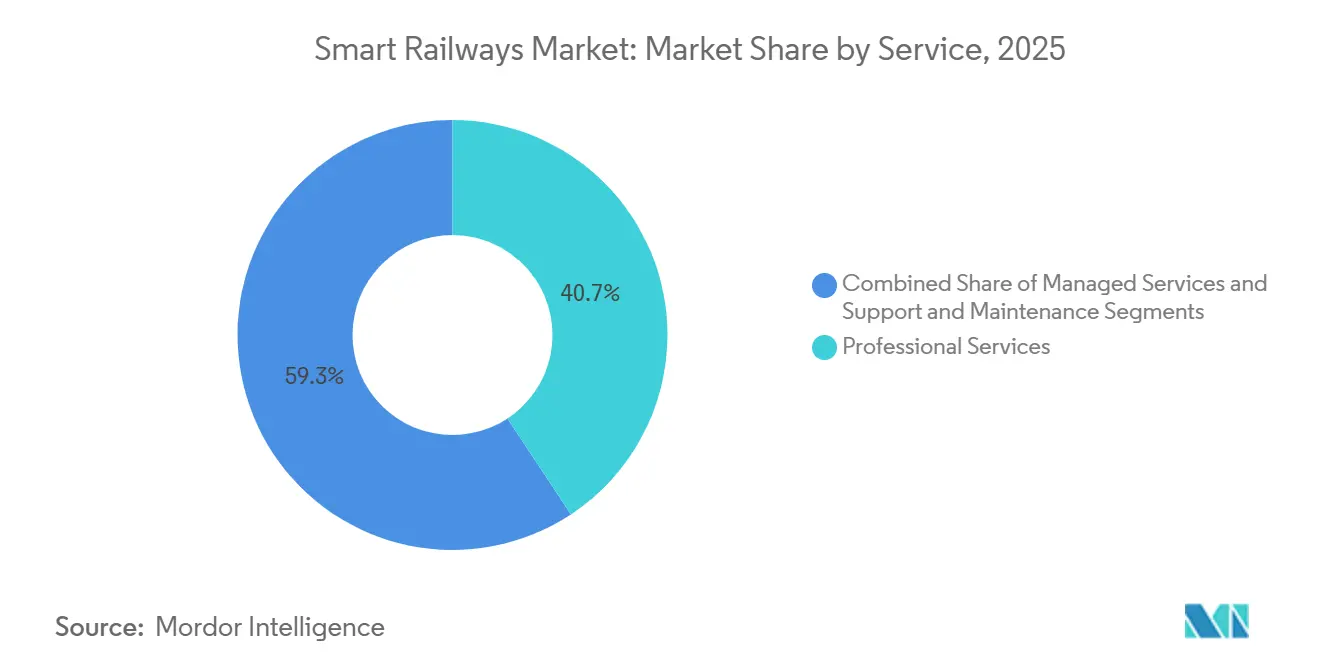
- By service, Professional Services captured 40.71% of revenue in 2025 whereas Managed Services exhibit the fastest growth at 13.23% CAGR through 2031.
- By deployment mode, Cloud led with 48.49% share in 2025, while Hybrid architectures are forecast to grow 13.45% annually to 2031.
- By geography, Asia-Pacific accounted for 41.53% of smart railways market share in 2025 and the Middle East is the fastest-growing region at a 12.99% CAGR from 2026–2031.
Note: Market size and forecast figures in this report are generated using Mordor Intelligence’s proprietary estimation framework, updated with the latest available data and insights as of 2026.
Global Smart Railways Market Trends and Insights
Drivers Impact Analysis*
| Driver | (~) % Impact on CAGR Forecast | Geographic Relevance | Impact Timeline |
|---|---|---|---|
| Government Smart-City and Net-Zero Mandates | +2.80% | Global, with concentration in EU, China, India | Medium term (2-4 years) |
| Rapid Roll-Out of FRMCS/5G Private Networks for Rail | +2.50% | Europe, Asia-Pacific core, early adoption in GCC | Short term (≤ 2 years) |
| Adoption of AI-Driven Predictive Maintenance Platforms | +2.20% | North America, Europe, Japan, Australia | Medium term (2-4 years) |
| Growth in High-Speed Rail and Urban Transit Megaprojects | +2.00% | Asia-Pacific, Middle East, selective European corridors | Long term (≥ 4 years) |
| Cross-Border ERTMS and TEN-T Compliance Funding Surge | +1.60% | Europe, with spillover to North Africa and Turkey | Medium term (2-4 years) |
| DBaaS-Enabled MaaS Platforms Improving Passenger UX | +1.20% | Urban centers in North America, Europe, Asia-Pacific | Short term (≤ 2 years) |
| Source: Mordor Intelligence | |||


Government Smart-City and Net-Zero Mandates
National decarbonization rules are drawing rail budgets toward full route electrification and real-time energy dashboards that correlate traction load with timetable adherence, ensuring every kilowatt is traceable to a carbon target.[1]UK Department for Transport, “Rail Network Enhancements Pipeline,” gov.uk United Kingdom funding of GBP 3.2 billion (USD 4.13 billion) for the Trans-Pennine upgrade stipulates cloud-hosted energy management by 2027, pushing suppliers to bundle traction-power analytics with digital signalling. India now requires new rolling stock to demonstrate 30% energy savings compared with 2020 baselines, accelerating uptake of AI-driven driver advisory systems that dynamically adjust speed profiles.[2]Ministry of Railways, Government of India, “National Rail Plan and Kavach Deployment,” indianrailways.gov.in In Japan, disclosure of Scope 3 emissions has led JR East to install smart meters in 1,800 stations, integrating consumption data with its wholesale electricity trading desk. EU freight-mode-shift objectives, which aim for 30% of long-haul cargo to move by rail by 2030, stimulate automation investment in marshalling yards, reinforcing the business case for machine-vision-based wagon identification.[3]European Commission, “Connecting Europe Facility – Transport Sector,” ec.europa.eu
Rapid Roll-Out of FRMCS / 5 G Private Networks for Rail
Migration from GSM-R to Future Railway Mobile Communication System unlocks multigigabit capacity for high-definition CCTV, passenger Wi-Fi, and continuous train diagnostics. Deutsche Bahn’s Berlin–Munich pilot validated network slicing that keeps command-and-control traffic logically isolated, meeting EU safety-case expectations. China Railway’s standalone 5 G deployment across 8,000 route-kilometers by December 2025 positions Chinese integrators to export turnkey packages across Southeast Asia and Africa.[4]Ministry of Industry and Information Technology, China, “Railway 5 G Spectrum Allocation,” miit.gov.cn Meanwhile, Network Rail’s GBP 250 million (USD 322.5 million) FRMCS contract with Siemens Mobility surfaced latency spikes during handoffs, prompting hybrid GSM-R / FRMCS gateways that other EU operators are now replicating. Emerging revenue models let operators lease excess 5 G capacity to logistics firms located along the right-of-way, a non-fare income stream that strengthens project cash flows.
Adoption of AI-Driven Predictive Maintenance Platforms
Edge-AI chips that fuse vibration, current, and thermal telemetry are cutting unplanned locomotive downtime by double digits, making predictive analytics the fastest-growing smart railways market solution category. Hitachi Rail’s Lumada platform reduced Trenitalia faults 40% after ingesting 2 billion sensor records and correlating anomalies with track geometry. Wabtec’s reinforcement-learning Trip Optimizer is now mandatory on 3,500 BNSF freight locomotives, saving USD 150 million in annual fuel and lowering brake-shoe replacements 25%. Integration barriers still exist because many computerized maintenance management systems rely on SOAP rather than REST APIs; vendors buying middleware specialists, such as Siemens with its Sqills acquisition, solve this bottleneck.
Growth in High-Speed Rail and Urban Transit Megaprojects
Governments view high-speed corridors as strategic infrastructure that supports tourism and economic diversification, often accepting cost overruns private investors would reject. Saudi Arabia ordered 20 additional Avelia trainsets valued at USD 1.2 billion to lift Haramain High-Speed Railway capacity to 300 km/h. India’s under-construction 21 km under-sea tunnel on the Mumbai–Ahmedabad line requires continuous FRMCS coverage and seismic-resistant signalling, limiting bidders to large Japanese European consortia. Japan’s Chuo Shinkansen maglev demands sub-millimeter track-alignment monitoring, driving R&D partnerships on fiber-optic sensing. The common denominator across projects is a contractual requirement for digital twins that anticipate component fatigue before it threatens timetable integrity.
Restraints Impact Analysis*
| Restraint | (~) % Impact on CAGR Forecast | Geographic Relevance | Impact Timeline |
|---|---|---|---|
| Legacy System Interoperability Bottlenecks | -1.40% | Global, acute in Europe and North America | Short term (≤ 2 years) |
| High Upfront CAPEX for Digital Signalling Upgrades | -1.20% | Europe, North America, selective Asia-Pacific markets | Medium term (2-4 years) |
| Cyber-Security and Safety-Certification Complexity | -0.90% | Global, with stringent requirements in EU and Japan | Medium term (2-4 years) |
| Skilled-Labour Shortages for Rail-ICT Convergence | -0.70% | Europe, North America, Japan, Australia | Long term (≥ 4 years) |
| Source: Mordor Intelligence | |||
Legacy System Interoperability Bottlenecks
Mixed fleets equipped with multiple Automatic Train Control standards force suppliers to build custom gateways that inflate project budgets and complicate software patch management. SNCF’s need to lease 200 dual-mode locomotives during the ERTMS transition underscores how upgrade phasing can erode operational resilience. In North America, the USD 15 billion cost of integrating Positive Train Control with legacy block signalling still weighs on balance sheets, delaying new digital-overlay adoption. Each additional translation layer also expands the cyber-attack surface, making holistic modernization harder to justify.
High Upfront CAPEX for Digital Signalling Upgrades
Deutsche Bahn’s plan to digitize 12,000 route-kilometers carries an EUR 8.5 billion (USD 9.44 billion) price tag, forcing the operator to stage investments and accept fragmented benefits. Onboard ETCS equipment still costs EUR 150,000–200,000 per locomotive, a sum exceeding many wagons’ residual value, deterring private freight owners. Even software-defined interlocking needs years of safety-case preparation, as Alstom’s GBP 80 million (USD 103.2 million) Northern Line pilot showed, signalling that complexity, not silicon, is the primary cost driver.
*Our forecasts treat driver/restraint impacts as directional, not additive. The impact forecasts reflect baseline growth, mix effects, and variable interactions.
Segment Analysis
By Solution: Analytics Platforms Outpace Connectivity Investments
Rail Analytics Systems expanded its share of the smart railways market size by 13.8% CAGR because operators found immediate savings through component-life extension and inventory rationalization. Communication and Networking Systems still accounted for 32.27% revenue in 2025, boosted by FRMCS infrastructure, but growth is levelling as first-wave deployments finish. In freight corridors, asset-management suites combine historical failure logs with live sensor feeds, letting Canadian Pacific Kansas City trim locomotive downtime 18% after a continent-wide rollout. Smart ticketing converges with Mobility-as-a-Service, as Singapore riders now pay for integrated journeys with one digital wallet. Cyber-security solutions await final IEC 62443-4-2 guidelines, delaying contracts but setting the stage for an eventual spending surge.
Second-generation analytics add computer-vision defect detection and federated learning, features that process data on-device to comply with data-sovereignty mandates. Suppliers therefore bundle rugged edge gateways and cloud inference into one license, aligning with operators’ shift to outcome-based procurement. The smart railways market continues reallocating budgets from raw connectivity to higher-margin analytics that accelerate return on capital and unlock ancillary revenue such as predictive spares provisioning.


By Rail Type: High-Speed Corridors Drive Digitalization Intensity
Passenger Rail contributed 46.75% of 2025 revenue as city transit agencies funded Wi-Fi, video, and crowd-monitoring tools that shorten dwell times. High-Speed Rail, however, is projected to outgrow all other categories at 13.34% CAGR, scaling digital twins for superconducting magnets on Japan’s maglev and tilt-control algorithms on Spain’s 330 km/h services. Freight Rail lags, but Union Pacific’s GPS-beacon mandate is forcing leasing firms to embed telematics, opening the door for industrial-IoT newcomers.
Urban Transit systems embrace Communications-Based Train Control from day one, seen in Riyadh’s 90-second headways that exceed what conventional signalling supports. Light Rail projects in North America integrate traffic-signal priority through standardized APIs, demonstrating interagency cooperation once deemed impractical. Each sub-segment’s growth reflects how closely capital intensity aligns with the operational benefits digitalization unlocks.
By Service: Managed Services Gain as Operators Outsource Complexity
Professional Services held 40.71% of 2025 spending because ERTMS migration and safety-case documentation remain labour intensive. Managed Services display a 13.23% CAGR because operators want vendors to shoulder cyber-risk, uptime guarantees, and software patches. Alstom’s 15-year fixed-fee maintenance for hydrogen iLint fleets exemplifies outcome pricing that converts capital into predictable opex.
Operators with limited in-house IT, such as Queensland Rail, now hand entire radio networks to third parties, letting staff focus on timetable design. EU rules that require independent safety validation for every code change drive a consulting bottleneck, increasing day rates and reinforcing the managed-services case. As the smart railways market matures, suppliers weave analytics, hardware, and 24 / 7 monitoring into one service-level agreement.
By Deployment Mode: Hybrid Architectures Reconcile Latency and Sovereignty
Cloud captured 48.49% revenue in 2025 because passenger-facing apps benefit from elastic scale and global content delivery. Hybrid deployments grow 13.45% annually as CENELEC EN 50126 forces operators to keep fail-safe logs on premises. Hitachi Rail’s dual-plane design for Trenitalia splits safety traffic locally while analysing patterns in the cloud, minimizing latency without breaching sovereignty.
Freight carriers favour on-premises for dispatch systems after a 2024 hyperscaler outage stalled U.S. locomotive dashboards, prompting Norfolk Southern to repatriate workloads. Meanwhile, EU cybersecurity guidelines recommend EU-hosted data and quantum-resistant encryption, favouring regional clouds. Gateway vendors like Cisco now preprocess anomalies at the trackside, cutting bandwidth 70% for Indian Dedicated Freight corridors, underlining the hybrid model’s economic appeal.
Geography Analysis
Asia-Pacific accounts for over 41.5% of the smart railways market size due to China’s 45,000 km high-speed grid and India’s USD 130 billion modernization plan. Both nations mandate domestic content, compelling European and U.S. suppliers to form joint ventures, localize software, and transfer intellectual property. Japan’s maglev experiments create a halo effect, raising digital-twin expectations across the region.
The Middle East posts the fastest 12.99% CAGR through 2031. Saudi Arabia’s USD 22.5 billion Riyadh Metro Phase 2 and the UAE’s AI-refit of Dubai Metro prove governments will pay premium prices for turnkey reliability in harsh desert climates. Localization clauses drive global suppliers to set up GCC factories, accelerating technology diffusion and regional job growth.
Europe trails in growth but remains pivotal because Brussels finances cross-border ERTMS corridors. The EUR 1.6 billion (USD 1.78 billion) Connecting Europe Facility reduces risk for projects traversing Rhine-Alpine and Scandinavian-Mediterranean routes. However, fragmented national rules dilute scale economies, slowing adoption versus Asia.
North America focuses spending on freight efficiency, but USD 8.2 billion in U.S. intercity funding allows Amtrak’s 220 mph trainsets to integrate 5 G routers and ETCS Level 2. Canada and Mexico watch outcomes before committing to similar upgrades. South America’s investments center on mining railways, such as Vale’s autonomous iron-ore trains, which function as proofs of concept for passenger adaptation. Africa concentrates on North African high-speed builds like Morocco’s 320 km/h extension to Marrakech.

Competitive Landscape
Siemens, Alstom, Hitachi, Huawei, and Cisco controlled 52% of 2025 revenue, indicating moderate concentration. Siemens’ purchase of Sqills boosts software credentials, enabling bids that bundle equipment, data integration, and multi-year managed services. Alstom’s Saudi joint venture satisfies localization in Gulf Cooperation Council tenders, pre-empting Chinese challengers.
Edge-AI capability is the new battleground. Hitachi processed 2.3 billion sensor events for 14 European operators in 2025, transforming data lakes into actionable alerts. Thales leverages defense-grade cybersecurity to win contracts requiring quantum-safe encryption. Cisco’s Time-Sensitive Networking switches converge passenger Wi-Fi, CCTV, and signalling onto one IP backbone, attracting metros with space constraints.
White-space opportunities emerge in freight telematics where niche players like Advantech and Moxa supply rugged gateways immune to intermodal vibration extremes. Larger integrators focus on passenger comfort, leaving freight IoT an open arena. The competitive trend favours vendors offering entire digital twins across rolling stock and infrastructure, reducing multi-vendor risk for operators.
Smart Railways Industry Leaders
Alstom SA
Hitachi Ltd.
Wabtec Corporation
Bombardier Transportation Inc.
Indra Sistemas SA
- *Disclaimer: Major Players sorted in no particular order


Recent Industry Developments
- January 2026: Siemens Mobility won a EUR 1.8 billion (USD 2.0 billion) order for 100 Velaro Novo sets with 30-year maintenance.
- December 2025: Alstom completed Riyadh Metro Phase 1, delivering 176 driverless trains and six depots.
- November 2025: Hitachi Rail and Mitsubishi Electric formed a joint venture for silicon-carbide traction inverters.
- October 2025: Cisco sealed a USD 120 million deal with Indian Railways for converged IP at 50 key stations.


Global Smart Railways Market Report Scope
The Smart Railways Market Report is Segmented by Solution (Rail Analytics System, Communication and Networking System, Rail Asset Management and Maintenance, Smart Ticketing and Revenue Management, Cyber-Security and Safety), Rail Type (Passenger Rail, Freight Rail, Urban Transit/Metro/LRT, High-Speed Rail), Service (Professional Services, Managed Services, Support and Maintenance), Deployment Mode (On-Premise, Cloud, Hybrid), and Geography (North America, South America, Europe, Asia-Pacific, Middle East, Africa). Market Forecasts are Provided in Terms of Value (USD).
| Rail Analytics System |
| Communication and Networking System |
| Rail Asset Management and Maintenance |
| Smart Ticketing and Revenue Management |
| Cyber-Security and Safety |
| Passenger Rail |
| Freight Rail |
| Urban Transit / Metro / LRT |
| High-Speed Rail |
| Professional Services |
| Managed Services |
| Support and Maintenance |
| On-Premise |
| Cloud |
| Hybrid |
| North America | United States |
| Canada | |
| Mexico | |
| South America | Brazil |
| Argentina | |
| Rest of South America | |
| Europe | Germany |
| United Kingdom | |
| France | |
| Italy | |
| Spain | |
| Russia | |
| Rest of Europe | |
| Asia-Pacific | China |
| Japan | |
| South Korea | |
| India | |
| Australia and New Zealand | |
| Rest of Asia-Pacific | |
| Middle East | GCC |
| Turkey | |
| Rest of Middle East | |
| Africa | South Africa |
| Rest of Africa |
| By Solution | Rail Analytics System | |
| Communication and Networking System | ||
| Rail Asset Management and Maintenance | ||
| Smart Ticketing and Revenue Management | ||
| Cyber-Security and Safety | ||
| By Rail Type | Passenger Rail | |
| Freight Rail | ||
| Urban Transit / Metro / LRT | ||
| High-Speed Rail | ||
| By Service | Professional Services | |
| Managed Services | ||
| Support and Maintenance | ||
| By Deployment Mode | On-Premise | |
| Cloud | ||
| Hybrid | ||
| By Geography | North America | United States |
| Canada | ||
| Mexico | ||
| South America | Brazil | |
| Argentina | ||
| Rest of South America | ||
| Europe | Germany | |
| United Kingdom | ||
| France | ||
| Italy | ||
| Spain | ||
| Russia | ||
| Rest of Europe | ||
| Asia-Pacific | China | |
| Japan | ||
| South Korea | ||
| India | ||
| Australia and New Zealand | ||
| Rest of Asia-Pacific | ||
| Middle East | GCC | |
| Turkey | ||
| Rest of Middle East | ||
| Africa | South Africa | |
| Rest of Africa | ||


Key Questions Answered in the Report
How large will global spending on smart railways reach by 2031?
The smart railways market is forecast to reach USD 87.45 billion by 2031.
What is the projected CAGR for smart railway investments from 2026 to 2031?
Spending is expected to rise at a compound annual growth rate of 12.7% during the forecast period.
Which region leads current smart railway revenue?
Asia-Pacific generated 41.53% of global revenue in 2025 thanks to large Chinese and Indian programs.
Which rail type is growing fastest in digital adoption?
High-Speed Rail shows the highest momentum with a 13.34% CAGR to 2031.
Why are hybrid deployments gaining traction inside rail IT architectures?
Regulators require safety-critical logs to stay on-premise for reliability, while analytics workloads benefit from cloud elasticity, driving a hybrid split-plane approach.
Which service model is taking share from traditional professional services?
Managed Services are rising 13.23% annually as operators offload cyber-security and uptime guarantees to vendors.
Page last updated on:


