Smart Greenhouse Market Size and Share
Market Overview
| Study Period | 2020 - 2031 |
|---|---|
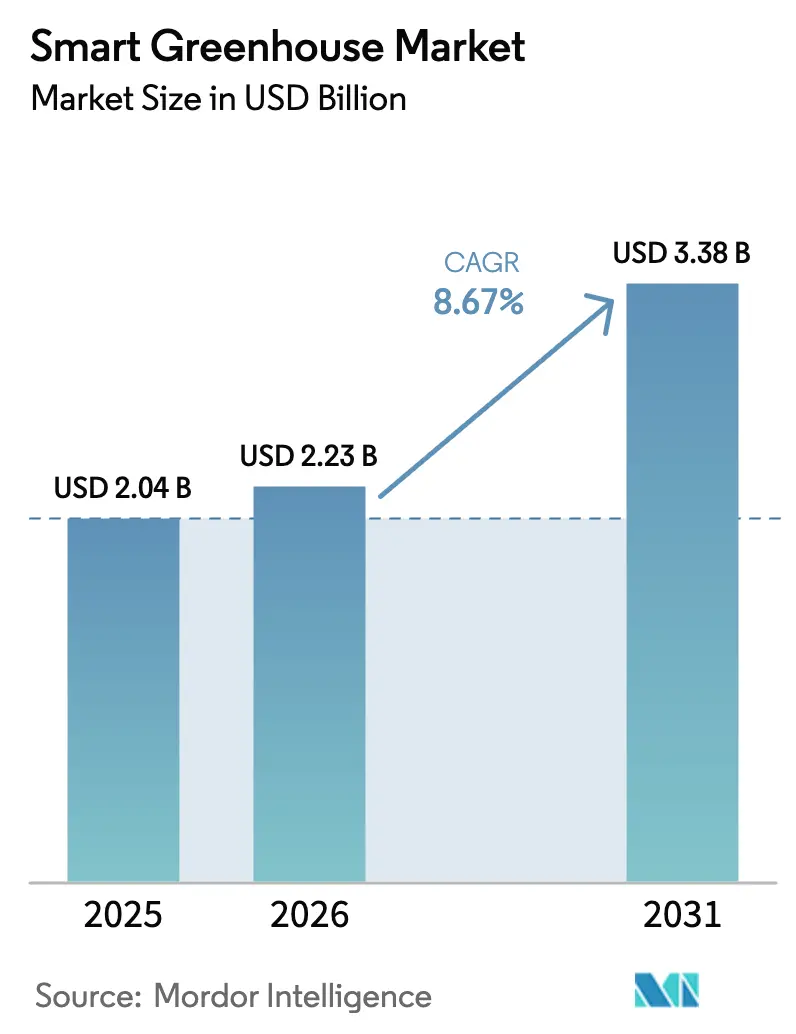
| Market Size (2026) | USD 2.23 Billion |
| Market Size (2031) | USD 3.38 Billion |
| Growth Rate (2026 - 2031) | 8.67% CAGR |
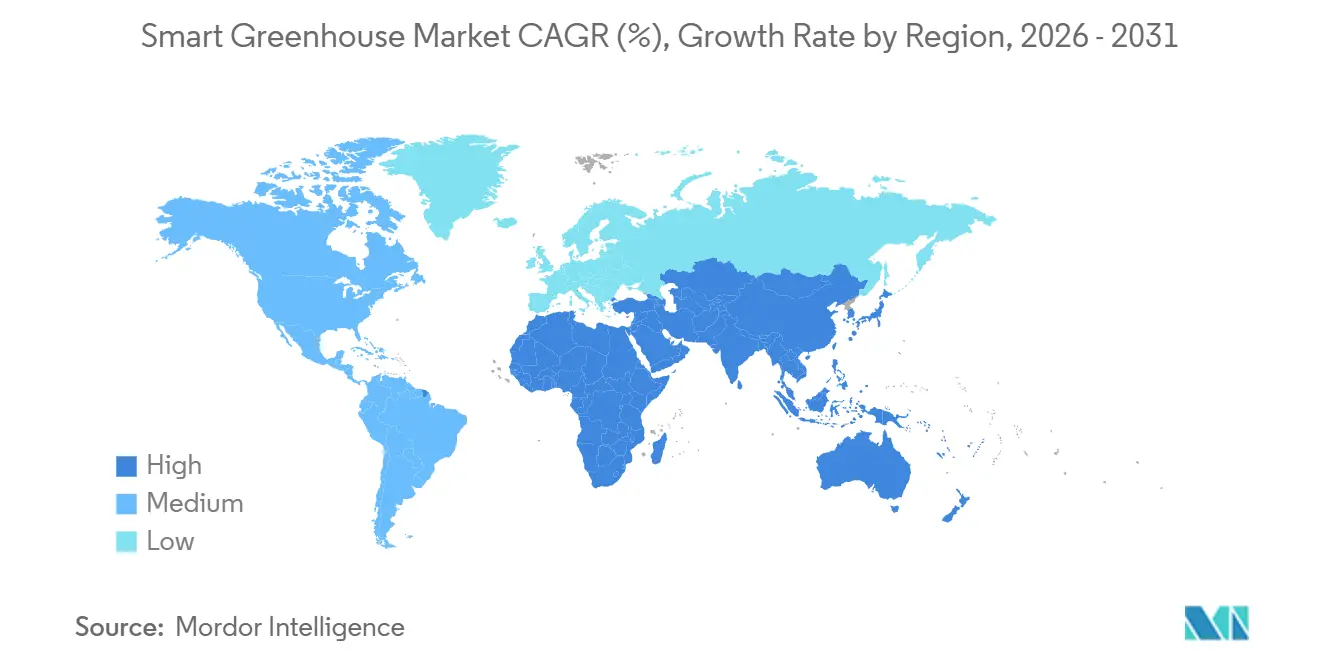
| Fastest Growing Market | Asia Pacific |
| Largest Market | North America |
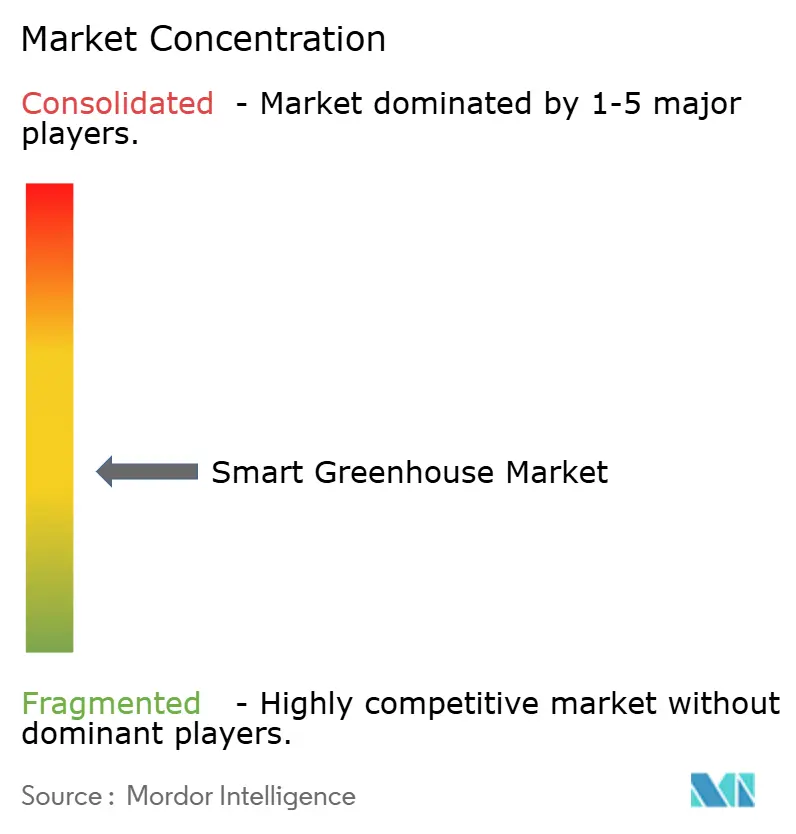
| Market Concentration | Medium |
Major Players *Disclaimer: Major Players sorted in no particular order Image © Mordor Intelligence. Reuse requires attribution under CC BY 4.0. | |
Smart Greenhouse Market Analysis by Mordor Intelligence
The Smart Greenhouse Market size was valued at USD 2.04 billion in 2025 and is estimated to grow from USD 2.23 billion in 2026 to reach USD 3.38 billion by 2031, at a CAGR of 8.67% during the forecast period (2026-2031).
Rising climate volatility, tightening food-security targets, and the proven water-use efficiency of hydroponics continue to steer investment toward controlled-environment facilities powered by sensors, LED grow lights, and cloud analytics. Digital control systems that orchestrate lighting, fertigation, and HVAC are moving from optional add-ons to core infrastructure, while finance models that bundle hardware, software, and agronomic support are lowering entry barriers for mid-sized operators. Regional subsidies tied to pesticide reduction and carbon-credit eligibility reinforce demand in Europe, North America, and Asia Pacific. Competitive dynamics are moderate, with systems integrators, component specialists, and software start-ups all vying for technical differentiation.
Key Report Takeaways
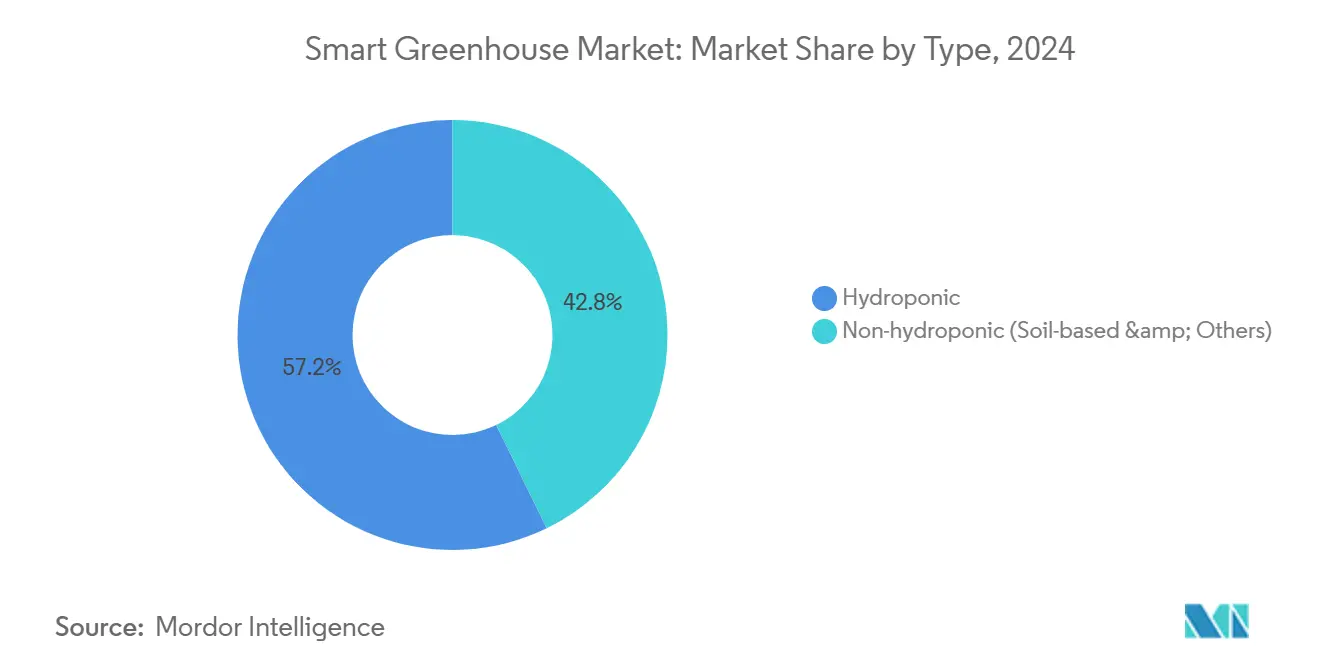
- By type, hydroponics captured 57.23% of smart greenhouse market share in 2025 and is expected to grow at a 9.79% CAGR through 2031.
- By technology, control systems and analytics platforms are projected to post the fastest growth at a 10.31% CAGR to 2031.
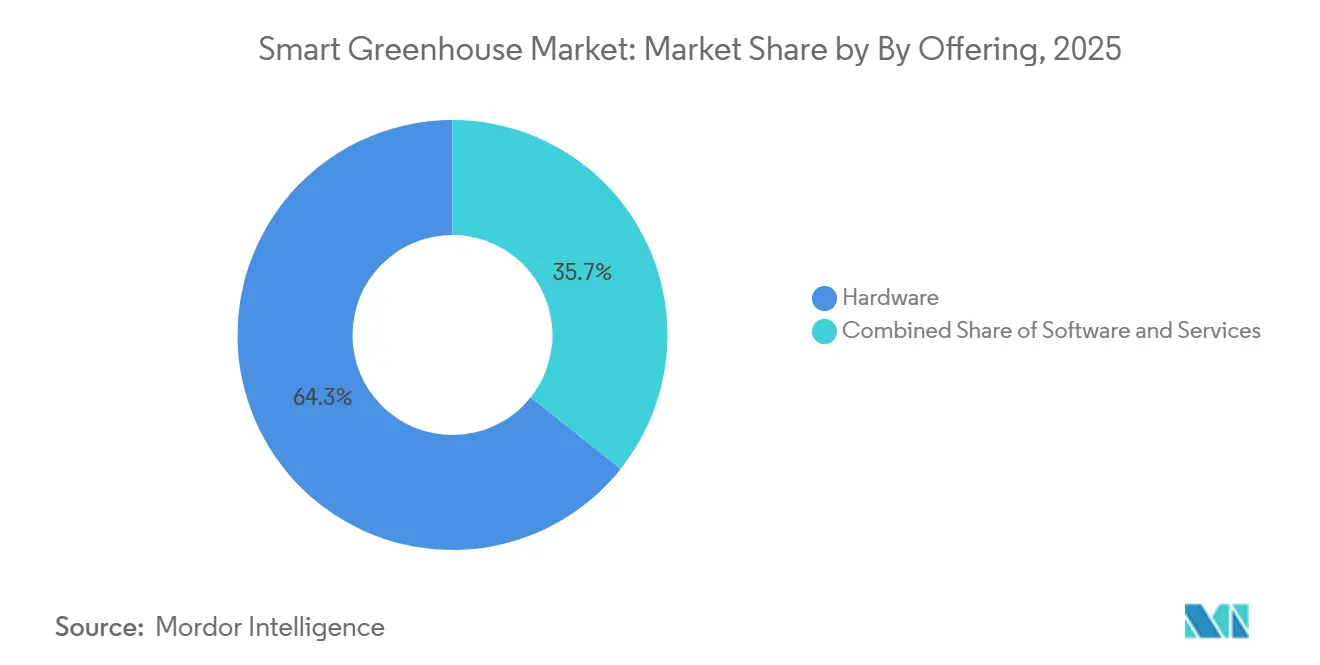
- By offering, software revenue is advancing at a 10.13% pace, outstripping the overall smart greenhouse market CAGR.
- By end-user, commercial growers held 52.31% share of the smart greenhouse market size in 2025, while urban and vertical farms are expanding at 9.95% CAGR to 2031.
- By geography, Asia Pacific is forecast to lead growth at a 10.53% CAGR to 2031, even though North America accounted for 34.79% revenue in 2025.
Note: Market size and forecast figures in this report are generated using Mordor Intelligence’s proprietary estimation framework, updated with the latest available data and insights as of January 2026.
Global Smart Greenhouse Market Trends and Insights
Drivers Impact Analysis*
| Driver | (~) % Impact on CAGR Forecast | Geographic Relevance | Impact Timeline |
|---|---|---|---|
| Rapid IoT and AI Integration in Controlled-Environment Agriculture | +2.10% | Global, with early adoption in North America and Europe | Medium term (2-4 years) |
| Escalating Demand for Pesticide-Free Produce | +1.80% | North America, Europe, Asia Pacific urban centers | Short term (≤ 2 years) |
| Population-Driven Food-Supply Gap | +1.50% | Asia Pacific, Middle East, Africa | Long term (≥ 4 years) |
| Urban-Centric Vertical-Farming Investments | +1.30% | Asia Pacific, North America urban corridors | Medium term (2-4 years) |
| Solar-Powered Greenhouse Micro-Grids Slash Operating Costs | +1.00% | Middle East, Australia, Southern Europe | Medium term (2-4 years) |
| Carbon-Credit Programmes Rewarding CEA Efficiency | +0.80% | Europe, North America, select Asia Pacific markets | Long term (≥ 4 years) |
| Source: Mordor Intelligence | |||
Rapid IoT and AI Integration in Controlled-Environment Agriculture
Edge-processed sensor data now enables sub-minute climate adjustments, materially lowering crop-stress episodes and labour inputs. Argus Control Systems’ Axia platform, operational since 2025, demonstrates how on-premises analytics reduce network latency and energy peaks.[1]Argus Control Systems, “Axia Platform,” arguscontrols.com Priva’s Connected installations surpassed 500 commercial sites by late 2025, combining weather-based forecasting with fertigation algorithms that cut water use by 30%.[2]Priva, “Connected Platform,” priva.com The International Energy Agency quantified a 15-25% greenhouse gas energy saving from AI-driven optimization in its 2025 assessment. These gains arrive alongside rising cybersecurity awareness; an IEEE study in 2025 highlighted unencrypted sensor gateways as a growing risk vector. Growers now segment operational-technology networks and adopt ISO 27001 controls, strengthening the long-term attractiveness of data-centric platforms.
Escalating Demand for Pesticide-Free Produce
Retail buyers in the United States, Germany, and France are prioritizing pesticide-free certification as residue-testing coverage widens. Controlled-environment agriculture can virtually eliminate soil-borne pathogens, aligning with the European Union mandate to halve chemical pesticide application by 2030.[3]European Commission, “Sustainable Use of Pesticides Directive,” europa.eu The Food and Agriculture Organization confirmed near-zero pesticide profiles for hydroponic lettuce, tomato, and strawberry crops in its 2024 technical note. Supermarkets refine category margins by positioning greenhouse vegetables as premium, gaining 20-40% price uplift versus field-grown equivalents. Urban centers where farmers’ markets are scarce further accelerate this trend, sustaining premium elasticity despite broader inflationary pressure.
Population-Driven Food-Supply Gap
United Nations projections put world population at 9.7 billion by 2050, while arable land per capita contracts. Wageningen University showed that a single hectare of hydroponic greenhouse yields up to 20× the lettuce output of open-field cultivation. Governments in water-scarce regions respond accordingly: the United Arab Emirates mobilized USD 272 million in 2025 to underwrite desalination-integrated greenhouses targeting 30% domestic vegetable self-sufficiency by 2030. Similar supply-gap anxieties propel investments across Saudi Arabia and India, where post-harvest losses remain elevated.
Urban-Centric Vertical-Farming Investments
City administration views rooftop and warehouse farms as climate-resilient infrastructure that shrinks transport emissions by up to 70%. Japan already operates more than 400 plant factories clustered around Tokyo and Osaka, supplying convenience retailers with same-day lettuce. Signify’s GrowWise research facility validated LED efficacy gains of 2.5 µmol J-¹ in 2025, helping vertical installations achieve grid parity in high-electricity markets. Municipal zoning incentives in Singapore and San Francisco now streamline conversions of under-utilized industrial real estate, though elevated capex still confines large projects to well-capitalized sponsors.
Restraints Impact Analysis*
| Restraint | (~) % Impact on CAGR Forecast | Geographic Relevance | Impact Timeline |
|---|---|---|---|
| High Upfront Capital Expenditure for Smart Facilities | -1.20% | Global, particularly acute in emerging markets | Short term (≤ 2 years) |
| Scarcity of Greenhouse-Automation Talent | -0.90% | North America, Europe, Asia Pacific | Medium term (2-4 years) |
| Battery-Supply Volatility for Off-Grid Systems | -0.50% | Middle East, Africa, remote regions | Medium term (2-4 years) |
| Edge-Device Cybersecurity Vulnerabilities | -0.40% | Global, with higher risk in markets with weak IT infrastructure | Short term (≤ 2 years) |
| Source: Mordor Intelligence | |||
High Upfront Capital Expenditure for Smart Facilities
Fully automated smart greenhouses cost as much as USD 1,500 per square meter once HVAC, LEDs, fertigation, and analytics are included. Traditional lenders hesitate in emerging markets where payback periods stretch beyond seven years. The International Finance Corporation highlighted lease-to-own contracts and revenue-sharing structures as alternate pathways but noted that supportive legal frameworks remain patchy. Energy intensity adds further uncertainty; a temperate-zone hectare may draw 300 MWh annually, exposing growers to volatile tariff regimes.
Scarcity Of Greenhouse-Automation Talent
Modern facilities demand technicians fluent in horticulture, networking, and data science, a skills cocktail that remains sparse. Dutch employers reported a 25% vacancy rate for such profiles in 2025, prompting Wageningen University to open a two-year vocational track that has yet to match demand. North American community colleges launched certificate programs in 2025, but graduate migration into data-center roles erodes retention. Vendors increasingly offer remote diagnostics yet add 10-15% to operating overhead when doing so.
*Our forecasts treat driver/restraint impacts as directional, not additive. The impact forecasts reflect baseline growth, mix effects, and variable interactions.
Segment Analysis
By Type: Hydroponics Dominates as Water Scarcity Intensifies
Hydroponic configurations accounted for 57.23% of the smart greenhouse market share in 2025, reflecting their ability to recycle up to 90% of irrigation water in desert and Mediterranean climates. The smart greenhouse market size for hydroponic systems is projected to widen at a 9.79% CAGR through 2031 on the back of subsidies in the Middle East and Southern Europe. Netafim reported 12,000 hectares of hydroponic deployments worldwide by the end of 2025, with particularly swift uptake in the United Arab Emirates where water costs exceed USD 2 per m³. Soil-based and hybrid models persist in organic-certified farms and research institutes analyzing soil microbiomes, yet they incur higher hand-weeding and pest-management bills. Aeroponics, which suspends roots in nutrient mist, promises an incremental 25% water saving but remains niche due to equipment complexity and elevated power draw.
Hydroponic adoption also benefits from reduced regulatory burden. Under the European Union Sustainable Use of Pesticides Directive, closed-loop nutrient systems enjoy simplified reporting obligations compared with soil cultivation, trimming compliance costs. In parallel, venture capital directed toward aeroponic and aquaponic start-ups exceeded USD 200 million in 2025, signalling investor confidence that water-centric formats will underpin the next wave of high-density urban production.


By Technology: Control Systems Surge as Data Becomes Differentiator
LED grow lights captured 38.56% of technology revenue in 2025, yet the strongest growth to 2031 will stem from control systems and analytics platforms, projected at 10.31% CAGR. The smart greenhouse market size attached to decision-support software has expanded as growers digitize pest-scouting, weather forecasting, and energy management. Priva’s Blue ID controller links climate sensors, fertigation pumps, and smart meters under a single dashboard and trimmed disease-related crop loss by 18% in Dutch trials. Meanwhile, Signify’s tuneable-spectrum LEDs lifted tomato yields by 12% in Wageningen University tests, illustrating hardware’s continual but incremental impact. Robotics for transplanting and harvesting remain at pilot stage yet promise labour savings once unit costs fall below USD 45,000 per robot.
A convergent trend sees growers embracing standardized communication protocols such as MQTT and OPC-UA, which allow plug-and-play integration of disparate sensors, HVAC drives, and lighting arrays. As interoperability grows, the competitive edge shifts from individual components to the cohesiveness of the full data loop, reinforcing the premium placed on robust analytics suites.
By Offering: Software Gains as Growers Seek Predictive Insights
Hardware retained 64.29% revenue in 2025, but software is advancing at a 10.13% pace, driven by predictive yield models and resource-optimization tools. Motorleaf’s AI platform predicts harvest timing with 95% accuracy for leafy greens, helping growers align labour and fulfilment slots while cutting waste. Autogrow’s subscription bundles spread capital costs over multiyear operating budgets, a structure increasingly mirrored by sensor and LED vendors.
Services revenue keeps pace as growers outsource calibration, firmware updates, and compliance reporting. Data cooperatives have emerged, with anonymized datasets feeding machine-learning models that detect pest emergence days before visible symptoms. Concerns about data sovereignty persist, particularly in Europe, where growers demand clear contractual clauses enumerating ownership and permitted usage.
By End-User: Urban Farms Accelerate Despite Commercial Dominance
Large commercial growers in the Netherlands, Canada, and California controlled 52.31% of 2025 revenue, supplying retailers with consistent tomato and pepper volumes year-round. Their scale absorbs fixed costs and secures energy discounts through co-generation agreements. Research institutes, while minor in revenue terms, validate autonomous growing techniques that disseminate into commercial practice.
The smart greenhouse market size tied to urban and vertical farms is set to climb at 9.95% CAGR, bolstered by Singapore’s 30-by-30 agenda and municipal grants across Seoul, Tokyo, and New York. Converting vacant warehouses mitigates land scarcity but introduces cooling loads that can surpass 450 W m-² during summer heatwaves, necessitating tri-generation or waste-heat recovery solutions to protect margins.
Geography Analysis
Asia Pacific will pace global expansion with a 10.53% CAGR to 2031, propelled by China’s CNY 10 billion subsidy program for peri-urban smart greenhouses. Japan supplies 15% of domestic lettuce demand via plant factories situated within metropolitan rings, while India incentivizes polyhouse upgrades through the National Horticulture Mission.
North America, holding 34.79% revenue in 2025, benefits from cannabis legalization and consumer preference for locally grown vegetables. The United States Department of Agriculture documented an 18% uptick in controlled-environment acreage from 2022-2025. Canada’s CAD 50 million (USD 37 million) Greenhouse Innovation Fund supports heat-recovery retrofits aimed at cutting natural-gas use by 25% by 2030.
Europe’s mature supply chains center on the Netherlands, which exported EUR 9.2 billion (USD 10.1 billion) in greenhouse produce during 2024. Energy-price volatility after 2025 accelerated the adoption of geothermal wells and heat-storage aquifers. South America’s growth is moderate, led by Brazilian and Argentine operators battling erratic rainfall. The Middle East and Africa remain smaller yet strategically vital: Saudi Arabia’s National Center for Agriculture Technologies is piloting solar-desalination greenhouses to cut water usage below 5 L kg-¹ of produce.

Competitive Landscape
The smart greenhouse market remains moderately fragmented, with no single vendor exceeding a 10% revenue footprint. Full-service integrators such as Priva, Kubo, and Certhon compete on turnkey project execution, covering design, construction, and commissioning across multi-hectare footprints. Component specialists like Signify for LED lighting and Netafim for precision irrigation partner broadly, embedding their modules into rival integrators’ blueprints to maximize downstream pull-through. Software-first entrants Motorleaf, Autogrow, and others differentiate via predictive analytics and subscription models that lower switching costs.
Patent activity underscores the technology arms race. Argus Control Systems filed four patents over 2024-2025 covering edge-based algorithms that trim HVAC energy by up to 18% in variable climates. Signify’s far-red LED research shortened ornamental crop cycles by 10 days, a breakthrough improving capital turnover. Financing innovation is comparatively nascent, yet vendors are trialing lease-to-own and performance-based contracts that align repayment to crop yield or energy savings. Compliance standards tighten: UL certification is prerequisite for North American HVAC controllers, while CE marking remains compulsory in Europe.
Supply-chain security has risen on the strategic agenda. Semiconductor shortages during 2024-2025 delayed sensor shipments, prompting integrators to pre-allocate inventories and redesign boards for multi-vendor components. Cybersecurity modules rolled out by Argus in 2025 encrypt device traffic, satisfying insurance underwriters that now demand evidence of network segmentation before writing aggrotech policies.
Smart Greenhouse Industry Leaders
Heliospectra AB
Prospiant, Inc.
Cultivar Greenhouse Ltd
Kubo Greenhouse Projects B.V.
Certhon Group
- *Disclaimer: Major Players sorted in no particular order

Recent Industry Developments
- January 2026: Signify announced a EUR 25 million (USD 27.5 million) expansion of its GrowWise Center in the Netherlands, adding 2,000 m² of research space focused on LED spectra for vertical farming.
- December 2025: Netafim won an USD 18 million deal to furnish precision irrigation for a 50-hectare hydroponic greenhouse in Saudi Arabia, part of the kingdom’s self-sufficiency initiative.
- November 2025: Priva migrated its Connected platform to Microsoft Azure, enabling cross-site data synchronization for growers operating multiple facilities.
- October 2025: Heliospectra released the modular LX60 LED fixture, allowing diode-level replacements that cut lifetime maintenance costs by an estimated 30%.


Research Methodology Framework and Report Scope
Market Definitions and Key Coverage
Our study defines the smart greenhouse market as the annual revenue generated from technologically enabled greenhouse structures, hydroponic or soil-based, that use sensors, HVAC, LED grow lights, control software, and connected services to automate climate, irrigation, and nutrition for food or ornamental crops.
Scope exclusion: backyard hobby greenhouses and single-function shade houses are not included.
Segmentation Overview
- By Type
- Hydroponic
- Non-Hydroponic (Soil-Based and Others)
- By Technology
- LED Grow Lights
- HVAC and Climate Control
- Material Handling and Robotics
- Control Systems and Analytics Platforms
- Other Technologies
- By Offering
- Hardware
- Software
- Services (Integration, Maintenance, Training)
- By End-User
- Commercial Growers
- Research and Academic Institutes
- Retail/Community Gardens
- Urban/Vertical Farms
- By Geography
- North America
- United States
- Canada
- Mexico
- South America
- Brazil
- Argentina
- Rest of South America
- Europe
- United Kingdom
- Germany
- France
- Italy
- Spain
- Rest of Europe
- Asia Pacific
- China
- Japan
- India
- South Korea
- Australia
- Rest of Asia Pacific
- Middle East and Africa
- Middle East
- Saudi Arabia
- United Arab Emirates
- Turkey
- Rest of Middle East
- Africa
- South Africa
- Egypt
- Nigeria
- Rest of Africa
- Middle East
- North America
Detailed Research Methodology and Data Validation
Primary Research
Mordor analysts interviewed agronomists, project engineers, equipment distributors, and urban-farm operators across North America, Europe, and Asia Pacific. These conversations validated penetration rates, energy cost sensitivities, and likely subsidy uptake that desktop work alone could not confirm.
Desk Research
We began with open data from USDA-NASS, FAO FAOSTAT, Eurostat crop production files, and UN Comtrade trade codes to size fruit and vegetable output moving into controlled environment farms. Trade association material from the International Society for Horticultural Science, the AmericanHort Knowledge Center, and Japan Greenhouse Horticulture Association helped us profile acreage shifts, typical hardware refresh cycles, and regional subsidy rules.
Company 10-Ks, investor decks, and press releases supplied average selling prices for LED arrays, climate units, and automation software, while patent analytics from Questel revealed innovation intensity by component. News flows captured through Dow Jones Factiva rounded out competitive moves. The sources listed are illustrative; many additional publications, datasets, and regulatory notes were consulted for cross-checks.
Market-Sizing & Forecasting
A single top-down build starts with national protected crop hectares, then applies smart technology penetration and weighted hardware plus service ASPs; selective supplier roll-ups and channel checks act as bottom-up guardrails. Key variables include greenhouse floor space commissioned each year, share of hydroponic systems, median LED fixture density, regional electricity tariffs, and yield-linked price premiums. Forecasts use ARIMA models augmented by multivariate scenario analysis, with parameter ranges fine-tuned through expert consensus. Gaps in granular shipment data are bridged with proxy indicators such as import value of climate modules and capital expenditure ratios reported by listed growers.
Data Validation & Update Cycle
All outputs pass a multi-step review: variance scans against historical patterns, peer review inside the ag-tech team, and a final analyst sign-off. Reports refresh every twelve months, and we trigger mid-cycle updates when policy shifts or major capacity additions materially alter the baseline.
Why Mordor's Smart Greenhouse Baseline Commands Reliability
Published figures often diverge because firms vary the crop mix they count, assume different speed to adoption curves, or freeze exchange rates at separate points.
Our discipline in aligning scope to connected, multi-sensor structures and in refreshing assumptions yearly keeps our numbers decision ready.
Benchmark comparison
| Market Size | Anonymized source | Primary gap driver |
|---|---|---|
| USD 2.24 B (2025) | Mordor Intelligence | - |
| USD 1.88 B (2024) | Global Consultancy A | Excludes software and post-installation services |
| USD 1.97 B (2024) | Regional Consultancy B | Uses constant 2020 ASPs, ignoring LED price decline |
| USD 2.29 B (2024) | Trade Journal C | Counts only North America and Europe, then extrapolates globally |
Taken together, the comparison shows how scope rigor, timely pricing inputs, and annual refresh cadence enable Mordor Intelligence to deliver a balanced, transparent baseline that clients can trace back to clear variables and repeatable steps.


Key Questions Answered in the Report
How large is the smart greenhouse market in 2026?
The smart greenhouse market size stands at USD 2.23 billion in 2026.
What is the projected growth rate through 2031?
The market is forecast to expand at a 8.67% CAGR, reaching USD 3.38 billion by 2031.
Which technology segment is growing fastest?
Control systems and analytics platforms are set to post a 10.31% CAGR, the quickest in the category.
Why are hydroponic systems preferred?
Hydroponics recirculates nutrients, cutting water use by up to 90% and capturing 57.23% smart greenhouse market share in 2025.
Which region will lead future growth?
Asia Pacific is forecast to grow at 10.53% CAGR on the back of subsidies in China, Japan, and India.
What is the main adoption barrier?
High capital expenditure up to USD 1,500 per square meter for fully automated facilities remains the leading constraint.
Page last updated on:


