Market Overview
| Study Period | 2021 - 2031 |
|---|---|
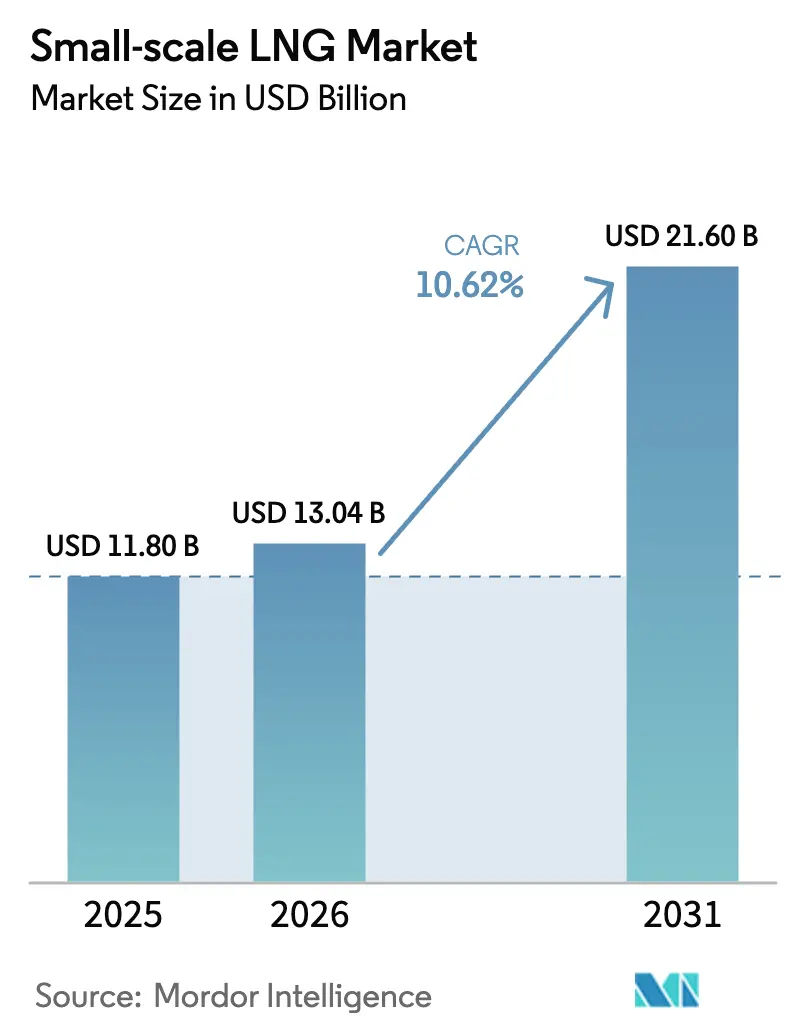
| Market Size (2026) | USD 13.04 Billion |
| Market Size (2031) | USD 21.60 Billion |
| Growth Rate (2026 - 2031) | 10.62% CAGR |
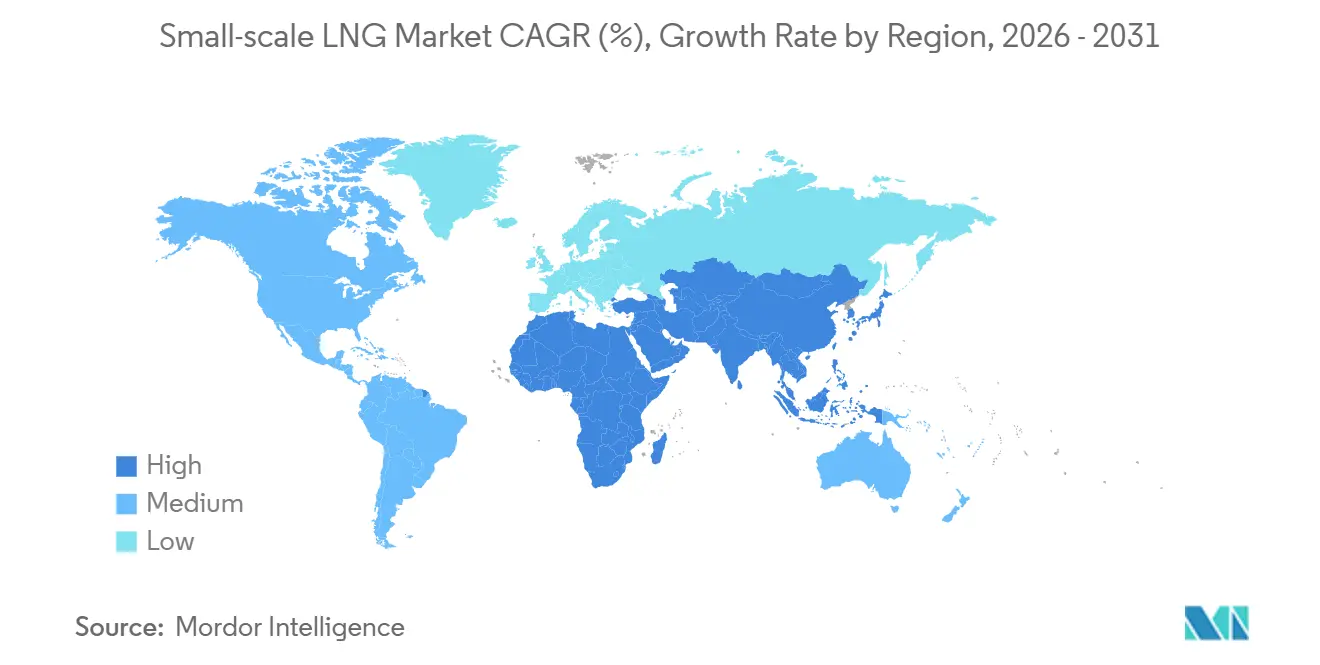
| Fastest Growing Market | Asia Pacific |
| Largest Market | Asia Pacific |
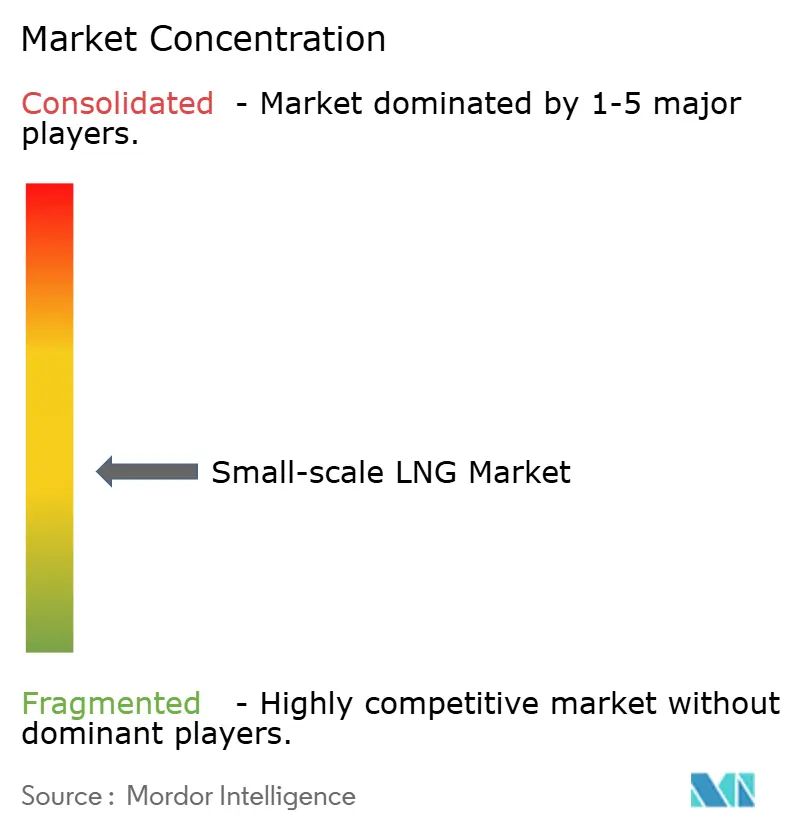
| Market Concentration | Medium |
Major Players *Disclaimer: Major Players sorted in no particular order Image © Mordor Intelligence. Reuse requires attribution under CC BY 4.0. | |
Small-scale LNG Market Analysis by Mordor Intelligence
The Small-scale LNG Market size is expected to increase from USD 11.80 billion in 2025 to USD 13.04 billion in 2026 and reach USD 21.60 billion by 2031, growing at a CAGR of 10.62% over 2026-2031.
Rising preference for modular gas infrastructure, the enforcement of stricter maritime-emission rules, and growing interest in LNG-to-power solutions for remote grids underpin this expansion. Liquefaction plants that monetize stranded gas, floating storage and regasification units (FSRUs) that bypass lengthy onshore construction, and LNG bunkering networks serving dual-fuel ships collectively reinforce the small-scale LNG market’s momentum. Policy incentives such as the U.S. Inflation Reduction Act’s fuel credits and China’s “Blue Corridor” trucking program further diversify demand, while technology advances in micro-liquefaction and boil-off mitigation keep operating costs competitive. Companies that integrate liquefaction, logistics, and end-use applications capture higher margins and dilute price volatility risks.
Key Report Takeaways
- By type, liquefaction terminals led with 62.3% of the small-scale LNG market share in 2025; regasification terminals are forecast to expand at a 14.4% CAGR through 2031.
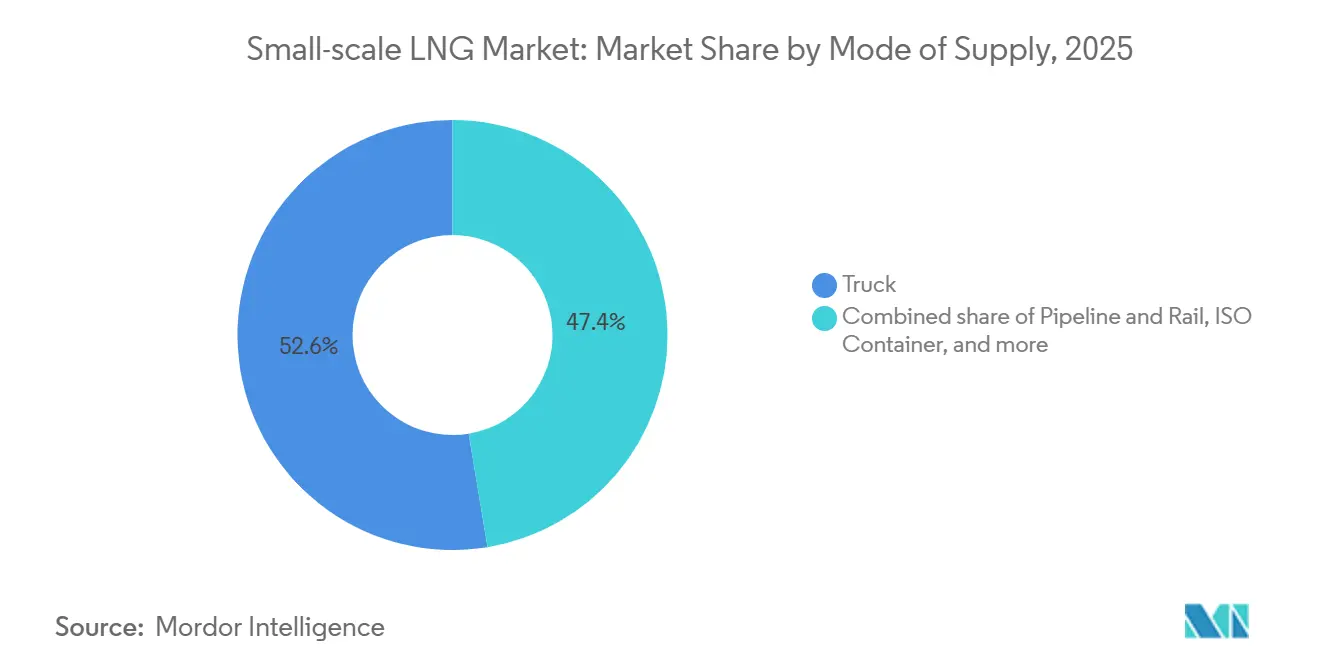
- By mode of supply, truck delivery held a 52.6% share of the small-scale LNG market size in 2025, while transshipment and bunkering are advancing at a 14.7% CAGR to 2031.
- By application, transportation accounted for a 42.0% share of the small-scale LNG market size in 2025, and power generation is tracking a 14.1% CAGR through 2031.
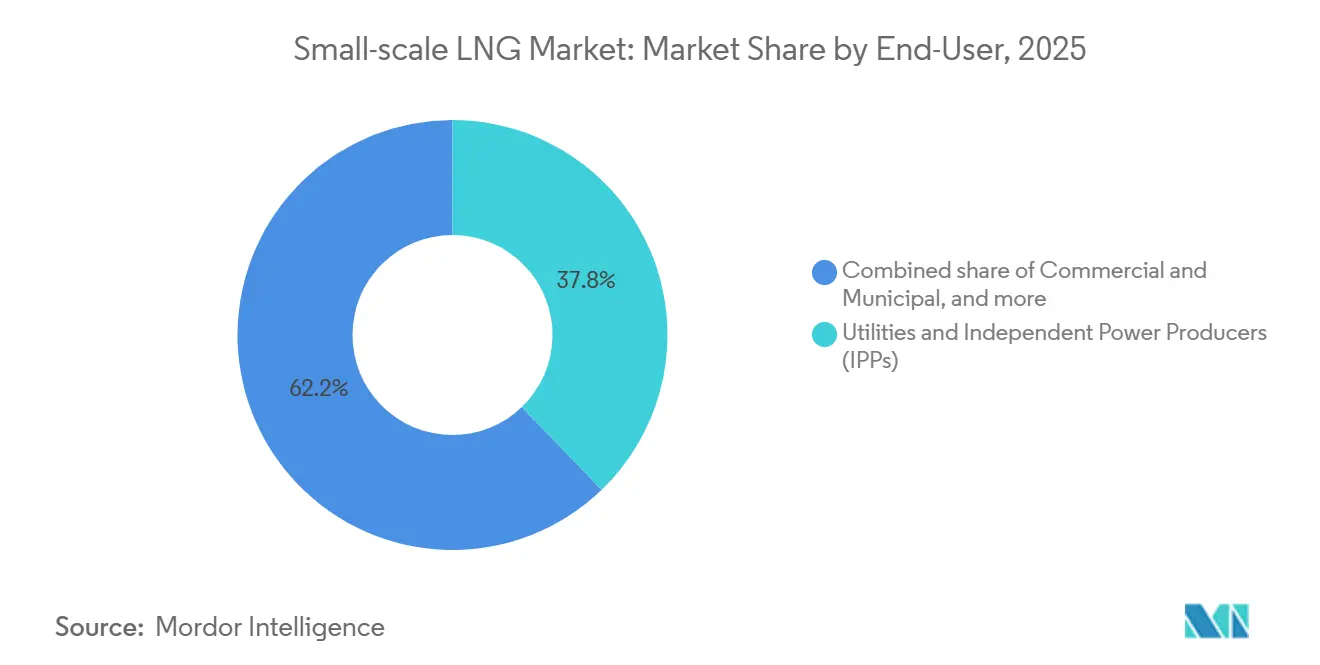
- By end-user, utilities and IPPs held 37.8% of the small-scale LNG market share in 2025, whereas commercial and municipal users are expanding at a 15.4% CAGR up to 2031.
- By geography, Asia-Pacific led with 47.9% revenue share in 2025 and maintains the fastest growth trajectory at 15.9% CAGR through 2031.
Note: Market size and forecast figures in this report are generated using Mordor Intelligence’s proprietary estimation framework, updated with the latest available data and insights as of January 2026.
Global Small-scale LNG Market Trends and Insights
Drivers Impact Analysis*
| Driver | (~) % Impact on CAGR Forecast | Geographic Relevance | Impact Timeline |
|---|---|---|---|
| Tightening IMO & FuelEU Maritime Sulphur Caps Accelerating Marine LNG Bunkering Adoption | 2.1% | Europe, Asia-Pacific (Singapore, China, South Korea) | Short term (≤ 2 years) |
| Rapid Build-out of Modular Liquefaction Plants for Remote Mining & Off-Grid Power | 1.8% | Asia-Pacific (Australia, Indonesia), Middle East & Africa | Medium term (2-4 years) |
| Heavy-Duty Truck Fleet Shift to LNG in China's "Blue Corridor" Program | 1.5% | China, with spillover to Central Asia | Medium term (2-4 years) |
| Caribbean & Central-American Micro-grid Conversions to LNG-to-Power | 0.9% | Caribbean, Central America (Jamaica, Dominican Republic, Panama) | Long term (≥ 4 years) |
| Tax Incentives for Small-Scale LNG Equipment under US Inflation Reduction Act | 1.2% | United States | Short term (≤ 2 years) |
| Nordic LNG Bus & Ferry Subsidy Schemes Driving Demand for Bunkering | 0.6% | Nordic Countries (Norway, Sweden, Finland) | Short term (≤ 2 years) |
| Source: Mordor Intelligence | |||


Tightening IMO And FuelEU Maritime Sulphur Caps Accelerating Marine LNG Bunkering Adoption
The IMO’s 0.50% global sulphur limit and the European Union’s FuelEU Maritime greenhouse-gas rules are tilting bunker-fuel economics toward LNG. Shipowners can avoid multi-million-dollar scrubber retrofits and simultaneously reduce CO₂, SOₓ, and particulate emissions by shifting to LNG propulsion. The global LNG bunker fleet reached 61 vessels by late 2024, with Northwest Europe, the Mediterranean, and Asia hosting the largest clusters.[1]SEA-LNG, “Global LNG Bunkering Vessel Inventory,” sea-lng.org TotalEnergies opened a dedicated bunkering terminal at Oman’s Port of Duqm in 2024 to serve ships transiting the Arabian Sea. FuelEU Maritime’s requirement to account for methane slip is spurring engine makers to adopt high-pressure injection systems that cut unburned methane below 1%. These combined measures foster reliable infrastructure and regulatory certainty for the small-scale LNG market.
Rapid Build-out Of Modular Liquefaction Plants For Remote Mining And Off-Grid Power
Standardized micro and mini liquefiers allow stranded or associated gas to be monetized at capacities as low as 10,000 gallons per day without pipeline connections. Chart Industries’ IPSMR® process consumes under 0.35 kWh per kilogram of LNG, making off-grid sites viable even when power is supplied by on-site renewables or gensets.[2]Chart Industries, “IPSMR® Technology Overview,” chartindustries.com Australian mines use containerized LNG to displace diesel trucked over 1,000 km, cutting fuel logistics costs by 40%. Indonesia’s island geography relies on virtual pipelines that move ISO tanks from gas-rich islands to population centers, sidestepping multi-billion-dollar subsea lines. Boil-off remains a challenge for plants below 0.05 MTPA, but hybrid solutions, venting vapor to on-site generators, recover up to 80% of the gas’s value. As capital costs fall and off-grid demand rises, modular liquefaction underpins long-term growth in the small-scale LNG market.
Heavy-Duty Truck Fleet Shift To LNG In China’s “Blue Corridor” Program
China operated 1.2 million LNG-powered heavy-duty trucks and 4,000 refueling stations by 2024, demonstrating road transport’s capacity to absorb LNG volumes at scale.[3]China Energy Portal, “Blue Corridor LNG Trucking Statistics 2024,” chinaenergyportal.org Delivered LNG cost averaged CNY 4.2 per kg (USD 0.59 per kg), beating diesel by up to 25% on an energy basis and lowering fleet maintenance costs due to cleaner combustion. Phase II of the program targets 2 million trucks by 2030, leveraging provincial subsidies of up to CNY 50,000 per vehicle to cap payback at two years. Temporary price spikes during 2022–2023 narrowed the cost advantage, but stabilization below USD 12 per MMBtu restored momentum. With refueling networks maturing, trucking solidifies its role as a cornerstone of the small-scale LNG market.
Tax Incentives For Small-Scale LNG Equipment Under The U.S. Inflation Reduction Act
The 2022 Inflation Reduction Act created a USD 1.75 per-gallon-equivalent Clean Fuel Production Credit for low-carbon LNG and a 30% refueling-property credit capped at USD 100,000 per site. These provisions slash capital costs for micro-liquefiers processing landfill gas or agricultural digestate.[4]Internal Revenue Service, “Inflation Reduction Act Guidance,” irs.gov Section 45V’s hydrogen credit encourages the co-location of hydrogen and LNG liquefiers to share cryogenic assets. Chart Industries partnered with Earthly Labs in 2024 to roll out 50 micro-liquefaction units at breweries and ethanol plants that will qualify for the full credit. The incentives reposition the economics of small-scale projects from marginal to compelling, broadening the small-scale LNG market in North America.
Restraints Impact Analysis*
| Restraint | (~) % Impact on CAGR Forecast | Geographic Relevance | Impact Timeline |
|---|---|---|---|
| Sparse ISO-Tank Back-haul Logistics in Sub-Saharan Africa | -0.8% | Sub-Saharan Africa (excluding South Africa) | Long term (≥ 4 years) |
| High Boil-Off & Re-liquefaction Costs Below 0.05 MTPA Plants | -1.1% | Global, acute in remote sites (Asia-Pacific, Middle East) | Medium term (2-4 years) |
| Fragmented Permitting Framework for Mobile Liquefiers in Brazil | -0.6% | Brazil | Medium term (2-4 years) |
| Russia-Ukraine Conflict Raising Geopolitical Risk Premium on Spot LNG | -1.3% | Europe, Asia (import-dependent markets) | Short term (≤ 2 years) |
| Source: Mordor Intelligence | |||
Russia–Ukraine Conflict Raising Geopolitical Risk Premium On Spot LNG
The 2022 escalation cut 155 billion m³ of Russian pipeline gas to Europe, elevating LNG spot prices to USD 25 per MMBtu before moderating to USD 10–14 by late 2024. Small buyers in bunkering and municipal sectors struggle to secure long-term fixed-price contracts as suppliers push for spot-linked terms. Asian importers compete with Europe for cargoes, diverting supply from Southeast Asia and the Caribbean. Sanctions on Arctic LNG 2 removed 19.8 MTPA of expected output, emboldening other producers to maintain pricing discipline. Buyers are adding storage to buffer volatility, but tanks or small FSRUs raise capital needs by USD 50–100 million, eroding LNG’s cost edge over diesel. The resulting uncertainty tempers near-term growth in the small-scale LNG market.
High Boil-Off And Re-Liquefaction Costs Below 0.05 MTPA Plants
Micro-plants lose 0.1–0.3% of LNG daily to boil-off, translating into USD 200,000–600,000 annual losses at USD 12 per MMBtu. Re-liquefaction systems priced at USD 5–10 million consume 5–8% of plant output, viable only for capacities above 0.1 MTPA. Air Liquide’s membrane nitrogen-removal system, patented in 2024, cuts losses to 0.05% but adds USD 2 million and requires continuous operation. Some miners vent boil-off to power generators, reclaiming 70–80% of fuel value but facing stricter flaring rules in many jurisdictions. These economics deter investment in the 0.01–0.05 MTPA segment and constrain the small-scale LNG market, where volumes are modest.
*Our forecasts treat driver/restraint impacts as directional, not additive. The impact forecasts reflect baseline growth, mix effects, and variable interactions.
Segment Analysis
By Type: Liquefaction Leads, FSRUs Surge
Liquefaction terminals captured 62.3% of the small-scale LNG market in 2025, reflecting the need to monetize stranded gas assets economically. Many micro-plants operate below 0.1 MTPA and use high-efficiency IPSMR® technology to reach 90-plus% liquefaction yield. Small units serve biogas upgrading, flare-gas capture, and remote power, while mini and small plants feed export or regional hubs. Compliance with ISO 14001 adds environmental oversight but unlocks green financing. Capital intensity ranges between USD 400 and USD 800 per tonne of annual capacity, a threshold now attainable for frontier markets.
Regasification capacity is accelerating at a 14.4% CAGR to 2031. FSRUs like Höegh Esperanza and Höegh Gannet added 10 billion m³ per year to Germany’s grid within 18 months, bypassing five-year onshore timelines. The Philippines’ BW Mindanao FSRU feeds 5 MTPA into Luzon, enabling the retirement of 2,400 MW of coal. Vapor-recovery systems, required in emission-control areas, add USD 3–5 million but align with FuelEU methane rules. With day-rates between USD 80,000 and USD 150,000, leased FSRUs give buyers flexibility unmatched by fixed terminals, broadening the appeal of the small-scale LNG market.
By Mode of Supply: Trucks Dominate, Transshipment Accelerates
Truck delivery held a 52.6% share in 2025, anchored by China’s heavy-duty LNG fleet. A standard trailer hauls 20–25 tonnes, sufficient for a 5 MW boiler for two days, letting buyers dodge pipeline capacity charges. Hexagon Purus’s composite cylinders, introduced in 2024, cut trailer weight by 40%, enabling 28-tonne payloads on weight-restricted European routes. ISO containers support intermodal movements and cut handling costs by up to 30%.
Transshipment and bunkering are growing at a 14.7% CAGR as 18 new bunker vessels join the global fleet by 2027. Singapore licensed 12 bunkering operators in 2024, boosting volumes to 450,000 tonnes. Northwest Europe fields 29 bunker vessels that performed 1,200 ship calls in 2024. As sulfur and CO₂ limits tighten, ship-to-ship and shore-to-ship fueling solidify as fast-growing nodes in the small-scale LNG market.


By Application: Marine And Road Transport Lead, Power Generation Gains
Transportation applications held 42.0% of demand in 2025, driven by the 627 LNG-fueled ships on order and China’s trucking rollout. An LNG-powered truck saves 20–25% on fuel cost versus diesel while meeting China VI emission norms without after-treatment. The marine orderbook spans container ships, bulkers, and tankers, and dual-fuel engines virtually eliminate sulfur and particulate emissions.
Power generation for islanded grids is rising at a 14.1% CAGR. Jamaica’s 190 MW Bogue plant lowered electricity tariffs by 12% after switching to LNG. Pacific islands pursue similar conversions to offset diesel at USD 0.20–0.35 per kWh. Industrial feedstock consumers in fertilizer and petrochemicals add diversity, while data centers adopt LNG for backup power. As these niches expand, transportation’s share modestly declines, though absolute volumes rise in the small-scale LNG market.
By End-User: Utilities Lead, Commercial And Municipal Surge
Utilities and independent power producers (IPPs) controlled 37.8% of demand in 2025, exemplified by the Philippines’ retirement of 2.4 GW of coal in favor of LNG from BW Mindanao. Contracts often span 10–20 years, providing volume certainty. However, commercial and municipal users, city-gas networks, mining camps, and off-grid communities are growing at a 15.4% CAGR. Indonesia’s PGN reached 180,000 households in 2024 through LNG-based city gas, and Australian miners cut fuel bills by 35–40% by switching from diesel.
Oil companies liquefy associated gas to avoid flaring, and manufacturers adopt LNG to improve product quality in ceramics and glass. Contract tenors diverge: municipal buyers prefer 3–5 year deals with volume flexibility, compelling suppliers to balance portfolio risk. This fragmentation adds resilience and breadth to the small-scale LNG market.
Geography Analysis
Asia-Pacific owned 47.9% of the small-scale LNG market in 2025 and is growing at a 15.9% CAGR through 2031. China’s 1.2 million LNG trucks, Indonesia’s virtual pipelines supplying 12 new city-gas municipalities, and Australia’s remote mining demand anchor regional growth. Japan’s Sodegaura added truck-loading in 2024 to feed factories in Chiba, while India imported 80,000 tonnes via ISO tanks to reach states beyond pipeline corridors. Europe’s pipeline saturation curbs liquefaction investment, yet the region leads in bunkering and FSRUs. FuelEU Maritime penalties starting in 2025 push shipowners toward LNG, and 29 bunker vessels handled 1,200 calls in 2024. Germany’s four FSRUs replaced Russian gas volumes, keeping spot prices below EUR 40 per MWh. Nordic countries achieved a 22% bioLNG share in 2024, proving the pathway to carbon-negative shipping fuel.
North America leverages shale gas abundance and the Inflation Reduction Act credits. Chart Industries’ micro-liquefiers at breweries and ethanol plants qualify for USD 1.75 per gallon-equivalent incentives, while Canadian rail moves LNG to remote communities. Mexico’s 2024 reform opened import terminals to third parties, setting the stage for future growth. South America is nascent but active. New Fortress Energy’s floating liquefiers target Brazil’s pre-salt gas, and Argentina’s 0.5 MTPA plant will serve domestic and Chilean markets. Chile dispatches LNG to Atacama mines, saving Codelco USD 18 million annually. Colombia awarded a terminal concession on its Pacific coast to supply Buenaventura and Tumaco.
In the Middle East and Africa, the UAE and Qatar build domestic bunkering networks, while South Africa’s Coega FSRU serves the coastal industry. Mozambique’s Coral Sul exports LNG but plans 100,000 tonnes per year for regional ISO-tank distribution starting 2026. Nigeria’s virtual-pipeline concept awaits standardized ISO-tank rules. Kenya and Tanzania seek financing for import terminals but face credit hurdles.

Competitive Landscape
The small-scale LNG industry is moderately fragmented. Global majors such as Shell, TotalEnergies, Eni, and Equinor compete with focused developers like New Fortress Energy and Gasum. Equipment suppliers, Chart Industries, Wärtsilä, and Baker Hughes, capture margins through technology leadership. New Fortress Energy integrates liquefaction, ISO-tank logistics, and power-purchase agreements, maximizing margin capture. Chart Industries’ 2025 acquisition of Jiangsu Guofu added 120,000 m² of Chinese manufacturing space, cutting lead times for Asia-Pacific projects. Galileo Technologies deployed more than 200 micro-liquefiers worldwide, emphasizing speed over scale.
Patent filings in boil-off control and cryogenic tank design are rising; Air Liquide’s 2024 membrane solution trims daily losses to 0.05%. ISO 14001 certification and compliance with IMO’s IGF Code now influence tender pre-qualification, favoring firms with proven safety records. Sanctions on Russia’s Arctic LNG 2 removed supply, tightening global availability and supporting prices above USD 10 per MMBtu. Companies that secure diversified feedgas and end-user portfolios stand to gain in the evolving small-scale LNG market.
Small-scale LNG Industry Leaders
Shell plc
Linde plc
Wartsila Oyj Abp
TotalEnergies SE
New Fortress Energy LLC
- *Disclaimer: Major Players sorted in no particular order

Recent Industry Developments
- November 2025: OLT Offshore LNG Toscana has wrapped up its inaugural auctions for the newly introduced small-scale LNG (SSLNG) services. The auctions successfully allocated 12 monthly slots, each comprising 7500 liquid m3, spanning from November 2025 to November 2026.
- March 2025: Indonesia is pushing forward with a USD 1.5 billion project aimed at distributing small-scale LNG, with the goal of replacing diesel in power generation throughout its island regions. This initiative adopts a hub-and-spoke model: LNG hubs will feed smaller distribution centers scattered across the archipelago.
- January 2025: Nigerian National Petroleum Company (NNPC) and its partners broke ground on five mini-LNG facilities in Ajaokuta, Kogi State. With a combined investment of approximately USD 500 million, these facilities boast a daily capacity of 97 million standard cubic feet of gas.
- October 2024: ONGC issued tenders to establish mini-LNG plants at wellheads in Rajahmundry, Andhra Pradesh, as well as in Gujarat and Jharkhand. These plants aim to convert stranded gas, which isn't linked to pipelines, into liquid form for transportation.


Research Methodology Framework and Report Scope
Market Definitions and Key Coverage
Our study defines the small-scale LNG market as all liquefaction, storage, transportation, and regasification solutions with plant capacities below 1 million tons per annum or carrier capacities under 30,000 m³, delivering LNG to end points such as off-grid power plants, heavy-duty vehicles, and bunkering hubs.
Scope exclusion: equipment and vessels above these capacity thresholds fall outside this assessment.
Segmentation Overview
- By Type
- Liquefaction Terminal (Micro, Mini, and Small)
- Regasification Terminal (Onshore and Offshore FSRU)
- By Mode of Supply
- Truck
- Pipeline and Rail
- Transshipment and Bunkering (Ship-to-ship and Shore-to-ship)
- ISO Container
- By Application
- Transportation (Road and Marine Bunkering)
- Industrial Feedstock
- Power Generation
- Other Applications
- By End-User
- Utilities and Independent Power Producers (IPPs)
- Oil nd Gas Upstream Operators
- Manufacturing Industries
- Commercial and Municipal
- By Geography
- North America
- United States
- Canada
- Mexico
- Europe
- United Kingdom
- Germany
- France
- Spain
- Nordic Countries
- Russia
- Rest of Europe
- Asia-Pacific
- China
- India
- Japan
- South Korea
- Malaysia
- Thailand
- Indonesia
- Vietnam
- Australia
- Rest of Asia-Pacific
- South America
- Brazil
- Argentina
- Colombia
- Rest of South America
- Middle East and Africa
- United Arab Emirates
- Saudi Arabia
- Qatar
- Egypt
- South Africa
- Rest of Middle East and Africa
- North America
Detailed Research Methodology and Data Validation
Primary Research
Mordor analysts interviewed EPC contractors, plant operators, truck-fleet integrators, and port energy managers across Asia-Pacific, Europe, and the Americas. These discussions validated utilization rates, typical delivered-gas margins, and growth constraints; they also calibrated the assumptions that shaped scenario ranges in our model.
Desk Research
We began with open datasets from bodies such as the International Gas Union, the IMO, the U.S. Energy Information Administration, Eurostat customs flows, and China's General Administration of Customs, which map production, trade, and bunkering activity. Trade-association white papers, peer-reviewed journals on modular liquefaction, and port authority statistics then helped us size demand pools in marine and road transport. Financial filings, investor decks, and D&B Hoovers profiles supplied indicative selling prices and project CAPEX benchmarks. This foundation was enriched by news archives on Dow Jones Factiva for new terminal announcements. The sources listed are illustrative; many additional public records and databases informed the desk research phase.
Market-Sizing & Forecasting
A top-down construct starts with regional LNG production and import balances, which are resized through penetration-rate assessments for off-grid power, bunker fuel, and truck logistics. Select bottom-up checks, supplier roll-ups, and sampled average selling price × volumes serve as guardrails before totals are finalized. Key variables include plant build-out lead times, delivered LNG price spreads to diesel and marine gasoil, truck-fleet additions, port bunker uptake, and regulatory milestones such as FuelEU Maritime targets. Forecasts run on multivariate regression with scenario analysis, allowing price elasticity and policy shocks to shift growth trajectories while keeping base-case continuity intact.
Data Validation & Update Cycle
Outputs pass variance checks against IGU shipping tonnage, EIA trade tables, and port throughput statistics. An analyst peer review follows, and any anomaly triggers fresh calls to prior respondents. Reports refresh yearly, with interim revisions when policy or commissioning events materially change supply or demand.
Why Our Small-scale LNG Baseline Earns Trust
Published numbers vary because firms pick different capacity cut-offs, price assumptions, and refresh rhythms. According to Mordor Intelligence, disciplined scope and annual model rebuilds narrow these gaps and yield a figure decision-makers can rely on.
Key gap drivers include rival studies blending mid-scale assets up to 5 MTPA, assuming uniform delivered prices, or applying static penetration rates that ignore tightening marine-fuel rules.
Benchmark comparison
| Market Size | Anonymized source | Primary gap driver |
|---|---|---|
| USD 11.80 B | Mordor Intelligence | - |
| USD 22.14 B | Global Consultancy A | Includes liquefaction up to 3 MTPA and applies flat 7% bunkering margin |
| USD 31.16 B | Industry Association B | Uses headline project CAPEX rather than revenue, omits regional price differentials |
These comparisons show that Mordor's carefully bounded scope, blended top-down/bottom-up logic, and frequent validation deliver a balanced, transparent baseline that stays reproducible even with limited public data.


Key Questions Answered in the Report
How large is the small-scale LNG market today?
The small-scale LNG market size reached USD 13.04 billion in 2026 and is forecast to rise to USD 21.60 billion by 2031.
What is driving growth in marine LNG bunkering?
Enforcement of IMO sulphur caps and FuelEU Maritime CO₂ rules makes LNG a cost-effective compliance option, stimulating vessel orders and bunkering infrastructure.
Which segment grows fastest in the forecast period?
Floating regasification and transshipment infrastructure expand the quickest, with respective CAGRs of 14.4% and 14.7% through 2031.
Why are modular liquefiers attractive for mining sites?
Plants as small as 10,000 gallons per day monetize stranded gas, cut diesel logistics costs by up to 40%, and now qualify for green financing tied to ISO 14001 standards.
How do U.S. tax incentives impact micro-liquefaction?
The Inflation Reduction Act offers up to USD 1.75 per gallon-equivalent credit for low-carbon LNG and covers 30% of refueling-station costs, significantly improving project economics.
What role does bioLNG play in decarbonization?
BioLNG produced from waste streams can achieve near-zero lifecycle emissions, as seen in the Nordic region where it reached 22% of LNG sales in 2024.
Page last updated on:


